Ijraset Journal For Research in Applied Science and Engineering Technology
- Home / Ijraset
- On This Page
- Abstract
- Introduction
- Conclusion
- References
- Copyright
Live Data Monitoring in Industry
Authors: Shivani Anal, Dr. Sukhvinder Kaur
DOI Link: https://doi.org/10.22214/ijraset.2024.63080
Certificate: View Certificate
Abstract
In contemporary industrial environments, real-time monitoring of critical parameters is vital for ensuring safety, efficiency, and compliance with regulations. This thesis details the development and implementation of an advanced live data monitoring system designed to track temperature, humidity, fire presence, and oxygen levels. Key components of the system include a DHT sensor for temperature and humidity measurement, a fire sensor for fire detection, an oxygen sensor for monitoring atmospheric oxygen, and a buzzer for immediate auditory fire alerts. Central to the system is the ESP8266 WiFi module, which facilitates the wireless transmission of sensor data to ThingSpeak, a cloud-based data collection and visualization platform. This setup allows for continuous, remote monitoring of environmental conditions, providing critical insights and alerts to industrial operators. The project delves into the hardware configuration, sensor calibration, data acquisition processes, and wireless communication protocols essential for effective real-time monitoring. It also addresses the challenges of integrating multiple sensors and ensuring reliable data transmission in an industrial setting. The results demonstrate the system\'s capability to provide accurate, timely data, enhancing safety protocols and operational efficiency. By utilizing IoT technology, the proposed system offers a scalable solution for industrial environments aiming to implement advanced monitoring and alert systems. This work contributes to the field of industrial automation by illustrating a practical application of IoT in improving monitoring and safety measures, highlighting both the technical achievements and practical implications of the implemented system.
Introduction
I. Introduction
The contemporary industrial landscape is marked by increasingly complex processes and stringent safety standards. Ensuring optimal environmental conditions and early detection of hazardous situations is essential for maintaining efficient operations and protecting personnel. Traditional monitoring systems often rely on periodic manual checks or isolated automated systems, which may not provide real-time data or comprehensive coverage. As industries seek to boost productivity and safety, there is a growing need for integrated, real-time monitoring systems capable of continuously tracking critical environmental parameters.
The advent of the Internet of Things (IoT) has transformed various sectors, including industrial monitoring. IoT enables the interconnection of diverse devices and sensors, facilitating seamless data collection, analysis, and transmission. By leveraging IoT technologies, industries can implement advanced monitoring systems that offer real-time insights and automated alerts, significantly improving response times to potential hazards.Temperature and humidity are fundamental environmental parameters that must be monitored in many industrial settings. Excessive heat can damage equipment and compromise product quality, while high humidity can lead to corrosion and mold growth. Conversely, low humidity can cause static electricity buildup, posing a risk to sensitive electronic components. Therefore, maintaining optimal temperature and humidity levels is crucial for operational efficiency and safety.
Fire detection is another critical aspect of industrial safety. Early fire detection can prevent catastrophic damage, saving lives and property. Traditional fire detection systems, like smoke detectors, have limitations in coverage and response time. Integrating fire sensors into an IoT-based monitoring system enhances the ability to detect fires promptly and alert personnel immediately, enabling quick response and mitigation. Oxygen concentration in the atmosphere is a vital parameter, especially in industries involving chemical processes or confined spaces. Insufficient oxygen levels can pose serious health risks to workers, while excessive oxygen levels can increase the risk of fire and explosions. Monitoring oxygen concentration helps ensure a safe working environment and compliance with safety regulations.
This project aims to develop a comprehensive real-time monitoring system for industrial applications using IoT. The system integrates a DHT sensor for temperature and humidity measurement, a fire sensor for fire detection, an oxygen concentration sensor, and a buzzer for immediate alerts. Data collected from these sensors is wirelessly transmitted to the ThingSpeak platform using the ESP8266 WiFi module, enabling remote monitoring and analysis. The proposed system not only provides continuous monitoring but also enhances safety through real-time alerts and data visualization.
By implementing such a system, industries can achieve better environmental control, improve safety protocols, and optimize operational efficiency. This project represents a significant step towards modernizing industrial monitoring systems by harnessing the power of IoT. The rapid advancements in technology have ushered in a new era of industrial automation and smart manufacturing. Central to this transformation is real-time data monitoring, which allows industries to continuously observe and analyze critical operational parameters. This capability is essential for maintaining optimal production conditions, ensuring safety, and enhancing overall efficiency. Despite these advancements, many industrial environments still rely on outdated monitoring techniques prone to human error, delays, and inefficiencies.
II. Literature review
Pu?cko et al. [5] employ depth cameras for real-time progress monitoring, but rather than using an AR headset, they attach depth cameras to workers’ helmets. Point cloud fragments representing real-time progress are merged and converted into an as-is BIM, which is then compared to the as-designed 4D BIM to track progress. This process requires some manual intervention, and the authors note that achieving full automation with 3D data remains a challenge. Automated progress monitoring often necessitates integrating data from various sensors and sources, such as RGB, lidar, UWB, RFID, BIM, schedules, and more, depending on the context.
El-Omari and Moselhi [6] suggest solutions based on data fusion. They demonstrate that data fusion offers advantages over using individual sources of information, such as enhancing object-based material tracking and object detection. Another common goal in monitoring static construction environments is quality control.
III. Objectives
- .Develop a system capable of continuously monitoring temperature, humidity, fire presence, and oxygen concentration in real-time.
- Utilize DHT sensors, fire sensors, oxygen concentration sensors, and a buzzer to create a comprehensive monitoring network.
- Utilize the ESP8266 WiFi module to transmit sensor data wirelessly to the ThingSpeak platform, enabling remote access and real-time monitoring.
- Program the system to automatically trigger alerts, such as activating a buzzer or sending notifications through ThingSpeak, when abnormal conditions, such as fire or critical levels of oxygen, are detected.
- Utilize ThingSpeak's cloud platform for data storage, visualization, and analysis, allowing for informed decision-making and proactive management based on real-time insights
IV. methodology
A. Block Diagram of the System.
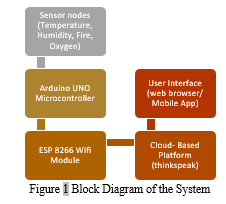
The monitoring system functions as a cohesive network, with interconnected components working seamlessly to collect, process, and transmit sensor data within an industrial environment. At its core, the system relies on strategically placed sensor nodes, each equipped with a variety of sensors, including temperature, humidity, fire, and oxygen concentration sensors.
These nodes act as primary data collectors, continuously monitoring the environment and sending relevant information to the central processing unit, the Arduino UNO microcontroller.
The Arduino UNO microcontroller serves as the system's central hub, efficiently handling data acquisition and control functions. It directly interfaces with the sensors, retrieving readings at regular intervals and running data processing algorithms to ensure accuracy and integrity. After collecting and processing the sensor readings, the Arduino UNO uses the ESP8266 WiFi module to establish a wireless connection to the local network.
Once connected, the sensor data is transmitted from the Arduino UNO to a cloud-based platform, such as ThingSpeak, for storage, visualization, and analysis. This platform serves as a centralized hub, aggregating and processing sensor data from multiple nodes throughout the industrial environment. It provides a robust infrastructure for storing historical data, generating real-time insights, and enabling remote monitoring and control.
Users interact with the monitoring system through a web-based user interface (UI), accessible via standard web browsers or mobile applications. The UI features intuitive dashboards and interactive visualizations, allowing users to monitor real-time sensor readings, track historical data trends, and assess system status. Additionally, the UI offers functionalities for configuring alert thresholds, setting up notifications, and accessing detailed data analytics tools.
B. Data flow and Communication Mechanisms.
The data flow and communication mechanisms within the monitoring system are meticulously orchestrated to ensure the efficient transmission of sensor data from the industrial environment to the cloud-based platform, facilitating real-time monitoring and analysis. The data journey begins at the sensor nodes, which are strategically placed throughout the facility. Sensors for temperature, humidity, fire, and oxygen concentration continuously capture environmental parameters and convert these physical measurements into electrical signals. These signals are then relayed to the Arduino UNO microcontroller for processing.The microcontroller, acting as the system's central processing unit, executes algorithms to filter, normalize, and aggregate raw sensor data. This processed data is then transmitted to the ESP8266 WiFi module for wireless communication. The ESP8266 WiFi module connects to the local WiFi network, enabling seamless data packet transmission to external systems. Through serial communication interfaces like UART, the microcontroller communicates with the WiFi module, facilitating data transfer over the wired connection.
Once the data reaches the cloud-based platform, such as ThingSpeak, it undergoes storage, processing, and analysis. Backend services within the cloud platform receive incoming data packets, validating and aggregating sensor readings as necessary. Using RESTful APIs or messaging protocols, communication between the ESP8266 WiFi module and the cloud platform's servers ensures efficient data ingestion and processing. The platform's infrastructure guarantees the integrity and accessibility of the collected data, providing users with a reliable source of information for monitoring and analysis.Users interact with the monitoring system through a web-based user interface (UI), accessing real-time sensor data, historical trends, and system status. Through HTTP requests or WebSocket protocols, bidirectional communication between the UI and the cloud platform enables responsive and interactive user experiences. The UI offers intuitive visualization tools, allowing users to interpret sensor data and make informed decisions based on actionable insights derived from the data..
C. Interaction between Hardware and Software Components
The interaction between the hardware and software components in the monitoring system is not just a mechanical process but a dynamic exchange that is crucial to the system's functionality and effectiveness. At the core of the system, the hardware components, including the sensor nodes and microcontroller, act as the sensory organs and processing unit, capturing environmental data and converting it into digital signals for further analysis. These hardware elements work seamlessly with the software layers that orchestrate data acquisition, processing, and transmission.
Within the microcontroller, software routines manage the initialization and communication with sensors, ensuring reliable data acquisition. This involves configuring sensor parameters, such as sampling rates and communication protocols, to optimize performance and accuracy. The microcontroller processes raw sensor data through predefined algorithms, extracting relevant information and preparing it for transmission to higher-level systems.
The communication link between the microcontroller and the ESP8266 WiFi module is a crucial interface, enabling wireless connectivity and data transfer. Software modules on the microcontroller establish communication channels, handling data buffering, packetization, and error detection to ensure robust data transmission over the network. Concurrently, software running on the ESP8266 WiFi module manages network connectivity, including authentication, encryption, and data routing protocols, to establish a secure and reliable connection with the cloud-based platform.
Once data reaches the cloud-based platform, a sophisticated interplay of software components takes over. Backend services receive incoming data packets, parsing and processing them to extract relevant sensor readings.
These software modules handle data validation, error correction, and storage, ensuring the integrity and accessibility of the collected data. Additionally, the platform's software provides APIs and interfaces for user interaction, enabling real-time data visualization, historical analysis, and system configuration.
The user interface (UI) acts as the primary interaction point between human operators and the monitoring system, facilitating intuitive access to sensor data and system controls. Through carefully designed graphical interfaces, users can visualize sensor readings, set threshold values, configure alert mechanisms, and analyze historical trends. Software components within the UI layer translate user inputs into actionable commands, communicating them to the backend services for execution and system response.
The interaction between the hardware and software components within the monitoring system embodies a symbiotic relationship, where each element complements and enhances the functionality of the other. This harmonious integration allows the system to achieve its overarching goal of enabling real-time monitoring, analysis, and decision-making in industrial environments, ultimately contributing to enhanced safety, efficiency, and productivity..
D. Circuit Diagrams and Hardware Integration
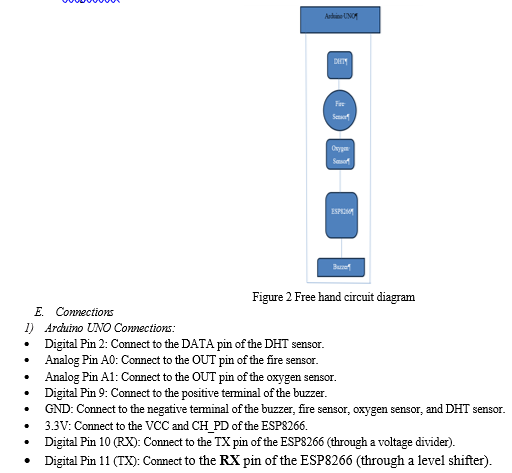
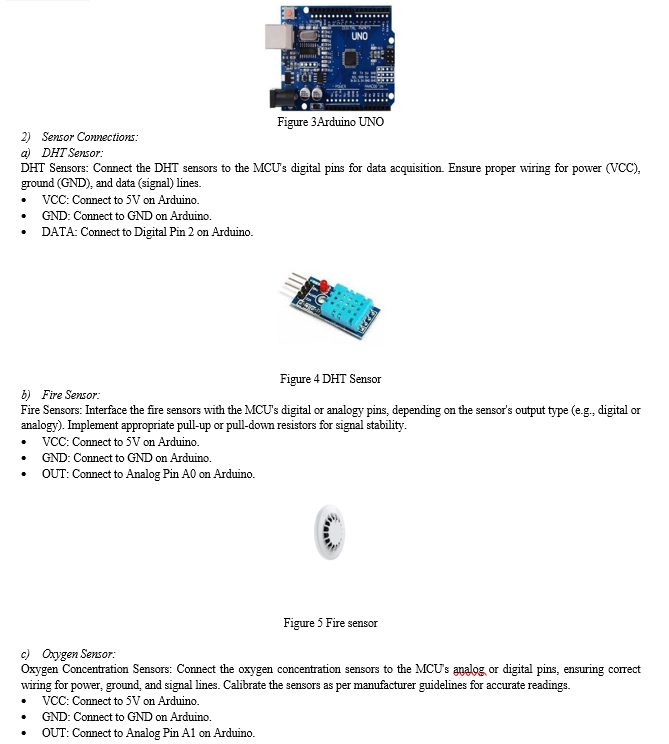
Developing detailed circuit diagrams and outlining hardware integration processes requires a thorough understanding of the system architecture, component specifications, and connectivity needs. Below is an overview of the circuit diagrams and hardware integration process for the monitoring system, emphasizing sensor connections, microcontroller interfacing, and ESP8266 WiFi module integration..
F. Hardware Integration:
- Sensor Mounting and Positioning:
- Mount sensors at strategic locations within the industrial facility to capture representative environmental data.
- Ensure proper positioning and orientation of sensors for optimal performance and accuracy.
- Use weatherproof enclosures and mounting hardware to protect sensors from environmental hazards (e.g., moisture, dust, temperature extremes).
2. Microcontroller Deployment
- Install the MCU (Arduino UNO) in a secure and accessible location within the facility.
- Connect sensors to the MCU's input/output pins using appropriate wiring and connectors.
- Securely mount the MCU to a stable surface or enclosure, ensuring protection against physical damage or tampering.
3. ESP8266 Wi-Fi Module Installation
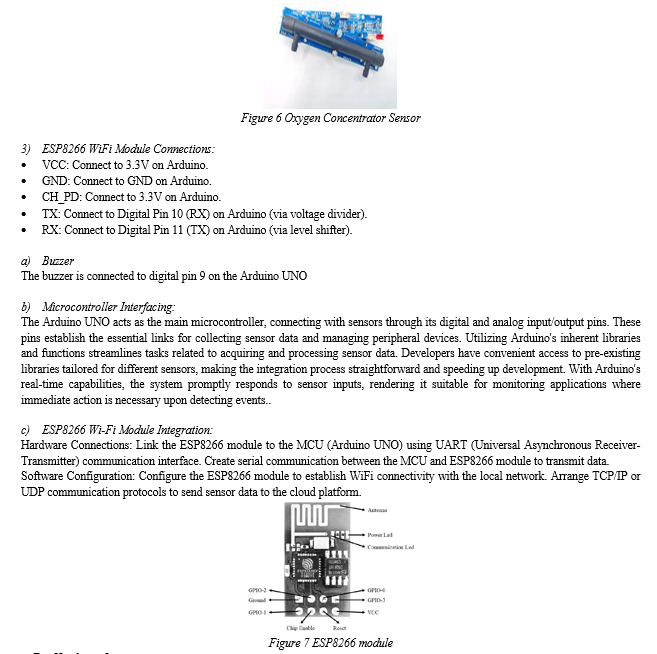
- Integrate the ESP8266 module with the Arduino's UART interface for serial communication.
- Connect the ESP8266 module to the Arduino's power and ground pins, ensuring proper voltage levels and current requirements.
- Configure the ESP8266 module's WiFi settings and network credentials using AT commands or dedicated configuration interfaces.
4. Testing and Validation
- Conduct comprehensive testing of the hardware setup to ensure proper functionality and sensor accuracy.
- Verify sensor readings, communication protocols, and data transmission to the cloud platform.
- Troubleshoot any hardware or connectivity issues and fine-tune system parameters as needed for optimal performance.
G. Software Design
Developing the software for the monitoring system requires a systematic approach to organizing the different components responsible for data processing, communication, and system management. Central to the software design is the establishment of a modular architecture, which divides the software into manageable components, each addressing specific functionalities. This modular design promotes code reuse, scalability, and ease of maintenance, facilitating smoother development and future improvements.The software architecture adopts a layered design pattern to segregate responsibilities and promote modularity. Different layers are defined for distinct functions such as data acquisition, processing, communication, and user interface. This layered architecture ensures clear separation of concerns, making it simpler to comprehend, develop, and maintain the software components.
The functional components of the software encompass various aspects of system operation, including data acquisition, processing, communication, and user interaction. The data acquisition module interfaces with sensors, retrieves sensor readings, and manages sensor calibration and error handling. The data processing module includes algorithms for interpreting sensor data, detecting anomalies, and triggering alerts based on predefined thresholds. Communication modules facilitate the exchange of sensor data between the monitoring system and external entities, such as cloud platforms or user interfaces. Lastly, the user interface module provides a graphical interface for users to monitor system status, view sensor readings, and configure system settings.
Integrating software components involves programming the microcontroller to control sensor interfacing, data processing, and communication tasks. Firmware development, such as writing Arduino sketches or Python scripts, enables the microcontroller to execute sensor reading routines, process data, and transmit information to external devices or platforms. Additionally, integrating the ESP8266 WiFi module requires configuring wireless connectivity, implementing communication protocols, and managing network setup and data transmission.Robust error handling and recovery mechanisms areintegrated into the software to detect and recover from faults or failures. This includes error logging, exception handling, and retry mechanisms to manage communication errors, sensor failures, or network disruptions. Furthermore, failover strategies are implemented to ensure system resilience and continuity of operations, particularly in mission-critical industrial environments.
Testing and validation are crucial parts of the software development process, involving thorough testing of individual modules and system integration. Unit testing, integration testing, and system testing are conducted to validate functionality, reliability, and performance under simulated and real-world conditions. This iterative testing approach helps identify and address potential issues early in the development cycle, ensuring the software meets the desired requirements and performance criteria..
H. Programming Environment and Tools.
Choosing the programming environment and tools for developing the monitoring system's software is a pivotal decision that profoundly influences the efficiency and effectiveness of the development process. One commonly utilized option is the Arduino Integrated Development Environment (IDE), tailored explicitly for programming Arduino microcontrollers.
Featuring a user-friendly interface and extensive library support, the Arduino IDE streamlines tasks such as code writing, compilation, and uploading. It incorporates built-in functionalities like syntax highlighting, code completion, and a serial monitor, catering to developers of all proficiency levels. Alternatively, Visual Studio Code (VS Code), a versatile code editor, offers advanced capabilities and customization options. Supporting various programming languages and equipped with an array of extensions, VS Code provides a more adaptable environment for microcontroller programming, including Arduino development.
In addition to the programming environment, libraries and frameworks play a pivotal role in software development. Arduino libraries furnish pre-written code modules for interfacing with sensors, communication modules, and other peripherals. These libraries abstract low-level hardware interactions and furnish high-level APIs for sensor communication and data processing, significantly streamlining the development process. For instance, the DHT sensor library facilitates seamless integration with DHT sensors, while libraries like ESP8266WiFi enable WiFi connectivity and data transmission with the ESP8266 module.
Version control systems, such as Git, are indispensable tools for managing code changes, collaboration, and project tracking. By leveraging version control platforms like GitHub or GitLab, developers can monitor changes, collaborate effectively with team members, and maintain a history of project modifications. Additionally, version control enhances code reliability, facilitates code reviews, and enables efficient bug tracking and resolution.
Simulation and testing tools are essential for validating software functionality and performance. Tools like Proteus and Tinkercad offer simulation capabilities for testing circuit designs and microcontroller behavior in virtual environments. Hardware-in-the-loop (HIL) testing frameworks allow developers to test software on real hardware components, providing a more accurate representation of system behavior and performance. By integrating simulation and testing into the development workflow, developers can identify bugs early, optimize code performance, and ensure the reliability of the final software product.
Documentation tools play a pivotal role in maintaining code readability, fostering collaboration, and ensuring knowledge transfer among team members.
Tools like Doxygen, Javadoc, and Sphinx automate the process of generating comprehensive documentation from code comments and annotations. These documentation tools enable developers to create API references, user guides, and technical documentation effortlessly, enhancing project transparency and accessibility.
Selecting the right programming environment and tools is paramount for streamlining the software development process of the monitoring system. By leveraging integrated development environments, libraries, version control systems, simulation tools, and documentation tools, developers can enhance productivity, improve code quality, and expedite project delivery. Additionally, staying abreast of emerging tools and techniques is essential for adapting to evolving software development practices and maximizing development efficiency.
I. Data Processing and Formatting
Data processing and formatting constitute pivotal stages within the monitoring system's software architecture, serving to refine raw sensor data into actionable insights that can inform decision-making and analysis. At the outset, data cleaning commences, targeting the elimination of noise, outliers, and other irregularities that might distort the accuracy of measurements. This involves the implementation of techniques such as outlier detection to identify and discard aberrant data points, noise filtering to attenuate high-frequency disturbances, and missing value imputation to estimate and fill gaps in the dataset, ensuring data continuity and completeness.
Following data cleaning, the processed data undergoes normalization, a process designed to standardize its scale and range, thereby facilitating meaningful comparisons and analyses across different sensors or time frames. Common normalization techniques include min-max scaling, which rescales data to a predefined range based on observed minimum and maximum values, and z-score standardization, which transforms data to have a mean of zero and a standard deviation of one, enabling the identification of outliers relative to the mean.
As data volumes increase or multiple sources contribute to the dataset, data aggregation becomes essential for managing complexity while retaining pertinent information. Temporal aggregation involves grouping sensor readings into larger time intervals (e.g., hourly or daily averages) to capture long-term trends, while spatial aggregation consolidates data from multiple sensors within the same geographical area or facility, generating aggregated statistics or summaries for monitoring purposes.
Finally, formatted data is crucial for compatibility with downstream analysis tools, visualization platforms, and storage systems. Various formats and protocols may be employed, including JSON for lightweight, human-readable data interchange, CSV for tabular data suitable for spreadsheet applications, and protocol buffers or message pack for efficient binary serialization in resource-constrained environments or high-throughput applications.
V. results
Presenting data collected over time is vital for grasping trends, patterns, and fluctuations in environmental parameters within industrial settings. Through visualizations and summaries, stakeholders can extract insights into the evolution of conditions, recognize recurring patterns, and evaluate the effectiveness of interventions or control measures. For instance, analysis of temperature trends may unveil seasonal variations or pinpoint instances of overheating in specific facility areas. Presentations of humidity data could highlight periods of excessive moisture, potentially signaling areas prone to mold growth or corrosion. Examination of fire detection data might illustrate the frequency and severity of fire incidents, aiding in prioritizing fire prevention measures or refining response protocols. Additionally, analyses of oxygen levels can offer insights into air quality, ventilation efficacy, and potential health risks for personnel. By showcasing data collected over time, stakeholders can develop a comprehensive understanding of environmental dynamics, enabling proactive decision-making and risk management strategies.Assessing temperature, humidity, fire detection, and oxygen levels is critical for evaluating environmental conditions and ensuring industrial operations' safety and efficiency. Temperature analysis enables stakeholders to monitor thermal conditions, detect trends, and evaluate compliance with regulatory standards or operational requirements. Humidity analysis provides insights into moisture levels, assisting in corrosion prevention, mold growth mitigation, or safeguarding materials sensitive to humidity fluctuations. Fire detection analysis involves assessing the frequency, duration, and severity of fire incidents, empowering stakeholders to enhance fire prevention measures, improve emergency response protocols, and mitigate risks to personnel and assets. Oxygen level analysis is essential for monitoring air quality, ensuring adequate ventilation, and preventing health hazards related to oxygen deficiency or excess. By conducting thorough analyses of these environmental parameters, stakeholders can proactively address issues, optimize operational processes, and maintain a safe and productive work environment..
A. System Performance
Ensuring the system's performance meets established requirements is essential for its effectiveness and reliability in real-world industrial applications. This comprehensive assessment encompasses various aspects, including the reliability and accuracy of sensor readings, network connectivity, and data transmission efficiency. Let's delve into each component to provide a detailed understanding of the system's performance:
Reliability and accuracy of sensor readings are crucial for providing dependable data for decision-making and control processes in the industrial environment. This evaluation involves assessing the consistency, precision, and stability of sensor measurements over time. It considers factors like sensor calibration, drift, sensitivity, and environmental influences that may affect the data's quality. Through rigorous testing and validation procedures, including comparison against reference standards and environmental conditions, the system's capability to deliver accurate and reliable sensor readings can be evaluated. Any discrepancies or deviations from expected performance should be identified and rectified to ensure data integrity and operational effectiveness..
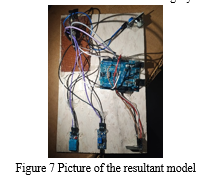
The efficiency and reliability of network connectivity are pivotal in enabling smooth data transmission from sensor nodes to the cloud-based platform. This assessment entails evaluating the stability, throughput, latency, and packet loss rates of the communication network. It involves testing under diverse operational conditions, such as network congestion, interference, or signal attenuation, to gauge the system's resilience and performance robustness. Furthermore, the effectiveness of data transmission protocols and mechanisms, including error checking, retransmission, and packet prioritization, should be examined to ensure optimal utilization of network resources and prompt delivery of sensor data.
Through performance benchmarking and stress testing, the system's ability to maintain consistent and reliable connectivity across various scenarios can be appraised, pinpointing areas for optimization and enhancement.
System performance evaluation necessitates comparing actual outcomes with predefined requirements, specifications, and performance metrics. This assessment ensures alignment with stakeholders' expectations and needs, encompassing operational, functional, and technical criteria. Key performance indicators (KPIs), like data accuracy, response time, availability, and scalability, serve as metrics for comprehensive system performance measurement and evaluation. By conducting quantitative analysis and qualitative assessments, stakeholders can ascertain the system's effectiveness, identify strengths and weaknesses, and prioritize improvement initiatives. Additionally, soliciting user feedback, gathering stakeholder input, and leveraging operational experience provide valuable insights for evaluating system performance and guiding continuous improvement endeavors.
Conclusion
The development and implementation of the monitoring system signify a significant advancement in industrial monitoring and control technology. By utilizing IoT-based sensors, wireless connectivity, and cloud-based platforms, the system delivers real-time insights into environmental conditions, enabling proactive decision-making, risk management, and operational enhancement. Through case studies and practical applications across various industrial sectors such as manufacturing, logistics, utilities, and pharmaceuticals, the system has demonstrated its effectiveness in improving safety, efficiency, and productivity. Comparative analysis against existing systems has underscored the system\'s advantages, including real-time monitoring, seamless connectivity, scalability, and automation. Feedback from industrial users has provided valuable insights into system performance, usability, and areas for enhancement, guiding continuous refinement efforts. Despite its strengths, the system remains open to further innovation and optimization, with opportunities for improving sensor accuracy, data visualization, integration, and predictive analytics capabilities. As industries increasingly embrace digital transformation and IoT technologies, the monitoring system is poised to play a crucial role in shaping the future of industrial operations. By fostering collaboration, innovation, and ongoing improvement, stakeholders can fully leverage the system to address emerging challenges, capitalize on new opportunities, and drive sustainable growth in the industrial sector. In this dynamic landscape, the monitoring system serves as a testament to the transformative power of technology in empowering organizations, safeguarding assets, and ensuring the welfare of workers in an evolving industrial environment..
References
[1] Li S, Kulkarni G, Berg TL, Berg AC, Choi Y. Composing simple image descriptions using web-scale n-grams. In: Proceedings of the Fifteenth Conference on Computational Natural Language Learning, 2011, pp. 220–228 [2] Lin D. An information-theoretic defnition of similarity. In: Proceedings of the Fifteenth International Conference on Machine Learning, 1998, pp. 296–304 [3] Vinyals O, Toshev A, Bengio S, Erhan D. Show and tell: A neural image caption generator. In: IEEE Conference onComputer Vision and Pattern Recognition, 2015, pp. 3156–3164. [4] Jing Z, Kangkang L, Zhe W. Parallel-fusion lstm with synchronous semantic and visual information for image captioning. J Vis Commun Image Represent. 2021;75(8): 103044. [5] Jia X, Gavves E, Fernando B, Tuytelaars T. Guiding the long-short term memory model for image caption generation. In: Proceedings of the IEEE International Conference on Computer Vision (ICCV), 2015 [6] Gao L, Wang X, Song J, Liu Y. Fused GRU with semantic-temporal attention for video captioning. Neurocomputing. 2020;395:222–8. [7] Anderson P, He X, Buehler C, Teney D, Johnson M, Gould S, Zhang L. Bottom-up and top-down attention for image captioning and visual question answering. In: CVPR, 2018: pp. 6077–6086. [8] Fu K, Jin J, Cui R, Sha F, Zhang C. Aligning where to see and what to tell: image captioning with region-based attention and scene-specifc contexts. IEEE Trans Pattern Anal Mach Intell. 2017;39(12):2321–34. [9] Farhadi A, Hejrati M, Sadeghi MA, Young P, Rashtchian C, Hockenmaier J, Forsyth D. Every picture tells a story: generating sentences from images. In: Computer Vision – ECCV, 2010, pp. 15–29 [10] Kulkarni G, Premraj V, Dhar S, Li S, Choi Y, Berg AC, Berg TL. Baby talk: understanding and generating simple image descriptions. In: CVPR, 2011; pp. 1601–1608. [11] Mitchell M, Han X, Dodge J, Mensch A, Goyal A, Berg A, Yamaguchi K, Berg T, Stratos K, Daumé H. Midge: Generating image descriptions from computer vision detections. In: Proceedings of the 13th Conference of the European Chapter of the Association for Computational Linguistics, 2012; pp. 747–756.
Copyright
Copyright © 2024 Shivani Anal, Dr. Sukhvinder Kaur. This is an open access article distributed under the Creative Commons Attribution License, which permits unrestricted use, distribution, and reproduction in any medium, provided the original work is properly cited.

Download Paper
Paper Id : IJRASET63080
Publish Date : 2024-06-03
ISSN : 2321-9653
Publisher Name : IJRASET
DOI Link : Click Here
 Submit Paper Online

