Ijraset Journal For Research in Applied Science and Engineering Technology
- Home / Ijraset
- On This Page
- Abstract
- Introduction
- Conclusion
- References
- Copyright
Lung Cancer Detection Using Machine Learning
Authors: D Narsimha Reddy , C Ganesh, K Shiva Abhigna, P Tharun Sai
DOI Link: https://doi.org/10.22214/ijraset.2024.59257
Certificate: View Certificate
Abstract
Lung cancer ranks among the primary causes of death on global scale. Catching this disease early can increase your chances or opportunities of survival. Computer-assisted detection (CAD) is used to create CT images and even X-rays of the lungs to determine whether cancer is present in the images. This paper represents an image classification by the combination of a neural network (CNN) algorithm and support vector machine (SVM). The algorithm spontaneously separates and analyzes lung picture or image to detect cancer cells. Compared to full-scale networks, CNNs are easier to train and have less overhead. We introduce CNN-SVM because it has accurate performance than other existing terminologies. The merits of this method are that it can detect cancer on the CT image
Introduction
I. INTRODUCTION
Pulmonary carcinoma screening is the process of determining the appearance or occurrence of lung disease or cancer in a person. This process can be done through a variety of medical technologies and procedures, including diagnostic tools and even machine learning and deep learning. Lung cancer generally falls into two primary categories: small cell lung carcinoma and non-small cell lung carcinoma (adenocarcinoma and squamous cell carcinoma are subtypes). These distinct types of lung carcinoma have different growth and also, they are differently treated. Non- small cell lung cancer prevails more in number than small cell lung cancer [1].
Lung carcinoma is one of the types of cancer. It is highly difficult to diagnose because it occurs in the last stage and shows symptoms. However, rate of mortality and morbidity can be decreased with early diagnosis of the disease. CT imaging, the best imaging technology, is reliable for lung cancer diagnosis because it can reveal any desired and invisible lung cancer lump [2]. However, differences between computed tomography images and the determination of anatomical structures by the physicians and the radiologists may cause diagnostic problems in the collection of cancer cells [3].
In recent years, computerized diagnostics has emerged as an additional and promising tool to assist radiologists and physicians in diagnosing cancer [4]. Many systems and studies have been developed for the identification or recognition of lung cancer through various examinations as well as analysis.
However, the detection accuracy of some systems is not satisfactory, and some systems still need to be gained to achieve the highest accuracy close to 100%. Machine learning and Image processing are used in the early detection and classification process of lung cancer.
II. RELATED WORK
In this section we have studied various implementations of lung carcinoma detections & we summarized our findings and concluded by researching & referencing various papers. They are: Mokhled S. Al-Tarawneh [5]. Lung cancer is a deadly disease in which abnormal cells multiply and develop into tumors. Cancer cells can be removed from the lungs by the blood or lymphatic fluid around the lungs. Lymph flows through lymphatic vessels to the lymph nodes in the middle of the lungs and chest. Lung cancer often spreads to the chest area because the lymph nodes in the lung drain into the area of chest. Metastasis comes when cancer lumps or cells exit their site of origin and migrate via blood vessels to the tumor or other parts of body [6]. Many researchers have proposed and applied different imaging techniques and machine learning to diagnose lung cancer.
Aggarwal, Furquan and Kalra [7] proposed a system which allows the process of classification of nodules and lung organs. This method pull-out statistical, geometric and grayscale features. LDA is used as the best method for classification and segmentation. The system provides accuracy of 84%, sensitivity of 97.14%, and the specificity of 53.33%. Although the system has detected cancer cells, its accuracy is not accepted. Machine learning techniques were not used for classification and simple segmentation methods were preferred. It is therefore not better to combine one of its steps in our new proposed model.
Jin, Zhang, and Jin [8] used the deep learning methodology called convolutional neural networks as classifiers in CAD systems to diagnose carcinoma of lungs. The system provides 84.6% of accuracy and 82.5% of sensitivity, and the specificity of 86.7%.
The merit of this method is that it uses circular filters in the region of interest extraction stage, thus decreasing cost of the training and analysis steps. Even though its usage rate has decreased, its accuracy is still not good.
Sangamithraa and Govindaraju [9] used the ML algorithm that is K-means unsupervised learning algorithm for the process of clustering or segmentation. It forms the group of data of pixels on the basis of certain characteristics. The model uses a backpropagation network for classification. Entropy, correlation, uniformity, SSIM, PSNR etc. Use the Gray Level Co-occurrence Matrix method to extract features such as The accuracy of the system is approximately 90.7%. Image Preprocessing Median filters are used to remove noise; This is important for our new model to overcome from noise and improve the accuracy performance.
Roy, Sirohi and Patle [10] developed a system for the diagnosis of lung cancer nodules using a fuzzy relationship and a function model. This system uses grayscale conversion to improve contrasting of image. Image is binarized before segmentation and the image is segmented as a result using a reference contour model. Cancer is classified using a technique called fuzzy inference techniques. Area, mean, entropy, correlation, major axis length and minor axis length, etc. Remove features like. to show the classifier. Overall system accuracy is 94.12%. Given its limitations, this model does not classify future tumors as benign (cancerous) or malignant which is termed as (cancerous).
III. PROPOSED METHODOLOGY
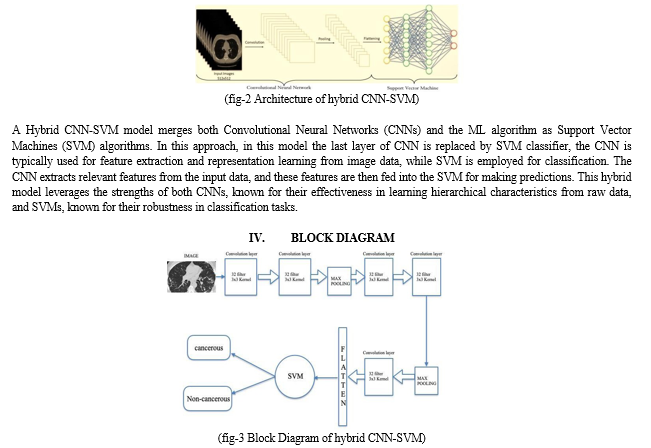
Advance diagnosis of lung cancer can reduce mortality. It is main principal to catch cancer early, prevent its development, and eliminate it early before it starts to grow rapidly. Technology and deep learning are broadly used in medicine to monitor, detect, classify, and predict diseases. Our system includes a CNN-SVM architecture that removes and deletes redundant information that affects accuracy. This is done in the step of integrating the CNN architecture used to determine cancer cells in a (FCN) using the modified version of SVM model.
- Convolutional Neural Network (CNN): The deep learning methodology preferred in this research-based study is a convolutional neural network (CNN). It is known for multilayer feedforward neural network which is biologically influenced [11]. CNN has many layers, and they can be separated in three stages: convolutional (which computes the output of regional connections in neurons), max pooling (subsampling of inputs), and fully connected layer (used to calculate the Activation of every class).
The input source of the CNN is an (a x a x b) image; where a is the width and height, b is the total number of channels, and in the convolutional process there will be k convolution filters of size n x n, where n < a. Create a CNN and fit the data. The CNN model has 4 steps: 1. Convolution layers; 2. Pooling layer; 3. Flattening layers 4. fully connected. (Fig 1) [12] (CNN architecture)

In the convolutional layer, feature maps are defined by dot product process of the input image and feature detectors. More feature maps are produced and the size of the image is reduced for uncomplicated processing. Since many detectors are used, different features have been developed. In this step, the ReLU Rectified linear unit activation function is used to add nonlinearity to CNN (since the image is generally nonlinear). In pooling layer stage, the resolution of feature maps is decreased; This step uses maximum pooling.
At this stage, a lot of unnecessary data is removed, which has a positive impact on getting good results because irrelevant/insignificant data will not be entered into a completely connected process. In the flattening stage, the feature map of pooled form which are the output of pooling layer is flattened into a single column or block. This is done to pass this block or column into the Support Vector Machine (SVM) model. Finally, all the features are processed in the merging process of SVMs, resulting in one of four options: cancers like adenocarcinoma, and greater cell carcinoma, normal(non-cancerous), or squamous cell carcinoma.
a. Convolution layer: Convolution layer is the important building block of CNN. It has layers (or kernels) that it has not learned throughout training. The size of the filter is generally smaller than the actual image. Each filter is equipped with images and creates activation map. For convolution, the filter slides across the height and width of the image, and the point features of each element of the filter and input are calculated at each position.
b. Pooling layer: Pooling layer is used to decrease the feature map. Therefore, it reduces the number of unlearned information and the computational cost in the network. This step shows the available features in the feature map created by the convolution layer. Therefore, additional processing is performed on content features rather than the fully localized features that convolutional layers do. This makes the model more robust to changes at certain locations in the input image. These are two types 1) max pooling 2) min pooling.
c. Flattening layer: Flattening is used to transform all two-dimensional arrays created by combining the image into a long chain (single long continuous linear vector). The flattened matrix is fed as input to all compositing operations to segment the image i.e fully connected layer.
d. Fully connected layer: this layer is feed forward neural network; these are the last few layers of CNN. The input to this layer is the output of pooling and flattening layers output.
2. Support Vector Machine (SVM): SVM is one of the prominent machine learning algorithm used for learning techniques used in classification and also for regression problems. Even though, in machine learning concept it is widely used only in classification problems which classify two different classes. The motivation and purpose of the SVM algorithm is to create a boundary of decision which can divide the space of n-dimensional or spatial space into clusters so that we can place new data into correct clusters in future. This clear-cut boundary is called as hyperplane. SVM chooses point vectors which can help to creates a general plane. These states are called support vectors, so the algorithm is called as SVM.

V. IMPLEMENTATION
The accomplishment of a hybrid CNN-SVM algorithm for lung cancer detection involves a mixture of both Convolutional Neural Networks (CNNs) and Support Vector Machines (SVM). Where CNNs are used extraction of characteristics from images with the classification capabilities of SVM. It starts with the procedure of data collection by obtaining a dataset containing images of lung scans along with corresponding labels indicating whether each scan contains cancerous regions or not. It's crucial to have a diverse and representative dataset for training a robust model.
In addition, by following the method of preprocessing it preprocesses the images to standardize their size, resolution, and intensity levels. Common preprocessing steps include resizing, normalization to enhance the model's ability to discover the unseen data. Then it extracts the features by training a CNN architecture to draw out meaningful features from the lung scan images.
The CNN is typically composed of layers like convolutional for feature extraction, pooling layers and finally fully connected layers for classification. Then it represents the feature after training the CNN and uses it as a feature extractor to obtain feature representations (vectors) for each image in the dataset. The output of one of the last layers before the classification layer can be considered as high-level features representing the input image. Training SVM is one of the important steps using the extracted features as inputs to train an SVM classifier. SVMs are powerful discriminative models that aim to find the optimal hyperplane to separate different classes in the feature space. By training an SVM on the CNN-extracted features, we leverage the discriminative power of SVMs to perform the last classification task.
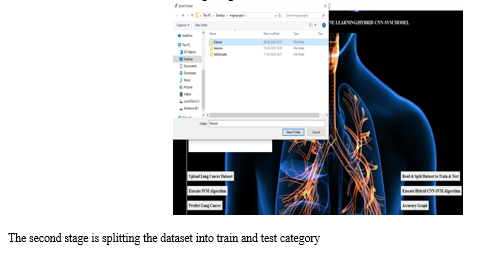
Assess the performance of the hybrid CNN-SVM model using numerous measures such as recall, precision, accuracy, F1- score, and area under the curve of ROC (AUC). Split the dataset into validation, training, and test sets to assess the model generalization ability. Once the hybrid model achieves satisfactory performance on the validation set, deploy it in a real-world setting for lung cancer detection. Continuously monitor and optimize the model's presentation over time, considering factors such as data drift, model drift, and emerging clinical insights. By combining the feature extraction capabilities of CNNs with the classification prowess of SVMs, the hybrid approach aims to leverage the complementary strengths of both models to enhance lung cancer detection accuracy and robustness.
VI. RESULTS AND DISCUSSIONS
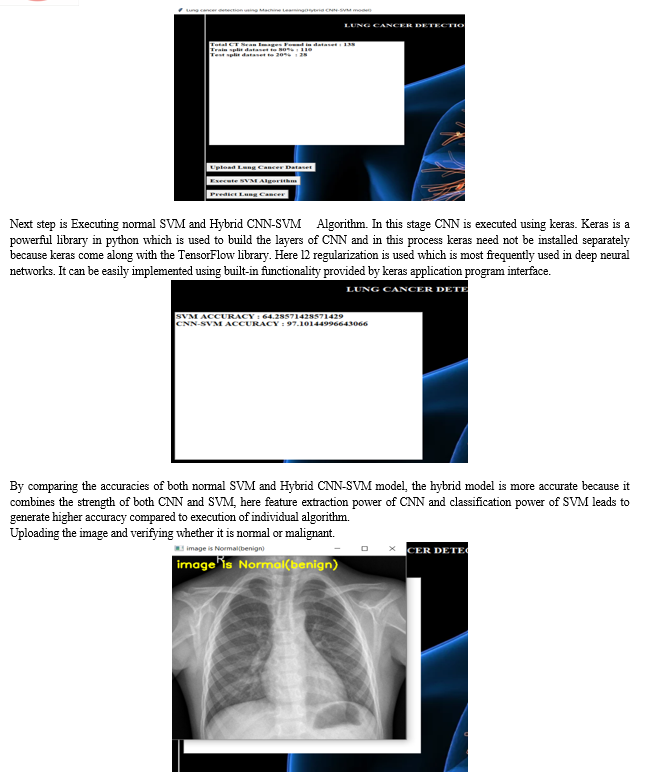
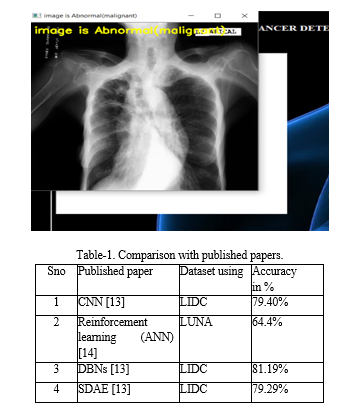
An experimental study was conducted on the suggested hybrid CNN-SVM model with the help of the lung image dataset obtained from Kaggle. This test scenario contains the images of lungs. These lung images are sent upon request. Diagnostic rules are then created from these images and transferred to the (SVM) for learning process. The learning process will start from its own process and finally it will check the images of the lungs for cancer. The last one is to evaluate whether the proposed method increases the accuracy of the detection. Accuracy refers to the predictions which are correct and is divided by the predictions of all the possible cases. The accuracy of the output is the key in determining the finest algorithm for future use. The more accurate algorithm gives the best output.
The results we get will be in the form of GUI, the first stage is uploading dataset which we have downloaded from Kaggle which consists of both normal and abnormal lung images.


Conclusion
In summary, this study merges both CNN and SVM to detect tumor nodes including large cell carcinoma, adenocarcinoma, normal or squamous cell carcinoma on lung Computed Tomography images and verify if it is cancerous that is (Abnormal) or non-cancerous that is (Normal). The purpose of this study is to get a high stage of accuracy, which is the focus of all computer-assisted analysis. The methodology was implemented to all the chest CT scan image dataset, a standard and openly available set of CT images. The level of accuracy can be further elevated by increasing the set of the number of images used for the procedure. In addition, many types of x-rays, can be evaluated using this methodology. It should be possible to check all these pictures. By learning and analyzing the predictive results of various types of images, medical professionals will be able to use the most appropriate pictures to diagnose lung disease.
References
[1] https://www.nccn.org/professionals/physician_gls/default.aspx. [2] Gindi,A. M., Al Attiatalla, T. A., & Sami, M.M. “A Comparative Study for Comparing Two Feature Extraction Methods and Two Classifiers in Classification of Earlystage Lung Cancer or disease Diagnosis of the chest x-ray images(2014).” Journal of the American Science, 10(6): 13-22. [3] Suzuki, K., Kusumoto, M., Watanabe, S. I., Tsuchiya, R.,& Asamura, H. (2006) “Radiologic classification of small adenocarcinoma of the lung: radiologic-pathologic correlation and its prognostic impact,” The Annals of Thoracic Surgery. 813-419. [4] Xiuhua,G., Tao, S., & Zhigang, L. “Prediction Models for Malignant Pulmonary Nodules Based-on Texture Features of CT Image.” In Theory and Applications of CT Imaging and Analysis. DOI: 10.5772/14766. [5] Mokhled S. Al-Tarawneh(August,2012),Lung Cancer Detection Using Image Processing Techniques. K. Elissa, “Title of paper if known,” unpublished. [6] http://www.katemacintyrefoundation.org/pdf/nonsmall-cell.pdf, Adapted from National Cancer Institute (NCI) and Patients Living with Cancer (PLWC), 2007, (accessed July 2011). [7] Aggarwal, T., Furqan, A., & Kalra, K. (2015) “Feature extraction and LDA based classification of lung nodules in chest CT scan images2015 (ICACCI), DOI: 10.1109/ICACCI.2015.7275773 [8] Jin, X., Zhang, Y., & Jin, Q. (2016) “Pulmonary Nodule Detection Based on CT Images Using Convolution Neural Network.” 2016 9Th International Symposium On Computational Intelligence And Design (ISCID). DOI: 10.1109/ISCID.2016.1053. [9] Sangamithraa, P., & Govindaraju, S. (2016) “Lung tumour detection and classification using EKMean clustering.” 2016 International Conference On Wireless Communications, Signal Processing And Networking (Wispnet). DOI: 10.1109/WiSPNET.2016.7566533. [10] Roy, T., Sirohi, N., & Patle, A. (2015) “Classification of lung image and nodule detection using fuzzy inference system.” International Conference On Communication & Automation. DOI: 10.1109/CCAA.2015.7148560. [11] H.-y. Lee, \"Deep learning tutorial,\" Open Course, Online Available, 2020. Available at: Google Scholar. [12] https://www.researchgate.net/figure/General-architecture] X.-F. Cao, Y. Li, H.-N. Xin, H.-R. Zhang, M. Pai, and L. Gao,\"Application of artificial intelligence in digital chest radiography reading for pulmonary tuberculosis screening,\" Chronic Diseases and Translational Medicine, vol. 7, no. 1, pp. 35-40, 2021. doi: 10.1016/j.cdtm.2021.02.001 [13] H. Wang et al., \"Comparison of machine learning methods for classifying mediastinal lymph node metastasis of non-small cell lung cancer from 18 F-FDG PET/CT images,\" EJNMMI research, vol., no.1, pp. 1-11, 2017. doi: 10.1186/s13550-017-0260-9
Copyright
Copyright © 2024 D Narsimha Reddy , C Ganesh, K Shiva Abhigna, P Tharun Sai. This is an open access article distributed under the Creative Commons Attribution License, which permits unrestricted use, distribution, and reproduction in any medium, provided the original work is properly cited.

Download Paper
Paper Id : IJRASET59257
Publish Date : 2024-03-21
ISSN : 2321-9653
Publisher Name : IJRASET
DOI Link : Click Here
 Submit Paper Online

