Ijraset Journal For Research in Applied Science and Engineering Technology
- Home / Ijraset
- On This Page
- Abstract
- Introduction
- Conclusion
- References
- Copyright
Machine Learning for Improved Detection and Prevention of Credit Card Fraud
Authors: Ajay Singh Chauhan, Unmukh Datta
DOI Link: https://doi.org/10.22214/ijraset.2024.64246
Certificate: View Certificate
Abstract
Using machine learning to identify instances of credit card fraud is the primary goal of the research. In order to accomplish this, we will research and assess four distinct classification models: Decision Tree, Logistic Regression, K-Nearest Neighbours (KNN), and Support Vector Classifier (SVC). Included in the Kaggle dataset\'s \"Time,\" \"Amount,\" and \"Class\" sections are transaction data points that represent the likelihood of fraud. Disparities in class distribution are a big problem with this dataset, even though 99.83% of the data comes from legitimate transactions. Disparity like this has the potential to lead to biassed model training. We resolved the issue by implementing preprocessing techniques such as feature scaling and resampling. F1-Score, recall, accuracy, and precision are the measures that we use to assess the models. With scores ranging from 93% to 94%, the data demonstrate that all models are incredibly accurate. Having said that, Logistic Regression lacks precision. All things considered, Decision Tree, KNN, and SVC perform very well. The proposed model\'s accuracy peaked at 94%. As this study demonstrates, thorough evaluation criteria are necessary for finding the optimal model for fraud detection.
Introduction
I. INTRODUCTION
The rising sophistication of card fraudsters and the widespread use of credit cards have prompted the banking sector to prioritise research into methods for detecting such crimes. As the world economy shifts towards a cashless paradigm, banks and other financial institutions are scrambling to find ways to safeguard themselves from fraud, which is getting more sophisticated and widespread. Due to their reliance on rule-based procedures & human supervision, classic fraud detection systems are rendered useless by the ever-changing techniques adopted by fraudsters [1]–[5] More and more people are coming to the conclusion that ML can make fraud detection far more accurate and efficient.
Machine learning, a branch of AI, can sift through mountains of data, spot patterns, and make accurate predictions; all of which are useful weapons in the fight against fraud. By analysing past transaction data, machine learning algorithms can automatically adjust to new fraudulent behaviour patterns, in contrast to conventional systems that rely mostly on preset rules and human involvement. Systems that can immediately adapt and respond to emerging threats are crucial in the battle against credit card theft. One of the numerous benefits of using machine learning to detect credit card fraud is its capacity to manage complicated and enormous datasets.
It can be challenging to handle and understand the massive amounts of data produced by modern financial activity. Data mining algorithms can learn on this dataset to find correlations and patterns that weren't there before [6]–[10] Learning methodologies including supervised, unsupervised, and reinforcement learning have all made substantial contributions to this field, each with its own advantages and new discoveries. Supervised learning involves training a model using a labelled dataset that knows the truth or falsehood of previous transactions.
The model will learn from these examples and then make predictions about unanticipated transactions in the future. As an example, this approach frequently employs support vector machines, decision trees, and logistic regression. The absence of labels in unsupervised learning makes it possible to uncover patterns and outliers. Clustering and anomaly detection are among the many techniques we employ to unearth new kinds of fraud. In order to improve decision-making, the more sophisticated method of reinforcement learning uses a system of incentives and punishments. There are several sorts of fraud, and situations like these are constantly changing, therefore this method is ideal. In order to enhance its detection accuracy and overall strategy, an RL model can learn from its achievements and stumbles.
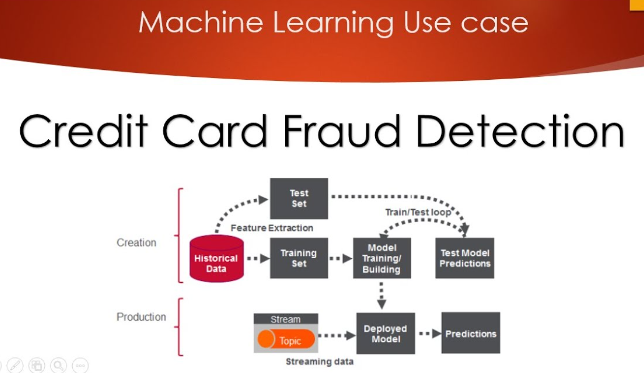
Fig 1 credit card fraud detection using machine learning
Using machine learning to detect fraud has many benefits, but it also comes with certain difficulties. The inherent bias in many fraud detection databases is a big issue. In the event that fraudulent transactions outnumber legitimate ones, issues with the training and performance of the model may occur. We can fix this imbalance and make the model more accurate by using techniques like resampling, anomaly detection, and creating synthetic data. When precision is paramount, like in fraud detection, questions about the interpretability of ML models arise. Understanding the reasoning behind models' findings is crucial for establishing trust and obtaining accurate answers from them. By making machine learning models more accessible and user-friendly, researchers are hoping to increase their auditability and validity. Furthermore, malicious actors may try to trick the machine learning system by taking advantage of its weaknesses; this is known as an adversarial attack. To stay up with these ever-changing risks and guarantee the robustness of fraud detection systems, it is essential to monitor and modify models continually. The battle against financial crime has finally made substantial headway, all because machine learning can detect credit card fraud. Using data and sophisticated algorithms, financial institutions may improve their fraud detection and prevention skills, safeguarding both their operations and consumers. Given the dynamic nature of technology, research and development must never come to a halt if we are to conquer the obstacles and make full use of machine learning in this vital domain. Combine human knowledge with AI to make our financial system more resistant to credit card theft.
II. LITERATURE REVIEW
Chen 2022 et.al Due to the ever-growing number of internet users, numerous businesses, including banks, have begun offering their services online. At the same time as this growth, financial fraud has been on the increase, causing huge value losses. Sophisticated techniques for detecting financial fraud are necessary to lessen the likelihood of threats like unforeseen assaults and unauthorised transactions.
Applying state-of-the-art data mining and ML techniques to similar problems has improved results. A number of issues persist, though, including the ever-present threat of new attack methods and the potential for enhanced processing speeds and big data analytics. An approach to fraud detection that relies on deep learning and uses deep convolutional neural networks (DCNNs) as its backbone aims to address these issues. Particularly when dealing with massive datasets, our approach aims to improve detection accuracy. Using a live dataset about credit card fraud, we compared the proposed model against pre-existing ML models, auto-encoders, and other deep learning techniques. This allowed us to validate the model. According to the research, the suggested model can reach a 99% detection rate in only 45 seconds [11].
Najadat 2022 et.al Thanks to lightning-fast technological developments, credit cards are quickly displacing cash as the primary mode of payment. But the shift has made it easier than ever for dishonest people to pull out fraudulent enterprises. The global value of card losses, according to Nilson's prediction, will exceed $35 billion by 2020. Customers have the right to anticipate that their credit card company would provide a service that will keep their purchases safe. Therefore, we demonstrate how to verify the legitimacy of a transaction using Kaggel's IEEE-CIS Fraud Detection dataset. To achieve the best possible pooling performance, we provide a model that combines the best features of two well-known models: Bidirectional long short-term memory (BiLSTM) and Bidirectional gated recurrent unit (BiGRU). Along with Naïve Base, Voting, Ada Boosting, Random Forest, Decision Tree, & Logistic Regression, we employed additional machine learning classifiers. When put side-by-side with machine learning classifiers, our model outperformed them by 91.37 percent [12].
Sadineni 2022 et.al The internet is an integral part of our digital lives; we rely on it constantly. The frequency of fraudulent transactions has been rising in tandem with the expansion of online marketplaces. Financial services are readily available due to the one million transactions processed per second using credit or debit cards. Criminals are taking advantage of people's trust in online shopping to steal money from honest people. Data imbalances, fraudster tactics, data accessibility, and the fast generation of massive amounts of data are some of the major challenges in identifying fraudulent credit card transactions. This highlights the need for reliable ways to identify fraudulent financial transactions. In this post, we will examine various machine learning algorithms that are capable of detecting questionable financial transactions. Random Forest, Decision Trees, SVM, Logistic Regression, and ANN are a few examples. False alarm rate, accuracy, and precision are some of the metrics used to assess the effectiveness of these strategies. Some datasets used in this study came from the Kaggle data pool. Both Decision Tree and Radom Forest obtained 98.47% and 99.21% accuracy, respectively, according to the results. those from logistic regression employing an artificial neural network (ANN) are 99.92% accurate, whereas those from a support vector machine (SVM) are 95.55% accurate [13].
Khatri 2022 et.al These days, no business can function without accepting credit cards. Clients can avoid lugging around a boatload of cash when they use these cards for large purchases. Thanks to these innovations, which have made cashless payments faster and easier, customers now have more payment flexibility. The digital payment system has its advantages and disadvantages. Credit card fraud has also increased in tandem with the popularity of these services. Theft might occur if unauthorised individuals obtained someone else's credit card information. With the help of specific Machine Learning Algorithms, it is feasible to collect data that can solve this problem. Examining and contrasting numerous popular supervised learning algorithms that can detect fraudulent financial transactions is the goal of this research [14].
Kumar 2022 et.al For data and insights beyond the most basic levels, data mining (DM) depends on an important algorithm. When looking for new information, data mining is an essential tool. It is possible for a single credit card (CC) issuer to send a customer multiple cards. It is imperative that all customers who pay with credit cards provide accurate information. If the recipient is irresponsible with the card, you could run into financial trouble. Due to the exponential growth of cashless transactions, it is very unlikely that fraudulent transactions will also increase. It may be possible to uncover cases of fraudulent purchase by reviewing credit card data across various behaviours. For a transaction to be considered fraudulent, there must be an unusual deviation from the available cost pattern. Experts in the field of credit card fraud detection and prevention (CCFD) depend heavily on DM and MLT. This overview essay will try to summarise the present status of the art in the rapidly emerging discipline of using DM and MLT to detect credit card fraud [15]
Table 1 Literature Summary
|
Auther/year |
Methodology |
Research gap |
Finding |
|
Warghade 2022 [16] |
With the goal of reducing the likelihood of false positives, this article examines a number of machine learning strategies for use with credit card datasets that are unbalanced. |
When it comes to credit card transaction datasets, there is a lack of study on how to improve fraud detection in the face of extreme imbalance.
|
Results show less misclassification of legitimate transactions and better fraud detection.
|
|
Rai 2022 [17] |
This approach evaluates Random Forest in comparison to Logistic Regression using Naïve Bayes classifiers. |
Improving fraud detection using methods other than LR and NB is an area where there is a lack of research.
|
When it comes to detecting fraud, Random Forest is better than statistical regression and Naïve Bayes. |
|
Lebichot 2022 [18] |
In order to adapt fraud detection across domains, the system makes use of deep transfer learning. |
A lack of studies focussing on how to enhance transfer learning for cross-domain heterogeneous fraud detection exists.
|
The results demonstrate that deep transfer learning approaches are effective in detecting fraud across domains. |
|
Sailusha 2022 [19] |
In order to find out which algorithm is better at detecting credit card fraud, the researchers compared Random Forest and Adaboost. |
There is a lack of study on how to improve algorithm performance for better identification of credit card fraud.
|
The precision, recall, F1-score, and accuracy of Random Forest were higher than those of Adaboost.
|
|
Azhan 2022 [20] |
The approach uses a number of Neural Networks and Machine Learning techniques to identify fraudulent activity. |
For all-encompassing fraud detection, there is a lack of research on how to integrate different machine learning algorithms. |
Artificial Neural Networks and Machine Learning are great at spotting possible con artists. |
III. METHODOLOGY
Part of the process involves using various models for classification, such as Decision Tree, K-Nearest Neighbours (KNN), Logistic Regression, and Support Vector Classifier (SVC). In order to evaluate the models' performance, the 'classification_report' gives a thorough summary of how well they detect fraudulent transactions. For each model, we determine its accuracy by comparing its predictions to the real test labels. Weighing the pros and cons of each model might help you determine the optimal algorithm for precise fraud detection.
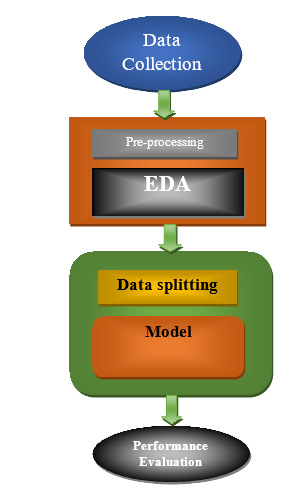
Fig. 2 Flow Chart
A. Data Collection
We began by collecting data from the widely-known open-source dataset hosting platform Kaggle. Each transaction record in the dataset has its own unique collection of features, such as time, the values of variables "V1" through "V28," the total amount, and a target variable called "Class." The 'Time' column shows the duration since the first transaction, whereas hidden characteristics 'V1' through 'V28' document the details of business deal. You can see how much money changed hands in the 'Amount' column, and you can see if the transaction was fraudulent or not in the 'Class' column. According to the numbers, there's a huge gap in the distribution of classes, with the majority of transactions being genuine. Due to this disparity, preprocessing techniques are required, which in turn increases the complexity of model training. Bringing the 'Amount' column into uniformity can boost the model's efficiency. The goal of the data collection strategy is to remedy these issues by offering a solid foundation upon which to build analyses and models.
B. Data Preprocessing
There were a number of important considerations made during preprocessing to prepare the dataset for analysis and model training. The typical amount of a transaction is around USD 88, which is significant for gauging trends and making sure the model is accurate. The absence of missing or "Null" values in the dataset eliminates the need for data imputation, simplifying the preprocessing step. A big problem is the discrepancy between the classes; 99.83% of the data comes from legitimate transactions, while only 0.17% comes from fraudulent ones. It is currently difficult to train models due to the disparity, which may result in biassed predictions. Two potential methods to tackle this issue are cost-sensitive learning and resampling. Variables 'V1' through 'V28' had their dimensionality reduced using Principal Component Analysis (PCA). However, because they were not transformed, the 'Time' and 'Amount' variables require independent handling. To get the most out of principal component analysis (PCA), you should first scale the 'V' characteristics.
C. EDA
Equilibrium in class distributions is crucial to the validity of models in EDA. In order to remove training biases, it is best to use identical class distributions. This gives a fair view of each category. Positive class correlation shows associations when two or more classes tend to coexist, which influences the model's predictions. Another way to find patterns and relationships in high-dimensional data is to cluster it using dimensionality reduction techniques like t-SNE or principle component analysis (PCA). Thanks to its comprehensive analysis of clusters, correlations, and class distributions, EDA is an essential tool for building accurate and dependable prediction models.
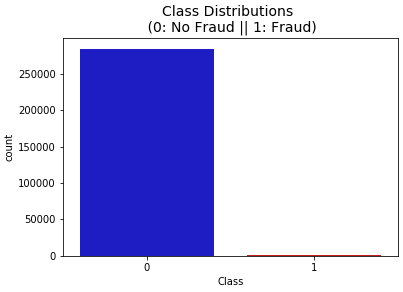
Fig. 3 Class Distributions
Fig.3 Class In distributions, we can see how the dataset's classes breakdown. In doing so, it graphically depicts the relative sizes of the various classes and draws attention to any inequality, such as the preponderance of any one. In order to comprehend the prevalence of classes and to guide suitable model training tactics, this distribution is vital.
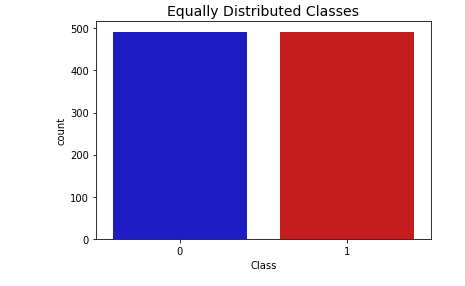
Fig. 4 Equally Distributed Classes
Fig.4 Equally Each class in the dataset has an equal number of instances, displaying a balanced distribution of classes in Distributed Classes. With this image, we can be sure that no class is skewed in one direction or the other, which helps with training and evaluating models without bias.

Fig. 5 Class Negative Correlation
Fig.5 Class When classes are less frequently seen together, we see this as negative correlation. By illustrating the possible relationships between classes and their absence, this visualisation sheds light on class interactions and the difficulties that may arise during categorisation tasks.
 Fig 6 Class Positive Correlation
Fig.6 Class When we look at the positive correlation, we can see that some classes do seem to occur together more often. By showing how class co-occurrence affects predictions and classification accuracy, this visualisation draws attention to patterns or relationships between classes, which can impact model performance.

Fig. 7 Clusters using Dimensionality Reduction
Fig.7Clusters Using dimensionality reduction methods, such principal component analysis (PCA) or t-SNE, displays data clusters. By displaying the data in a condensed feature space, this visualisation aids in the discovery of hidden correlations and patterns in the dataset that might otherwise go unnoticed in higher dimensional views.
D. Data splitting
Data splitting enables a more accurate assessment of the model's performance by dividing the dataset into a training set and a testing set. First, we look at the distribution of classes and see that non-fraudulent transactions account for 99.83% of the dataset, while fraudulent ones account for only 0.17%. When you assess and adjust the model, remember to factor in this imbalance. To ensure that our training and testing sets are representative, we tackle the problem of class imbalance using the 'Stratified KFold' technique from the'sklearn.model _selection' package. This method divides the dataset into five parts so that the percentage of samples from each class in the training and test sets remains consistent. Stratified KFold asserts that each dataset fold faithfully reflects the total distribution of classes. Important because of the extremely skewed nature of the dataset. The steps involved in splitting are as follows: Put the characteristics set (X) apart from the target variable (y) first. Cutting the dataset in half lengthwise is the next step after applying the 'StratifiedKFold' algorithm. A testing set and a training set will be born out of that process. At the very top, you can see the training and testing indices for all the folds. Dividing the dataset into four parts, labelled as "original Xtrain," "original Xtest," "original _ytrain," and "original ytest," is the next stage. Using this method, you can see how effectively your models generalise and whether they perform well on various types of data.
E. Modelling
1) Logistic Regression
When assessing the Logistic Regression model, we employ the 'classification_report' function. Accuracy, recall, and F1-score are some of the key metrics included in this report that shed light on the ability of the model to distinguish between legitimate and fraudulent transactions. One variable that stores the projected outcomes of the Logistic Regression model is 'y_pred_log_reg
2) K-Nearest Neighbors (KNN)
The 'classification report' uses the same method to assess the efficacy of the K-Nearest Neighbours (KNN) model. This study demonstrates the KNN model's ability to differentiate between legitimate and fraudulent transactions using the predictions stored in the 'y _pred _knear' variable. We utilise criteria such as recall, accuracy, and F1-score to evaluate the model's performance.
3) Support Vector Classifier (SVC)
The "classification report" gives a detailed analysis of the model's expected accuracy and is useful for evaluating the Support Vector Classifier's (SVC) performance. The 'y_pred_svc' variable stores the SVC model's output. The report uses F1-score, recall, and precision to evaluate the model's performance on both classes.
4) Decision Tree
Despite the fact that the title is "Support Vector Classifier" twice, we still assess the Decision Tree model. The Decision Tree model's "classification report" function provides a thorough overview of the classification metrics. You can find the predictions—including the F1-score, recall, and precision—in the 'y_pred_tree' variable. In this context, the Decision Tree model's performance in identifying the transactions' types becomes clearer.
IV. RESULT & DISCUSSION
Results show strong performance on the F1-Score, recall, accuracy, and precision measures. The Logistic Regression model outperformed the others in terms of accuracy, but at the expense of a little precision. A number of models, including the decision tree, the k-nearest neighbour, and the support vector classifier, shown exceptional accuracy and recall. Due to their high recall and precision scores, Support Vector Classifier and Decision Tree seem to be adept at detecting intricate patterns. Having high F1-Scores everywhere indicates that the models did a good job of balancing recall and precision. If a model regularly produces good results, it is a good fit for the classification task. Model selection, however, may differ according to specific requirements like understanding or computational efficiency.
A. Accuracy
We may learn how accurate the model is by comparing the number of examples with and without a valid classification. It essentially reveals the model's performance in each category.
Accuracy=(TP+TN)(TP+FP+TN+FN) (1)
B. Precision
The precision of a model is directly related to how well it can forecast future events. One way to determine accuracy is by comparing the projected positives to the actual positives ratio. When the number of false positives is low, it indicates that the model is effective at producing reliable predictions.
Precision=TPTP+FP (2)
C. Recall
You can evaluate a model's sensitivity and recall by testing its ability to recognise each and every instance of a given class. A model's accuracy rate can be defined as the proportion of true positives it correctly identifies. A medical diagnostics model with a high recall is necessary to detect all positive cases in order to avoid the disastrous consequences of false negatives.
Recall=TPTP+FN (3)
D. F1-Score
The F1 score is a crucial metric to think about while assessing classifiers. It integrates accuracy with memory to give a thorough assessment of performance. In contrast to accuracy, which may provide an inaccurate picture when working with datasets that contain imbalanced classes, the F1 score provides a balanced assessment by taking both false positives and false negatives into account. When there is a significant disparity in the distribution of classes, as is frequently the case in healthcare and cybersecurity, accurate classification becomes very important. The sum of a classifier's recall and precision is a comprehensive metric for its effectiveness.
F1-score=21precision+1recall (4)
Table 2- Performance Comparison table
|
Model Type |
Accuracy |
Precision |
Recall |
F1-Score |
|
Logistic Regression |
94 |
100 |
100 |
93 |
|
KNears Neighbors |
93 |
94 |
99 |
93 |
|
Support Vector Classifier |
93 |
99 |
99 |
93 |
|
Decision Tree |
93 |
99 |
99 |
93 |
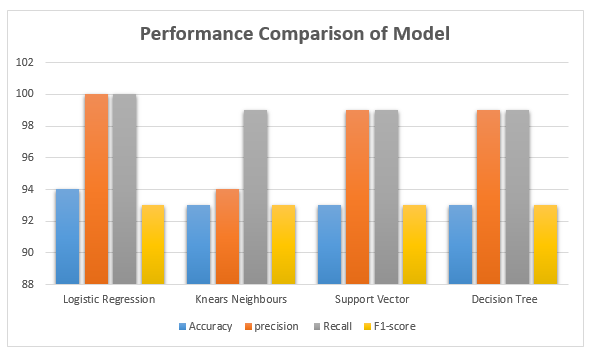
Fig. 8 Performance Comparison of model
A model evaluation table displays the metrics for four classifiers: k-Nearest Neighbours, Decision Tree, Logistic Regression, and Support Vector Classifier. Each model does an excellent job, with an accuracy rate ranging from 93% to 94%.Logistic Regression's accuracy is marginally worse compared to other models. The three most common methods for determining F1-Score, recall, and accuracy are decision trees, support vector classifiers, and k-nearest neighbours.
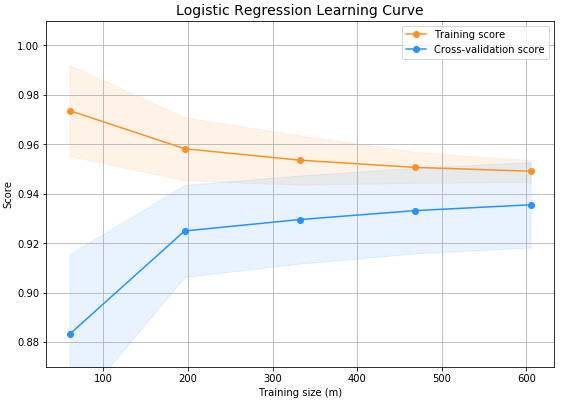
Fig. 9 Logistic Regression Learning Curve
Fig.9: Logistic Looking at the Regression Learning Curve, one may observe the model's performance during training. By plotting the gain or loss in accuracy between training and validation, this curve shows how the model learns. Important insights, like trends in convergence and potential overfitting or underfitting, are critical for optimising and fine-tuning the logistic regression model.
.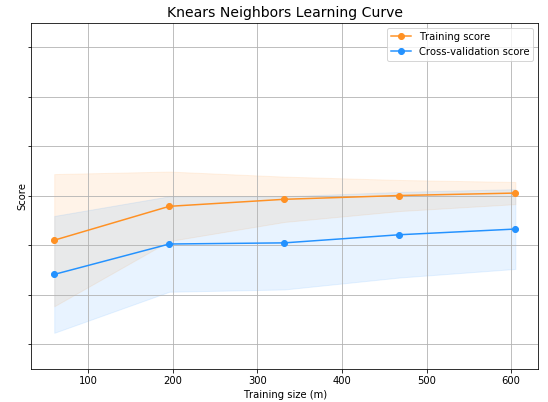
Fig. 10 Knears Neighbors learning curve
Fig.10 You can see the model's performance as a function of training size and epochs on the k-Nearest Neighbours Learning Curve. In order to assess the model's ability to generalise and avoid overfitting, it highlights patterns such as stabilisation and volatility in the performance of the k-Nearest Neighbours algorithm as the data set expands.
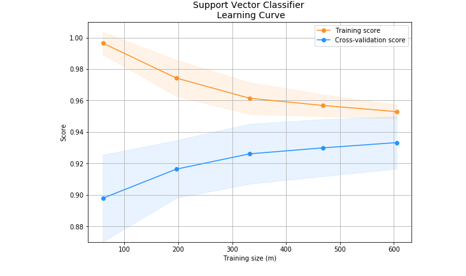
Fig. 11 Support Vector Classifiers
Fig. Eleven, Back Recurrent Neural Associations The Learning Curve is an effective graphical tool for seeing how a Support Vector Classifier performs across different data sizes or training rounds. It visually shows the change in loss or accuracy to show how well the model finds the optimal classification hyperplane. Convergence patterns and the effectiveness of generalisation are two notable results.
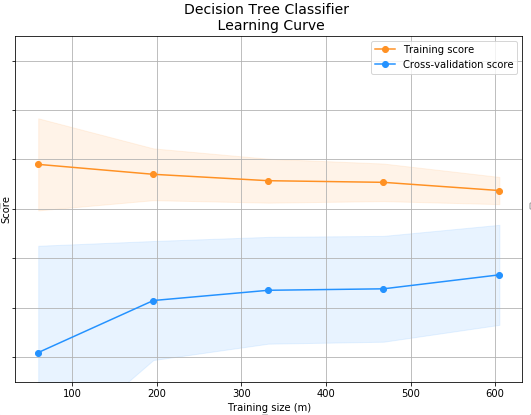
Fig. 12 Decision Tree Classifires
Fig.12 You can see how the model's accuracy and loss change with training time and data size on the Decision Tree Classifiers Learning Curve. The results demonstrate the Decision Tree Classifier's generalisability and patterns of overfitting or underfitting caused by its split and depth changes.
|
models |
Accuracy |
References |
|
SVM |
93.6 |
[21] |
|
Logistic Regression |
90 |
[22] |
|
Proposed work |
94 |
------- |
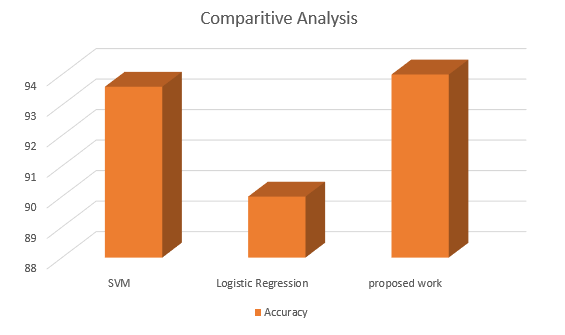
Fig. 13 Comparative Analysis
Table 1 shows the accuracy of three models used to detect credit card fraud. There was a 93.6% success rate for the Support Vector Machine (SVM), and a 90% success rate for Logistic Regression. When compared to the other two models, the suggested one performed better due to its extremely high accuracy rate of 94%.
Conclusion
TIn order to determine which classification model is the most effective in spotting fraudulent transactions, this research compares Decision Tree, Logistic Regression, K-Nearest Neighbours (KNN), and Support Vector Classifier. In order to determine how well the models performed, the \"classification report\" feature compares the models\' predictions to the real test labels. In order to choose the optimal algorithm for fraud detection, it is vital to undergo this study, which gives a thorough comprehension of the pros and cons of each model. Scores ranging from 93% to 94% show that all models are very accurate. But Logistic Regression\'s accuracy is marginally worse than the other models. The accuracy, recall, and F1-Score of the three models (Decision Tree, K-Nearest Neighbours, and Support Vector Classifier) are all quite good. The language varies in its focus on the models\' accuracy. In comparison to Logistic Regression\'s 90% accuracy, Support Vector Machine (SVM) reached 93.6%. The suggested model\'s success rate in identifying fraudulent transactions was 94%, significantly higher than the other models. In order to choose the best model for fraud detection, these results highlight the importance of employing many metrics, such as accuracy, precision, recall, and F1-Score. Enhanced fraud protection mechanisms and better prediction capabilities are the end results of this.
References
[1] N. K. Trivedi, S. Simaiya, U. K. Lilhore, and S. K. Sharma, “An efficient credit card fraud detection model based on machine learning methods,” Int. J. Adv. Sci. Technol., vol. 29, no. 5, pp. 3414–3424, 2020. [2] M. M. Mijwil and I. E. Salem, “Credit Card Fraud Detection in Payment Using Machine Learning Classifiers,” Asian J. Comput. Inf. Syst., vol. 8, no. 4, pp. 50–55, 2020, doi: 10.24203/ajcis.v8i4.6449. [3] A. Husejinovi?, “Credit card fraud detection using naive Bayesian and c4.5 decision tree classifiers,” Period. Eng. Nat. Sci., vol. 8, no. 1, pp. 1–5, 2020. [4] S. Bagga, A. Goyal, N. Gupta, and A. Goyal, “Credit Card Fraud Detection using Pipeling and Ensemble Learning,” Procedia Comput. Sci., vol. 173, no. 2019, pp. 104–112, 2020, doi: 10.1016/j.procs.2020.06.014. [5] M. A. Al-Shabi, “Credit Card Fraud Detection Using Autoencoder Model in Unbalanced Datasets,” J. Adv. Math. Comput. Sci., vol. 33, no. 5, pp. 1–16, 2019, doi: 10.9734/jamcs/2019/v33i530192. [6] S. Mittal and S. Tyagi, “Performance evaluation of machine learning algorithms for credit card fraud detection,” Proc. 9th Int. Conf. Cloud Comput. Data Sci. Eng. Conflu. 2019, no. January 2019, pp. 320–324, 2019, doi: 10.1109/CONFLUENCE.2019.8776925. [7] J. Gao, Z. Zhou, J. Ai, B. Xia, and S. Coggeshall, Predicting Credit Card Transaction Fraud Using Machine Learning Algorithms, vol. 11, no. 03. 2019. doi: 10.4236/jilsa.2019.113003. [8] U. Fiore, A. De Santis, F. Perla, P. Zanetti, and F. Palmieri, “Using generative adversarial networks for improving classification effectiveness in credit card fraud detection,” Inf. Sci. (Ny)., vol. 479, pp. 448–455, 2019, doi: 10.1016/j.ins.2017.12.030. [9] M. U. Safa and R. M. Ganga, “M. U. Safa, ‘Credit Card Fraud Detection Using Machine Learning,’ in International Journal of Research in Engineering, Science and Management, IJRESM, Nov. 2019, p. 3.,” no. 11, pp. 2–4, 2019. [10] D. Varmedja, M. Karanovic, S. Sladojevic, M. Arsenovic, and A. Anderla, “Credit Card Fraud Detection - Machine Learning methods,” 2019 18th Int. Symp. INFOTEH-JAHORINA, INFOTEH 2019 - Proc., no. October, pp. 1–5, 2019, doi: 10.1109/INFOTEH.2019.8717766. [11] J. I.-Z. Chen and K.-L. Lai, “Deep Convolution Neural Network Model for Credit-Card Fraud Detection and Alert,” J. Artif. Intell. Capsul. Networks, vol. 3, no. 2, pp. 101–112, 2021, doi: 10.36548/jaicn.2021.2.003. [12] H. Najadat, O. Altiti, A. A. Aqouleh, and M. Younes, “Credit Card Fraud Detection Based on Machine and Deep Learning,” 2020 11th Int. Conf. Inf. Commun. Syst. ICICS 2020, no. Section IX, pp. 204–208, 2020, doi: 10.1109/ICICS49469.2020.239524. [13] P. K. Sadineni, “Detection of fraudulent transactions in credit card using machine learning Algorithms,” Proc. 4th Int. Conf. IoT Soc. Mobile, Anal. Cloud, ISMAC 2020, no. December, pp. 659–660, 2020, doi: 10.1109/I-SMAC49090.2020.9243545. [14] S. Khatri, A. Arora, and A. P. Agrawal, “Card Fraud Detection?: A Comparison,” 2020 10th Int. Conf. Cloud Comput. Data Sci. Eng., pp. 680–683, 2020. [15] A. Kumar Manjhvar and R. Goyal, “Review on Credit Card Fraud Detection using Data Mining Classification Techniques & Machine Learning Algorithms,” IJRAR (International J. Res. Anal. Rev., vol. 7, no. 1, pp. 972–975, 2020. [16] S. Warghade, S. Desai, and V. Patil, “Credit Card Fraud Detection from Imbalanced Dataset Using Machine Learning Algorithm,” Int. J. Comput. Trends Technol., vol. 68, no. 3, pp. 22–28, 2020, doi: 10.14445/22312803/ijctt-v68i3p105. [17] A. K. Rai and R. K. Dwivedi, “Fraud Detection in Credit Card Data Using Machine Learning Techniques,” Commun. Comput. Inf. Sci., vol. 1241 CCIS, no. February 2021, pp. 369–382, 2020, doi: 10.1007/978-981-15-6318-8_31. [18] B. Lebichot, Y.-A. Le Borgne, L. He-Guelton, F. Oblé, and G. Bontempi, “Deep-Learning Domain Adaptation Techniques for Credit Cards Fraud Detection,” pp. 78–88, 2020, doi: 10.1007/978-3-030-16841-4_8. [19] R. Sailusha, V. Gnaneswar, R. Ramesh, and G. Ramakoteswara Rao, “Credit Card Fraud Detection Using Machine Learning,” Proc. Int. Conf. Intell. Comput. Control Syst. ICICCS 2020, vol. 68, no. 3, pp. 1264–1270, 2020, doi: 10.1109/ICICCS48265.2020.9121114. [20] M. Azhan and S. Meraj, “Credit card fraud detection using machine learning and deep learning techniques,” Proc. 3rd Int. Conf. Intell. Sustain. Syst. ICISS 2020, no. December 2020, pp. 514–518, 2020, doi: 10.1109/ICISS49785.2020.9316002. [21] O. S. Adebayo, T. A. Favour-Bethy, O. Otasowie, and O. A. Okunola, “Comparative Review of Credit Card Fraud Detection using Machine Learning and Concept Drift Techniques,” Int. J. Comput. Sci. Mob. Comput., vol. 12, no. 7, pp. 24–48, 2023, doi: 10.47760/ijcsmc.2023.v12i07.004. [22] S. Singh and A. Maheshwari, “Credit Card Fraud Detection,” Proc. - 2022 4th Int. Conf. Adv. Comput. Commun. Control Networking, ICAC3N 2022, no. April, pp. 209–213, 2022, doi: 10.1109/ICAC3N56670.2022.10074052.
Copyright
Copyright © 2024 Ajay Singh Chauhan, Unmukh Datta. This is an open access article distributed under the Creative Commons Attribution License, which permits unrestricted use, distribution, and reproduction in any medium, provided the original work is properly cited.

Download Paper
Paper Id : IJRASET64246
Publish Date : 2024-09-15
ISSN : 2321-9653
Publisher Name : IJRASET
DOI Link : Click Here
 Submit Paper Online

