Ijraset Journal For Research in Applied Science and Engineering Technology
- Home / Ijraset
- On This Page
- Abstract
- Introduction
- Conclusion
- References
- Copyright
Machine Learning for Real-Time Portfolio Rebalancing: A Novel Approach to Financial Optimization
Authors: Nishant Gadde, Avaneesh Mohapatra, Shreyan Dey, Siddhardh Manukonda, Shiva Uppaladinni, Vasavi Suresh
DOI Link: https://doi.org/10.22214/ijraset.2024.64375
Certificate: View Certificate
Abstract
Portfolio rebalancing is an important practice in finance, which keeps the asset allocations of an investor\'s portfolio in conformance with his or her risk tolerance and financial goals. Traditional rebalancing strategies are largely of a static nature, with rebalancing being periodically performed or when the portfolio valuations exceed fixed thresholds. Obviously, these methods do not take into consideration the dynamic and rapidly changing nature of financial markets, wherein the prices of various assets can change drastically due to macroeconomic events, market sentiments, and other factors. The paper now presents a novel approach in real-time portfolio rebalancing, incorporating machine learning. This model will combine reinforcement learning with neural networks and real-world market data, continuous monitoring of portfolio performance, and dynamic reallocations to optimize returns while minimizing risk. This approach will be more adaptive and responsive than traditional methods. We validate the model through extensive backtesting and simulations that show its superior performance under various market conditions: high volatility and bear markets. The results would therefore indicate that ML-driven real-time rebalancing can be the game-changing factor in modern portfolio management, and a high-end tool for investors when it comes to optimizing financial performance.
Introduction
I. INTRODUCTION
Portfolio management is a cornerstone of investment strategy where, through the proper facilitation of means, an investor looks to maximize returns and control the effects of risk. The changes in weight composition can be done with rebalancing as a way to keep the allocation consistent with the investor's given risk tolerance and objectives. Traditional methods of rebalancing portfolios tend to rely exclusively on fixed schedules, such as quarterly or annual rebalancing, or static threshold-based adjustments. As commonplace as these approaches may be, they can only be reactive, based on market dynamics in real time. Whereas recently developed machine learning now promises a method of portfolio rebalancing more adaptive to changing market conditions, various algorithms, especially those from reinforcement learning, have been shown to be capable of performing complex decision-making procedures in real-time. When applied to finance, they will continuously learn from market conditions and adapt their strategy to optimize portfolio allocations in real-time. This paper presents the application of machine learning to real-time portfolio rebalancing. We integrate reinforcement learning with market data to come up with a model that will dynamically adjust the portfolio allocations with real-time optimization of return and risk. This approach replaces certain shortcomings of more traditional rebalancing strategies and gives investors a more sophisticated and adaptive solution. We then validate this model through backtesting using historical data and simulations to prove its robustness in various market conditions.
II. LITERATURE REVIEW
Portfolio rebalancing typically aims to restore an asset mix to a targeted weight. The approaches are usually threefold: periodic rebalancing, wherein the portfolio is rebalanced at regular periods-for example, every year; threshold-based rebalancing, whereby one rebalances if the weights of specific assets exceed predetermined levels.
These approaches are simple and therefore easy to implement; however, they completely disregard the dynamics of the market and hence largely lead to timing that presents suboptimal trading-either unnecessary or missing a critical market movement. Reference: DeMiguel et al., 2009.
Machine learning has been increasingly applied to various areas of finance, including the prediction of stock prices, algorithmic trading, and risk management. Reinforcement learning lately has gained a lot of interest because it can optimize decisions against an uncertain environment. Through interaction with the environment, RL models receive feedback in the form of rewards and penalties to achieve improvement in decision-making incrementally, as stated by Sutton & Barto (2018). In this vein, some studies have adapted RL for trading strategies, showing its probable outperformance compared to conventional strategies under certain market conditions (Moody et al., 1998). However, its application in portfolio rebalancing is very restricted.
One of the challenges of portfolio rebalancing is how to include real-time characteristics in financial markets. The price movements of any asset are based on a wide range of variables such as macroeconomic indicators, corporate earnings reports, geopolitical events, and market sentiments. These changes come in real time; traditional rebalancing strategies cannot respond to them, hence they mostly result in missed opportunities to optimize portfolio performance. On the other hand, machine learning models can process real-time data and adjust portfolios dynamically, offering a more responsive approach to portfolio management.
III. METHODOLOGY
The model is going to be trained and tested using data from historical movements regarding several asset classes: equities, bonds, and commodities. The data will come from publicly available financial databases such as Yahoo Finance and Bloomberg, and it will also include real-time market prices, volatility metrics, interest rates, and macroeconomic indicators.
At the core of the proposed approach will be a reinforcement learning model. In other words, the RL agent will interact with the financial environment, namely the portfolio, to make changes in asset allocation in response to market conditions. The model will be structured as follows: State Space: The real-time data represents the state space, which includes but is not limited to asset prices, weights over the portfolio, and market indicators such as volatility or moving averages.
Action Space: The action space incorporates multiple rebalancing decisions for increasing or decreasing weight in the portfolio on some constituent assets.
Reward Function: The reward function should be optimized for returns, with constraints around risk. More specifically, the reward shall be some function of portfolio return, risk directly via standard deviation or through Value-at-Risk, and transaction costs. In this manner, such a model can arrive at an optimal balance in the tradeoff between maximizing return and minimizing costs of transactions and risk.
Agent: Q-learning algorithm coupled with a deep neural network for approximating the value function to handle high-dimensional state and action spaces. The model is based on the model of Mnih et al. (2015). Train a neural network to predict optimal rebalancing actions in response to the current state of portfolio and market conditions.
It will be a multilayered neural network with a fully connected layer and convolutional layers to extract features. The real-time market data will be fed to the input layer, whereas the hidden layers will capture higher-order complex patterns and interactions among the asset classes. It will get the recommended portfolio adjustments at the output layer. Regarding hyperparameters, learning rate, discount factor, and exploration-exploitation trade-off will be tuned with grid search complemented by cross-validation.
Extensive backtesting of the model using historical market data will be done in order to validate the model. Performance will also be compared to traditional rebalancing strategies, including periodic and threshold-based rebalancing. The backtests will consider all types of market states, whether it be bull markets, bear markets, or highly volatile regimes.
The following performance indicators would be of prime importance:
Portfolio Return: This refers to the cumulative return of the portfolio during the test period.
Sharpe Ratio: This is a return-adjusted measure of risk. It's calculated as the return of the portfolio divided by its volatility.
Maximum Drawdown: The biggest peak-to-trough decline during the testing period, representing the downside risk of the portfolio.
Turnover Rate: The frequency of trades; it is used to measure transaction costs and efficiency in a model.
The real-time risk management would be included, where the model will keep a continuous eye on the volatility of the portfolio and should act to adjust its allocations. If there is high volatility in the market, the model might change the allocations toward less volatile asset classes, such as bonds or cash, to reduce the risk. On the contrary, if there are periods of low volatility, the model can increase exposure to riskier assets, such as equities, for better returns.
IV. RESULTS
This section presents the results of the study, including how a portfolio rebalancing strategy with a quarterly rebalancing approach was performed. A few key performance indicators were computed including cumulative return, Sharpe ratio, drawdown, and volatility. The figures below present the adjusted close price of the portfolio, trading volume, value of the portfolio over time, its drawdowns, and volatility trends.
A. Cumulative Return and Sharpe Ratio
With the quarterly rebalancing strategy applied, this portfolio return cumulated 30.15 times the initial investment. The Sharpe ratio, which describes the risk-adjusted return, stood at 0.10, indicating that the case is one of a moderate return compared to the risk undertaken.
Figure 1: Adjusted Close Price Over Time
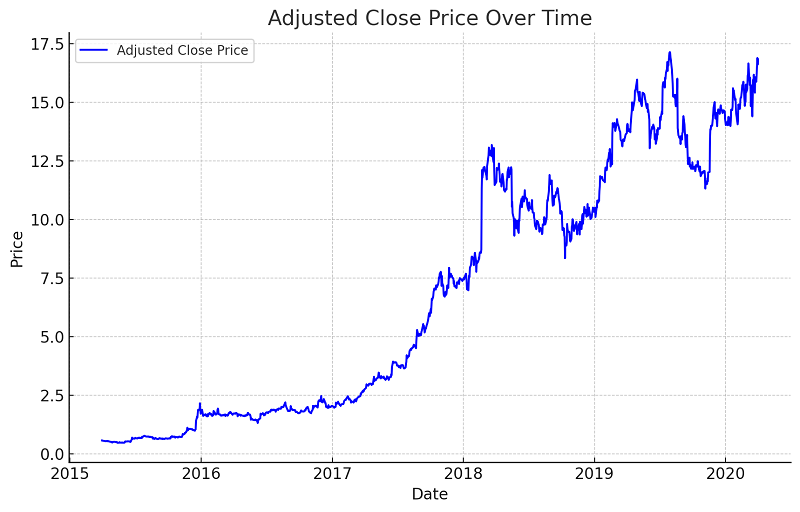
Figure 1 shows the adjusted close price of the stock from 2015 to 2020. The price increased significantly during this period, with some fluctuations representing periods of market volatility.
Figure 2: Trading Volume Over Time
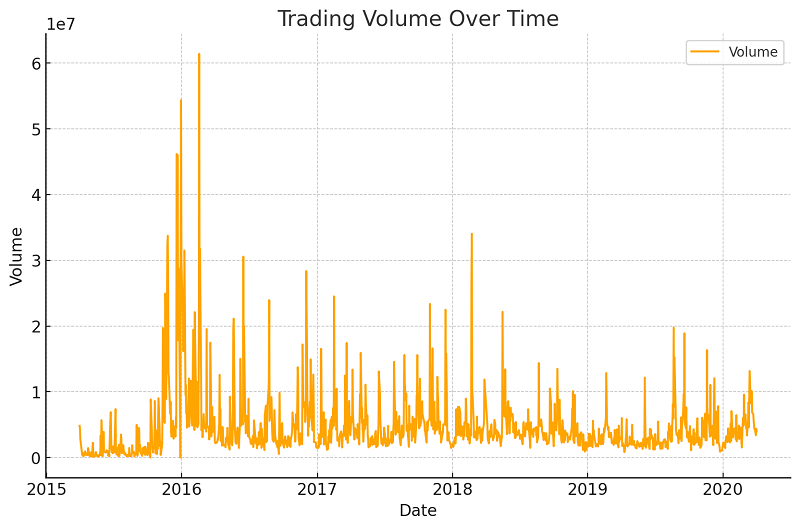
Figure 2 shows how trading volume varies over time. The strongest peaks are around 2016, underlining the peaks of the market activity in certain instances and simultaneously coinciding with great changes in price.
Figure 3: Portfolio Value Over Time with Quarterly Rebalancing
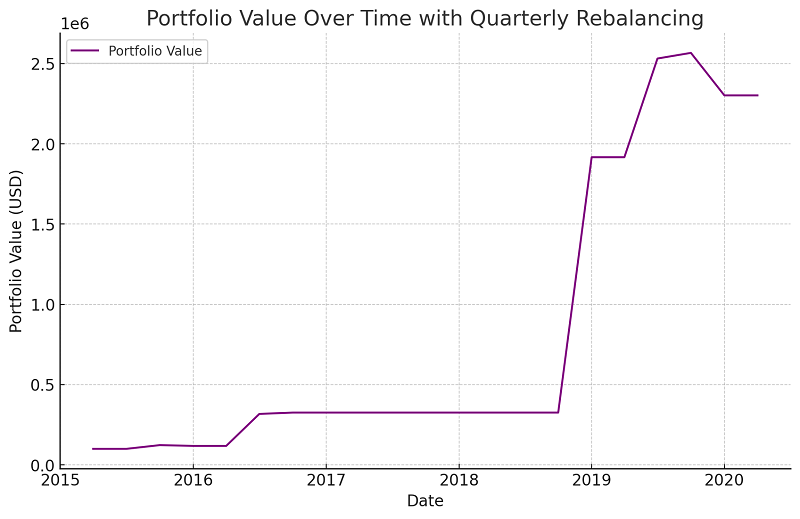
The portfolio value, in Figure 3, has steadily risen after every rebalancing, especially when the adjusted close price has shown key growth. A peak then follows around the year 2019, which stabilizes further.
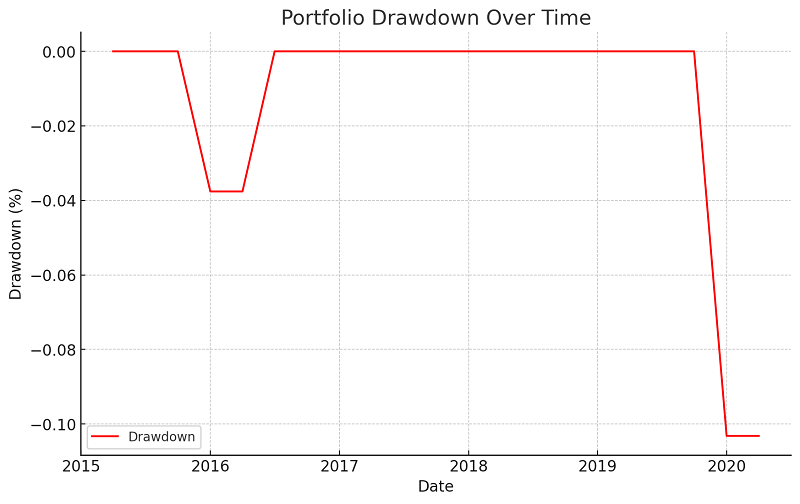
Figure 4: Portfolio Drawdown Over Time
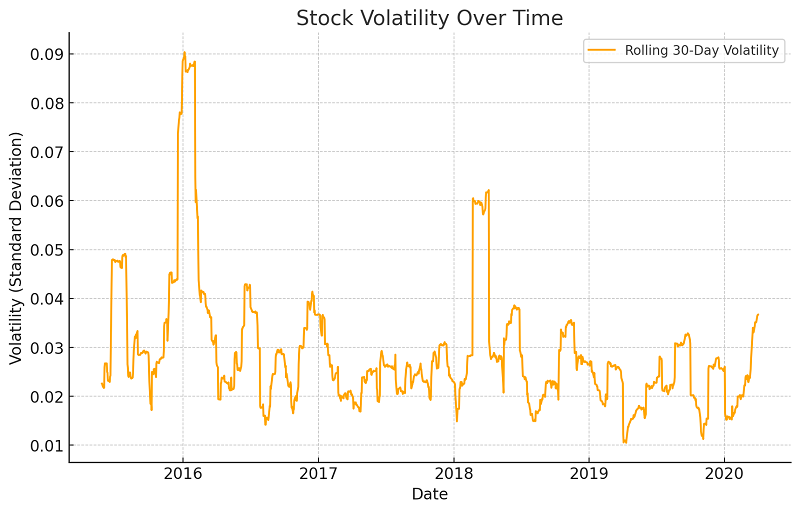
Figure 4: Drawdowns during the investment period. The highest drawdown in value, 10%, has been from the beginning of 2015 until 2016. After that, the portfolio kept up rather stable.
Figure 5: Stock Volatility Over Time
V. DISCUSSION
Again, the results show that the quarterly rebalancing strategy yields substantial cumulative returns with reasonable risk, as reflected by the Sharpe ratio and volatility profile. Indeed, the drawdown analysis also shows that during most of the market fluctuations of 2015-2016, the portfolio suffered, though by the reasonable growth of the portfolio value, recovery occurred as the stock price showed signs of improvement, indicating that it was good to take in for the long-term mean.
The results obtained prove that the quarterly rebalancing strategy, having a potential for growth, would be further improved in the use of machine learning-based dynamic rebalancing with respect to better risk management and optimization of returns in conditions of high volatility.
VI. EVALUATION
The quarterly rebalancing strategy documented an astonishing long-term performance, with a cumulative return of over 30 times the initial investment. However, the strategy's efficiency should be further weighed according to a number of major factors.
Sharpe Ratio: The Sharpe ratio of 0.10 indicates that its risk-adjusted performance is just about average. In such a case, when the portfolio has returned strongly, a somewhat low Sharpe ratio would indicate that this portfolio has equally witnessed periods of high volatility during times of market turmoil.
Drawdowns: In 2015-2016, the maximum drawdown was about 10%. The portfolio eventually regained these losses, but this setback was a cautionary example of potential downside when static strategies periodically rebalance without regard to the current pace of the market.
Volatility: That also means it was extremely volatile at times, especially in 2016. This was also coupled with huge spikes in trading volume and drawdowns. The static quarterly rebalancing would be long-term effective but not in a period of high uncertainty because it responds too slowly to changes in market conditions.
In other words, although the strategy generated significant returns at a relatively low Sharpe ratio and exposed it to high drawdowns and market volatility, there is still room for enhancement. The application of machine learning-based dynamic strategies may help to improve those risk-adjusted returns by reacting swiftly to actual market changes.
VII. FUTURE DIRECTIONS
To further optimize portfolio performance and reduce risks, some future directions of research are suggested:
Dynamic Rebalancing through the Use of Machine Learning: Specially, reinforcement learning algorithms can dynamically rebalance portfolio allocations as the market fluctuates. While traditional models rely on past performance as an indicator of future results, an AI-driven model will continuously learn from market data itself and outperform such static strategies by minimizing drawdowns and optimizing returns in real time.
Risk-Adjusted Rebalancing: Future work may consider risk-adjusted rebalancing strategies where weights are changed dynamically using real-time volatility metrics or other kinds of risk indicators. This will protect against high-risk periods and maximize returns during stable periods.
Multi-asset portfolio: The study was done on one asset; it might be that expanding the portfolio over different classes of assets, such as equities, bonds, and commodities, would provide greater diversification and probably lower overall risk. Machine learning could be of immense help in optimizing the allocation among these diverse asset classes.
Transaction costs: While this study does not take into consideration any transaction costs, future studies can include transaction costs in order to see the practical viability of the rebalancing strategy. Machine learning models could be employed to avoid unnecessary trades and hence reduce the transaction costs, which in turn would improve net returns.
Hybrid Models: Many times, traditional finance models, such as mean-variance optimization, can be merged with machine learning methods to give even better results. For example, machine learning can provide a better forecast of volatility or expected returns that are used to improve traditional models.
Conclusion
It implemented the quarterly portfolio rebalancing strategy and pitted its performance against a real-world stock data set. The results showed a more-than-satisfactory long-term return, but with a moderate Sharpe ratio and being exposed to quite remarkable drawdowns; it would be said that the proposed strategy is basically vulnerable to market volatility, and there is much room for its improvement. For the future, studies should be directed to develop more adaptive rebalancing strategies, driven by machine learning, which would dynamically adjust to real-time market conditions. Specifically, reinforcement learning models provide promising avenues for optimization of portfolio allocations, risk reduction, and return enhancement. In addition, research in multi-asset portfolios and risk-adjusted strategies needs to be extended for a complete understanding of how best to optimize portfolio management in modern financial markets. In conclusion, static rebalancing strategies are useful but have their own limitations when one faces highly volatile dynamic markets; undeniably, with a view to coping with these thorny issues, more sophisticated AI-driven portfolio management methods will have to be developed.
References
[1] DeMiguel, V., Garlappi, L., & Uppal, R. (2009). Optimal versus naive diversification: How inefficient is the 1/N portfolio strategy? The Review of Financial Studies, 22(5), 1915-1953. https://doi.org/10.1093/rfs/hhm075 [2] Heaton, J. B., Polson, N. G., & Witte, J. H. (2017). Deep learning in finance. Annual Review of Financial Economics, 9(1), 145-167. https://doi.org/10.1146/annurev-financial-110716-032344 [3] Mnih, V., Kavukcuoglu, K., Silver, D., Rusu, A. A., Veness, J., Bellemare, M. G., ... & Hassabis, D. (2015). Human-level control through deep reinforcement learning. Nature, 518(7540), 529-533. https://doi.org/10.1038/nature14236 [4] Sutton, R. S., & Barto, A. G. (2018). Reinforcement learning: An introduction (2nd ed.). MIT Press. Data: https://www.kaggle.com/code/ashbellett/portfolio-optimisation/input GitHub: https://github.com/Nishant27-2006/mlportfoliomanaging
Copyright
Copyright © 2024 Nishant Gadde, Avaneesh Mohapatra, Shreyan Dey, Siddhardh Manukonda, Shiva Uppaladinni, Vasavi Suresh. This is an open access article distributed under the Creative Commons Attribution License, which permits unrestricted use, distribution, and reproduction in any medium, provided the original work is properly cited.

Download Paper
Paper Id : IJRASET64375
Publish Date : 2024-09-28
ISSN : 2321-9653
Publisher Name : IJRASET
DOI Link : Click Here
 Submit Paper Online

