Ijraset Journal For Research in Applied Science and Engineering Technology
- Home / Ijraset
- On This Page
- Abstract
- Introduction
- Conclusion
- References
- Copyright
Experimental Investigation and Validation of Measured Wind Turbine Noise Characteristics using Standardized Technology
Authors: Dr. G. Arivukkodi, David Solomon. J.C, Dr. Rajesh Katyal
DOI Link: https://doi.org/10.22214/ijraset.2024.64651
Certificate: View Certificate
Abstract
This paper aims in affirming the accuracy and consistency of acoustic noise assessment at an experimental and Grid Connected wind turbine. The experimental turbine is a three-bladed, upwind turbine located in the Tuticorin District of Tamil Nadu State in India. The measurement campaign was carried out during the noise measurement equipment by Brüel & Kjær (B&K) PULSE Wind Turbine Sound Power Determination system strictly in accordance with the IEC 61400-11 2012-11 AMDI 2018 Ed.3.1. The Experimental study deals in the measurement of total noise emitted from various wind turbine component and sub-systems, when the turbine is in ON condition. The background noise was obtained while the turbine is in OFF condition. The measurement data was obtained as per the above referred standards for wind speeds ranging from 7m/s to 13.5 m/s at 50m hub height. The measurement was also obtained simultaneously at 10m height above ground level for the wind speed ranging 6m/s to 8m/s during the windy season of September 2022. The measurement data both at turbine hub height and 10m level were obtained at the same atmospheric condition 26o C and 0.996atm and in a down wind direction. The other parameters like A-weighted sound pressure level, 1/3 octave band spectrum, electric power, and wind speed were also measured at both hub heights at 10m level. The measured parameters were compared with the PULSE Software output and in the process; it is concluded that the noise characteristic of the experimental wind turbine is less than 3dB at a distance of 66m in the down wind direction from the test turbine. The measured results were also validated from the PULSE software and the results show a close match.
Introduction
I. INTRODUCTION
Wind energy is a fast-growing renewable energy with high demand due to its benefits of clean and eco-friendly power generation. Despite these advantages, the wind turbine generates noise characteristics during the power generation period. It is concerned with the environmental impact of social and ecological factors. The turbulent air interaction on the wind turbine blade generates aerodynamic noises and tonal characteristic of noise is generated from the interaction between mechanical components [1]. The noise level is higher in the higher wind speed with the wind-induced background noise levels. The intensity of the noise level depends on the weather condition, surface characteristics, and other factors [2]. Wind turbine noise is classified as tonal, broadband, low frequency, and impulsive which are based on the noise level variation during the varying time period and rotational blade effects. Noise is a sound wave that propagates in the fluid medium in the form of pressure difference and reached hearing quantity. In acoustics, most of the sound waves are having wide frequency range that is of a broadband nature [3]. These pressure differences are measured by using sound level meters and converting them into voltage signals. This measurement gives the broadband sound level by combining a wide range of frequencies into a single weighted [4]. The possibility of broadband noise generation in a wind turbine is more, some sources are leading edge turbulence interaction, trailing edge, and blade tower interaction noises. All these sources are present in the low-frequency noise over 500Hz at the specific turbine [5]. The acoustic measurement techniques for the wind turbine has introduced by the international electrotechnical commission. The standard ensures the quality of acoustic measurement in wind turbines and provides complete guidance for measuring, analyzing, and reporting complex noise emission of the wind turbine noise.[6]. This method is most commonly used for wind turbine emission measurement and provides data for comparison of models and makes, and it is the earliest version of noise measurement [7]. The sound level closer to the turbine is measured using this procedure and calculates the sound power level of the turbine at the wind speed in Hub height and 10m height mast. The microphone used in this method is placed on the measurement board kept in the ground to reduce the other influences. Both the wind speed and sound power level are measured at a simultaneous period of time [8].
Gallo. P et al[9] conducted the outdoor acoustic measurement to determine the emission and residual noise components using free-field microphones. They evaluate the residual noise level and environmental impact of the wind farm without shutdown and compare it with the predicted residual noise using the Nord2000 noise module. Ramachandran et al[10] investigate the noise level in a large wind turbine using an OptiNav 24 microphone array to locate mechanical and aerodynamical noise sources. He found the separation of blade noise in this method. This method is effective to study the detailed wind turbine noise by applying advanced methods. Oerlemans et al[11] carried out the prediction and validation of noise component measurements in two large wind turbines by using a microphone array. They found a minor deviation between predicted and measured sound pressure levels of less than 1 to 2 dB. Also, they predicted the turbine noise directivity functions and validated them against the experimental data. These validated noise prediction codes are applied for calculating noise footprints of wind turbine noise from the rotor center. Leloudas et al [12] studied the noise emission issues from wind turbines by comparing using experimental measurement with the simulation using an acoustic model. The measurement was carried out on the large wind turbine at the test site. They found good results between the predicted and measured noise levels, the noise level is reduced by 2dB(A). Zajamsek et al[13] conducted acoustic measurements in dwellings to find the low-frequency noise and infrasound characteristics by using the sound level meter of B&K LANXI DAU with pulse software. They found the variation of one-third octave band over time which perceive annoying. Boczar et al[14] measured and analyzed the infrasound generated by the operating wind turbine using the B&K system which meets the requirement of standard IEC 61400-11. The system is highly feasible to measure the infrasound from the WT. In these research papers, noise measurement was conducted to find the various noise sources from the turbine components. Most of the paper focuses on predicting the noise components using a different module and compared with the experimental measurement. This paper study about acoustic measurement in a test turbine using the standardized measurement system. The noise components of the test turbine were measured experimentally and validated against the numerical results. Section 2 of this paper describes the methodology and experimental procedure of noise measurement. Section 3 describes the brief discussion of obtained results and the paper concluded with the outcomings of this work in section 4
II. METHODOLOGY
This work describes the assessment of acoustic noise measurement in a test turbine based on IEC standard IEC 61400-part 11 Acoustic measurement techniques edition 3.1[15]. The main objective of this work is to measure, analyze, and validate the acoustic noise emission from the test turbine as per the requirement of the standard. The quality of measurement is ensured by using the B&K PULSE type 7914 instrument for the entire work. For the measurement, the microphone is positioned at the reference distance as per the standard procedure. And also the 10m met mast is placed at a reference distance to measure the non-acoustic parameters. The overall noise level was obtained by both background noise and total noise measurement which is highly related to wind speed. Hence normalized wind speed at hub height, and 10m height for total noise measurement and background noise measurement is investigated in this paper. The acoustic and non-acoustic measurement is performed on the test turbine as per the standard atmospheric condition. The data acquisition system captures the acoustic and non-Acoustic data are recorded 10 sec periods as per standard. The obtained data are evaluated by B&K PULSE wind turbine noise measurement ed 3. Software. The data reduction procedure from the standard is applied experimentally for validation. Finally, the results are compared and verified. In this work, the acoustic measurement of the sound pressure level at hub height and 10m height is investigated to identify the noise level of the turbine. Figure 1 represents the work methodology of noise measurement in a test turbine.
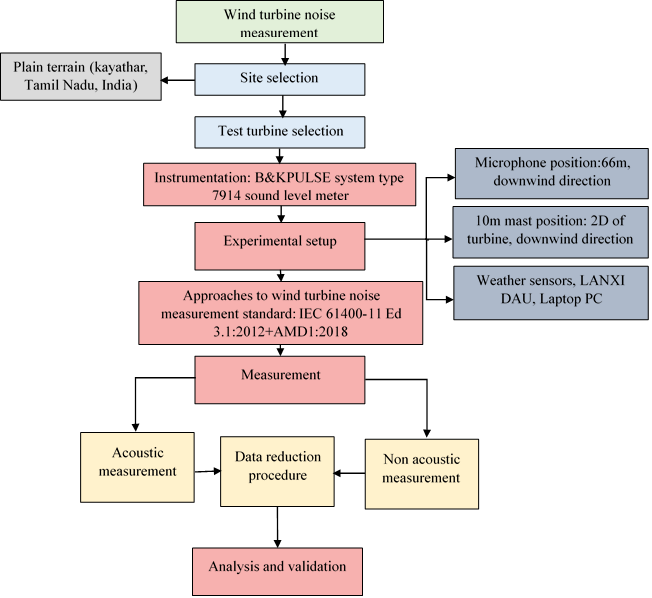
Figure 1: Wind turbine noise measurement methodology
A. Acoustic Field Measurement
The acoustic noise measurement is performed in a test turbine having a Fixed Speed Stall regulated Wind Turbine with vortex generators. The test turbine is horizontal axis upwind turbine located in the Tuticorin district of Tamil Nadu state in India. The Table 1 represents technical specification of test turbine. The test site is located in plain terrain at an approximate elevation of 102m above sea level. There are no reflecting structures on the site and the surrounding 1Km area was covered with bushes and grasses. The power generation from this turbine during measurement is connected to the nearby substation through an 11Kv internal grid line. The integrated sound level meter of B&K PULSE sound power determination system type 7914 is installed in the test site which has a ½ inch free-field microphone with primary and secondary windscreen connected to LANXI data acquisition hardware, and Laptop with PULSE LABSHOP wind turbine noise measurement ed.3 software.
Table 1: Technical specification of the test turbine
|
Properties |
Values |
|
Rated power |
250kW |
|
Rated wind speed |
14m/s |
|
Rotor diameter |
32m |
|
Hub Height |
50m |
|
No of blade |
3 |
|
Rotor speed |
35rpm |
|
Tower type |
Lattice |
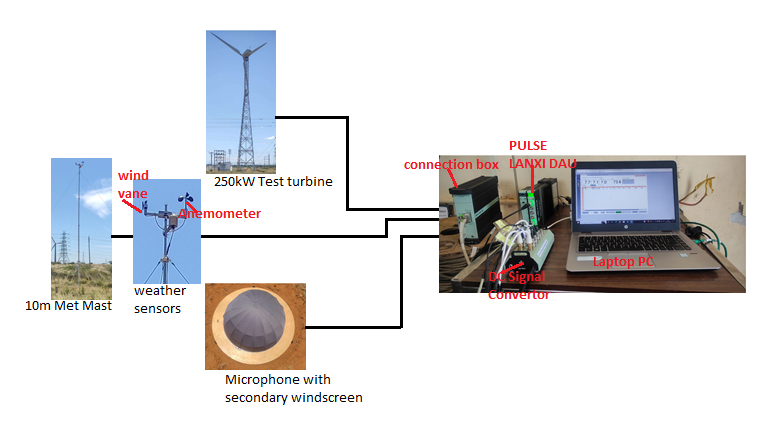
Figure 2: Wind turbine noise measurement experimental setup
The experimental setup of measurement system is given in figure 2. The microphone is placed on the measurement board at a reference distance from the vertical centerline of the turbine. It is covered with a primary windscreen and a secondary windscreen made of open-cell foam which is used to reduce wind-induced noise, uneven weather conditions, and rain. The 10m met mast is located at the reference distance of two times of rotor diameter from the test turbine. The weather sensors mounted on the 10m mast measure the non-acoustic measurements. The turbine instruments measure the Hub height wind speed and other control parameters. The measurement is carried out under the standard atmospheric condition. The entire equipment system is calibrated before the measurement and the list of equipment with accuracy is given in table 2. The non-acoustic measurement of power, pitch, RPM, wind direction temperature, and pressure are obtained from the turbine and a 10m mast-mounted sensor is input to the AUX port 1 to 8 of the DC converter box. The A-weighted sound pressure level and A-weighted 1/3 octave spectrum with 20Hz to 10KHz of centre frequencies are intended to measure from acoustic measurement. The A-weighted microphone signal, turbine control signal, and 10m mast signal are given to LANXI data acquisition hardware. The laptop having PULSE lab shop software is connected to the LANXI box by using an Ethernet cable. All the noise data and weather measurement data are seen through the laptop system.
Table 2: Equipment requirement list for acoustic and non-acoustic measurement.
|
Equipment |
Characteristics |
Accuracy |
|
Measurement Board |
Circular Hardboard |
D=1m, t= 12mm |
|
Microphone |
fulfils the requirements of IEC 61672 class 1 |
Diaphragm= 13mm, frequency range= 6.3Hz to 20kHz |
|
Primary wind screen |
Open-cell foam sphere |
D=90mm |
|
Secondary wind screen |
Open cell foam hemispherical |
D=450mm |
|
Anemometer |
Wind speed measurement |
±0.2m/s, range 4m/s to 12m/s |
|
Wind vane |
Wind direction |
0 to 10v= 0° to360°, ±2° |
|
Temperature and pressure sensor |
Temperature and pressure measurement |
±1°C and ±1kPa |
|
Active power transducer |
Power measurement |
Class 0.5 |
B. Data Analysis
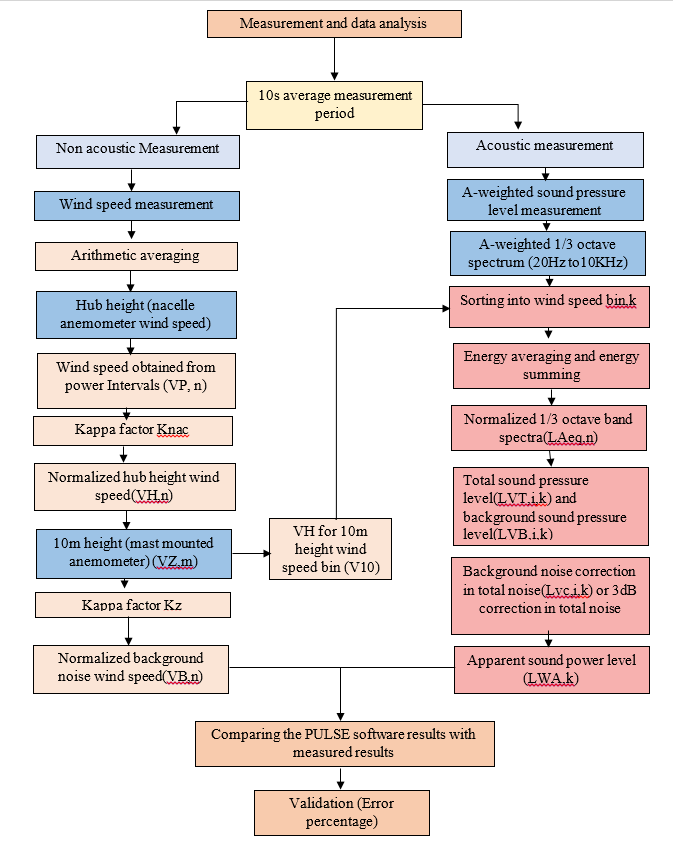
Figure 3: Flow chart of data analysis method
C. Wind Speed Measurement
Table 3: Wind speed measurement properties
|
Properties |
Values |
|
Nacelle anemometer height |
50m |
|
mast anemometer |
10m |
|
Wind blowing direction |
West |
|
Mast distance |
66m |
|
Measuring wind direction |
Downwind |
|
Average wind speed (yearly basis) |
6m/s at 20m height |
|
Power tolerance |
1% |
In the test site, the wind speed is measured for both Hub height and 10m height by using a nacelle anemometer and a mast-mounted anemometer. The properties used for wind speed measurement are given in the table 3. Both the anemometers were calibrated as per the requirement of the standard. The power curve is majorly contributed to wind speed measurement. The power curve should satisfy the power intervals [15]. It is also called the allowed range of the power curve. The wind speed calculation from the power curve (Vp,n) is obtained by the interpolation between the measured electric power and the power curve[16].
The kappa factor(Knac) is obtained by averaging the ratio between wind speed obtained from the power curve in the allowed range to the measured wind speed at the hub height. The derived ratio is applied to the measured wind speed from the nacelle anemometer with data points outside the allowed power range to obtain the normalized wind speed (Vnac, n). The wind speed outside the allowed power range is omitted during the analysis. During background noise measurement, a 10m mast-mounted anemometer measured wind speed is used for correlation[17]. The ratio between wind speed determined from the power curve (Vp,n) to the measured wind speed from a 10m mast-mounted anemometer (Vz,m) derived within the allowed range. The average of the derived ratio gives the kappa factor at 10m height (Kz ). The product of obtained ratio to the measured wind speed at 10m height gives normalized background noise VB,n and it is measured for all the power ranges.
D. Sound Pressure Level Measurement
The sound power level measurement of the test turbine is performed based on the statistical procedure described in the standard IEC 61400-11 ed. 3.1[ 15]. The position of the instruments is also closer to the turbine to reduce the uncertainty of sound pressure losses. As per the standard, the microphone is positioned in the reference distance to catch the sound pressure propagation.
The measured sound pressure level is used to calculate the apparent sound power level at the rotor center of the wind turbine. The estimation of sound power data within the wind speed ranges helps to characterize the sources of noise at different conditions [18]. This analysis aims to find the A-weighted 1/3 octave band spectra, and overall A-weighted sound pressure levels by using statistical methods. The equivalent A-weighted noise level and 1/3 octave spectrum are measured for the energy average of a 10s period with the center frequencies from 20Hz to 10KHz. The logarithmic summing of each individual value in the 1/3 octave spectrum is used to determine the normalized 1/3 octave band spectra (LAeq,n). The average wind speed bin as a 10s period is used for the sound level measurement. In the same way, background noise is determined. The background noise spectrum is subtracted from the operation noise spectrum to get the total noise of the measurement.
E. Apparent Sound Power Level
In the wind speed bin k, all the normalized sound pressure levels are sorted. The energy average of the sound pressure level in each 1/3 octave band is calculated for total noise and background noise measurement. The correction of background noise from the total noise level is applied, if the total noise LVT,i,k is less than 3dB higher than the background noise LVB,i,k, the 3dB correction is only applied in total noise and background correction is not considered. The background corrected noise level is used to calculate the apparent sound power level of each 1/3 octave band [19]. In this, the slant distance of the rotor centre to the microphone position is applied. The energy summing of the sound power level per octave band gives the apparent sound power level of the turbine. The difference between the sum of total noise and the sum of background noise in 1/3 octave bands is calculated. If the difference is between 3dB to 6dB then the result is marked asterisk and reported as noise less than 6dB or if it is 3dB or less the result is marked as noise less than 3dB.
III. RESULT AND DISCUSSION
The acoustic field measurement was conducted on the test turbine located in the Tuticorin district of Tamil Nadu. This measurement campaign was conducted in the windy season of September 2022. The measurement was carried out in the daytime at IST from 10.58 A.M to 12.30 P.M. The noise emission is measured typically for 10s average period per measurement at the test turbine with the same weather condition of 26°c and 0.996atm. The noise measurement data was obtained in between the range of 8.5m/s to 13m/s. The microphone is set at a distance of 66m in the downwind direction. The PULSE system 7914 ensures the position of the microphone which is ± 15° relative to the downwind direction of the test turbine. The turbine noise and background noise are measured for both 10m height and Hub Height of 50m. The bin width applied for the Hub height wind speed is 0.5 m/s and for the 10m height wind speed is 1m/s respectively. The total number of data points obtained for both turbine noise and background noise during the measurement at hub height and 10m height is given in the table 4. More than 180 measurement data were obtained from noise measurement for both hub height and 10m height.
Table 4: Number of data counts measured in both Hub Height and 10m height
|
No. of counts in Hub Height |
||||||||||||||
|
Wind Speed (m/s) |
7 |
7.5 |
8 |
8.5 |
9 |
9.5 |
10 |
10.5 |
11 |
11.5 |
12 |
12.5 |
13 |
Total |
|
Count total Noise |
- |
- |
- |
4 |
15 |
15 |
15 |
23 |
13 |
19 |
19 |
34 |
16 |
173 |
|
Count background noise |
- |
- |
- |
6 |
5 |
19 |
11 |
36 |
38 |
32 |
28 |
28 |
32 |
235 |
|
Total counts |
- |
- |
- |
10 |
20 |
34 |
26 |
59 |
51 |
51 |
47 |
62 |
48 |
408 |
|
No of counts in 10m Height |
||||||||||||||
|
Wind Speed (m/s) |
6 |
7 |
8 |
9 |
10 |
11 |
12 |
13 |
14 |
15 |
16 |
17 |
18 |
Total |
|
Count total Noise |
- |
34 |
51 |
38 |
51 |
- |
- |
- |
- |
- |
- |
- |
- |
174 |
|
Count background noise |
- |
30 |
85 |
60 |
89 |
- |
- |
- |
- |
- |
- |
- |
- |
264 |
|
Total counts |
- |
64 |
136 |
98 |
140 |
- |
- |
- |
- |
- |
- |
- |
- |
438 |
A. Wind Speed Measurement
Wind turbine noise generation is based on the wind speed range of the site. Because aerodynamic noises are most dominant than mechanical noise. Initially, the wind speed range is identified by evaluating the allowed range of the power curve. The allowed range is the one in which the slope of power satisfies the power curve intervals. The wind speed of the turbine during the noise measurement is should be within the allowed range of the power curve.
For the total noise measurement, the wind speed was measured at the hub height obtained by a nacelle anemometer. By using interpolation correlation normalized wind speed of the hub height is determined. The normalized wind speed is arithmetically average for each bin having 0.5m/s width. and the result of both software and experimental output is given in the table. The table 5 shows the varying wind speeds obtained in the range of 8.5m/s to 13m/s.
Table 5: Average normalized wind speed at the Hub height
|
Wind speed Bin[m/s] |
Total noise measurement |
Background noise measurement |
||
|
Numerical output |
Experimental output |
Numerical output |
Experimental output |
|
|
Average wind speed per bin [m/s] |
Average wind speed per bin [m/s] |
Average wind speed per bin[m/s] |
Average wind speed per bin[m/s] |
|
|
8.5 |
8.6 |
8.6 |
8.4 |
8.4 |
|
9 |
9.1 |
9.1 |
9.0 |
8.9 |
|
9.5 |
9.5 |
9.5 |
9.5 |
9.5 |
|
10 |
9.9 |
9.9 |
9.9 |
9.9 |
|
10.5 |
10.4 |
10.4 |
10.5 |
10.5 |
|
11 |
10.9 |
10.9 |
11.0 |
11.0 |
|
11.5 |
11.5 |
11.5 |
11.5 |
11.5 |
|
12 |
12.0 |
12.0 |
12.0 |
12.0 |
|
12.5 |
12.5 |
12.5 |
12.5 |
12.5 |
|
13 |
12.9 |
12.9 |
13.0 |
13.0 |
The comparison between both approaches gives the maximum relative error of 0.05% in the total noise measurement. There is a small variation between the software and experimental results. All the wind speed averages are rounded to one decimal point. The number of data points per wind speed bin also counted for experimental results and is compared to the software results is given in the figure 4. The maximum number of data points is obtained in the 12.5m/s wind speed bin in both approaches. The two outputs are equal in almost all the wind speed bins.
The wind turbine is kept parked during the background noise measurement. To ensure the background noise measurement is in the background condition, the measurement is taken before or after with the same setup for each series of wind turbine noise measurements. Since it is measured in parked condition, there is no power generation in the background noise measurement. For the background noise measurement, a 10m met mast anemometer is used for the wind speed measurement. The normalized wind speed at background noise measurement is obtained from the wind speed measurement correlation and it is arithmetically averaged. The average wind speed obtained from the numerical and experimental output of background noise measurement is given in the table. The comparison between both approaches shows a maximum relative error of 0.04% in background noise wind speed measurement. The smallest error was obtained in between the wind speed range of 9m/s.

Figure 4: Comparison of No. of data points per wind speed bin at hub height
The number of data points obtained from the normalized wind speed in background noise measurement during the software and experimental calculation is given in the figure 4. Comparing the obtained experimental results with software results gives a relative error of 0.69%. The smallest error was obtained in the wind speed ranges of 9m/s, 9.5m/s, 12.,5m/s, and 13m/s respectively
Within the allowed range of the power curve, the measured wind speed from the nacelle anemometer and obtained normalized wind speed at hub height are used to find the kappa factor (Knac). The normalized wind speed at hub height to the measured wind speed is given in figure 5. The Knac is obtained by arithmetic averaging of the ratio. The results are compared and the relative error between the two approaches is given in the table. The product of the kappa factor of the nacelle anemometer to the measured nacelle wind speed at the outside of the allowed range gives the normalized nacelle wind speed Vnac,n. It is outside the allowed range hence the Vnac,n values are omitted during the measurement.
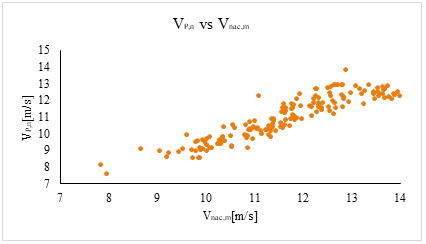
Figure 5: Measured nacelle wind speed vs Normalized Hub height wind speed
Table 6: Kappa factor of nacelle anemometer for both approaches
|
|
Numerical output |
Experimental output |
Percentage Error |
|
Kappa factor of nacelle anemometer Knac |
0.9408 |
0.9408 |
0.00022 |
The 10m height wind speed is measured for the entire measurement process. The normalized hub height wind speed to the measured wind speed at 10m height is given in figure 6. The kappa factor at 10m height Kz is derived from the ratio of normalized wind speed to the measured wind speed at the 10m height within the allowed range. The ratio obtained for software and experimental analysis is given in the table.
Table 7: kappa factor of 10m height wind speed measurement
|
|
Numerical output |
Experimental output |
Percentage Error |
|
Kappa factor for 10m height Kz |
1.2190 |
1.2200 |
0.082 |
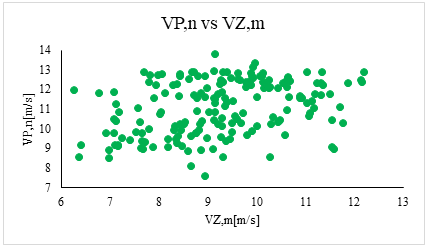
Figure 6: Plot of normalized wind speed versus measured wind speed to the 10m height.
During 10m height noise measurement, the normalized wind speed at hub height is redefined to the corresponding 10m height wind speed bin. The result was obtained at the wind speed range of 7m/s to10m/s. By using the wind speed correlation that results in the wind speed bin 7m/s, 8m/s, 9m/s, and 10m/s are ranged at 9.1m/s, 10.4m/s,11.8m/s, and 13m/s at hub height. The wind speed of total noise and background noise are sorted in their appropriate bin and arithmetically averaged. The average wind speed per bin of 10m height noise measurement is given in the table. The number of data points obtained in the wind speed bin for total noise and background noise at 10m height is given in figure 7.
Table 8: Average normalized wind speed measurement at 10m height
|
Wind speed Bin[m/s] |
Total noise measurement |
Background noise measurement |
||
|
Numerical output |
Experimental output |
Numerical output |
Experimental output |
|
|
Average wind speed per bin [m/s] |
Average wind speed per bin [m/s] |
Average wind speed per bin[m/s] |
Average wind speed per bin[m/s] |
|
|
7 |
9.2 |
9.3 |
9.2 |
9.2 |
|
8 |
10.4 |
10.4 |
10.6 |
10.7 |
|
9 |
11.8 |
11.8 |
10.7 |
10.7 |
|
10 |
12.6 |
12.6 |
13.0 |
13.0 |
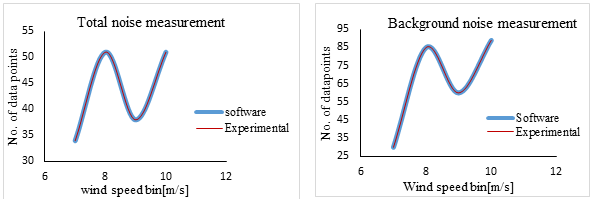
Figure 7: Comparison of No. of data points per wind speed bin @ 10m height
B. Sound Pressure Level
According to the standard IEC 61400-11, all measured sound pressure levels are binned in the wind speed bin. All the calculations are based on the standard that is recommended for sound power levels of wind speeds. The normalized 1/3 octave band spectrum (LAeq,n,j )is obtained by the measured overall noise level and 1/3 octave band spectrum with center frequencies 20Hz to 10KHz. Figure 8 shows the scatter plot of the normalized 1/3 octave band and hub height wind speed at the total noise measurement and background noise. The noise measurement required at least 10 measurements per wind speed bin. The noise measurement without background data in a bin is not considered for the assessment. The calculation of the normalized 1/3 octave spectrum of background noise at hub height is similar to the total noise measurement. The values outside the allowed range are omitted during the sound pressure level estimation in total noise measurement. In background noise measurement these allowed ranges are not considered. From the figure noise level is increased due to the increasing wind speed range in the total noise measurement and in the background noise measurement the 62dB to 63dB of wind speed is predicted in the ranges of 8m/s to 14 m/s. It is a wind-induced noise because the turbine is parked during the background noise measurement.
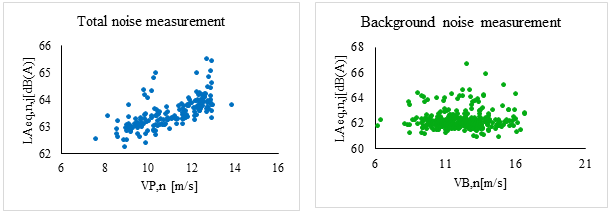
Figure 8: Normalized 1/3 octave band spectrum at total noise measurement and background noise measurement at hub height
The A -weighted sound pressure levels are measured from the centre frequency of 20Hz to 10kHz in one third octave band spectrum. The average sound pressure level of total noise and background noise at octave band in wind speed bin is obtained by energy averaging of measured sound pressure level for the measurement period at the 1/3 octave band in the wind speed bin. the energy summing of the octave band results total sound pressure level and background sound pressure level of the wind speed bin. the obtained result is given in the table. The 3dB noise correction is applied to the total noise sound pressure level before background correction. Because the total noise is no higher than 3dB from the background noise. The correlation between corrected sound pressure level and slant distance of measurement position is used to obtain the apparent sound power level. The table shows results of sound power level at hub height.
Table 9: Sound power level measurement per wind speed bin at hub height
|
Wind speed bin [m/s] |
Numerical output |
Experimental output |
Error % |
||||
|
Total sound pressure level [dB(A)] |
Background sound pressure level [dB(A)] |
Sound power level [dB(A)] |
Total sound pressure level [dB(A)] |
Background sound pressure level [dB(A)] |
Sound power level [dB(A)] |
||
|
8.5 |
62.9 |
62.5 |
102.3 |
62.8 |
62.4 |
102.2 |
0.10 |
|
9.0 |
62.9 |
62.6 |
102.2 |
62.9 |
62.5 |
102.1 |
0.08 |
|
9.5 |
63.1 |
62.4 |
102.4 |
63.0 |
62.3 |
102.4 |
0.07 |
|
10.0 |
63.5 |
62.1 |
104.0 |
63.4 |
62 |
103.9 |
0.09 |
|
10.5 |
63.4 |
62.1 |
103.9 |
63.3 |
62 |
103.8 |
0.10 |
|
11.0 |
63.3 |
62.2 |
103.4 |
63.3 |
62.1 |
103.3 |
0.14 |
|
11.5 |
63.5 |
62.2 |
103.9 |
63.4 |
62.1 |
103.8 |
0.11 |
|
12.0 |
63.8 |
62.5 |
103.9 |
63.7 |
62.3 |
103.8 |
0.12 |
|
12.5 |
64.0 |
62.6 |
104.2 |
63.9 |
62.4 |
104.0 |
0.15 |
|
13.0 |
64.3 |
62.1 |
104.9 |
64.1 |
62 |
104.7 |
0.18 |
The obtained sound power level to the hub height wind speed is given in figure 9. Comparison between experimental and numerical result shows relative error less than 1% respectively. This results the validation results are close match to the software.
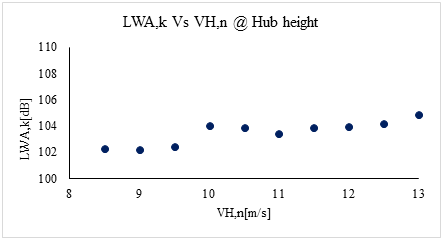
Figure 9: Apparent Sound power level to the Hub height wind speed
The sound power level of 10m height wind speed is calculated as a similar method of hub height measurement. For 10m height measurement, the sorted wind speed bin for 10m height is used and the sound pressure level is also selected from the sorted bin. The range of wind speed at 10m height is 7m/s to 10m/s. the table shows the sound power level results obtained from both approaches. The calculation for sound power level is based on the standard. the amount of sound energy emitted from the turbine at 10m height per wind speed range is obtained with corrected background noise. The result of the apparent sound power level to the wind speed bin is given in the figure 10. The experimental results are compared with the software results. The maximum relative error is 0.16% respectively. The result of both approaches is given in the table.
Table 10: Sound power level at 10m height
|
Wind speed bin [m/s] |
Numerical output |
Experimental output |
Error % |
||||
|
Total sound pressure level [dB(A)] |
Background sound pressure level [dB(A)] |
Sound power level [dB(A)] |
Total sound pressure level [dB(A)] |
Background sound pressure level [dB(A)] |
Sound power level [dB(A)] |
||
|
7.0 |
63.0 |
62.5 |
102.3 |
62.9 |
62.4 |
102.3 |
0.07 |
|
8.0 |
63.4 |
62.2 |
103.9 |
63.3 |
62.1 |
103.8 |
0.11 |
|
9.0 |
63.6 |
62.3 |
104.0 |
63.5 |
62.2 |
103.9 |
0.11 |
|
10.0 |
64.3 |
62.4 |
104.9 |
64.0 |
62.3 |
104.6 |
0.36 |
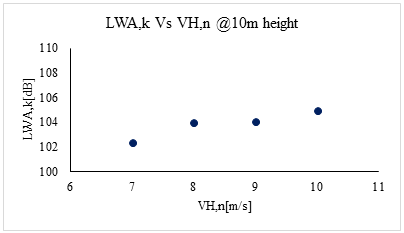
Figure 10: Apparent sound power level to the wind speed at 10m height
C. 1/3 octave Band Spectra
The noise generated from the wind turbine is corrected for 1/3 octave band level of background noise and total noises. It is the energy average of the corrected three noise spectra that is the frequency was divided into one-third of an octave band. As per standard, the 1/3 octave band filters in the sound level meter fulfill the requirement of class 1 in IEC61260. This spectral analysis has constant frequency ranges from 20Hz to 10KHz. The A-weighted sound pressure level was measured through the time series for these center frequencies. Figure 11&12 shows the octave band measurement results at 8.5m/s to13m/s wind speed.
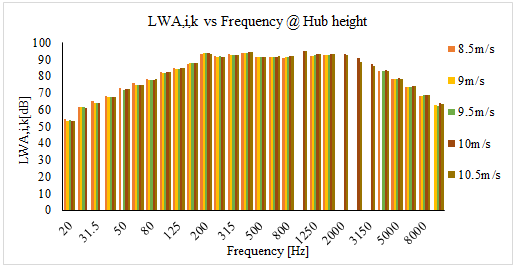
Figure 11: 1/3 Octave band spectrum of wind speed bin 8.5m/s to10.5m/s
The figure shows the characteristics of one third octave band to the apparent sound power level. The uniform sound level is obtained from the 10m/s and 10.5m/s wind speed bins. The total noise level is lesser than background noise in the centre frequencies from 2KHz to 4kHz for the wind speed range of 8.5m/s, 9m/s, and 9.5m/s respectively. This is due to low wind speed that total noise level decreased and background noise dominated. The sound power level is higher in the high frequencies at high wind speeds 11m/s to 13m/s. It uniformly increased at the frequency range of 100Hz to 1600Hz.
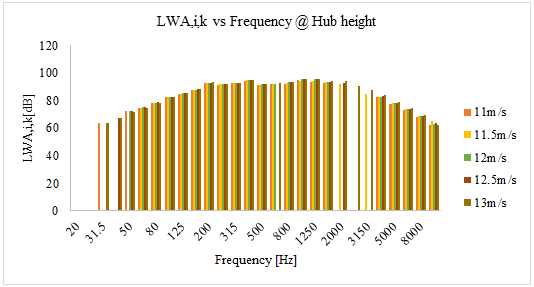
Figure 12: 1/3 Octave band of wind speed bin 11m/s to 13m/s
The total noise level lesser than the background noise level is omitted in the octave analysis. For this 1/3 octave analysis, the total noise should be 3dB higher than the background noise level. In this analysis noise level obtained is lesser than 3dB. Hence analysis results in the sound power level that is corrected for the background noise level and is reported in brackets.
A similar principle is followed for the 10m height measurement. In this measurement, the 1/3 octave is analyzed for 7m/s to 10m/s wind speed bins. The result shows the peak sound power levels in the frequency range of 100Hz to 1600Hz for all the wind speed bins. Figure 13 shows the 1/3 octave band of 10m height measurement. The test turbine results in less amount of noise emission which is noise less than 3dB background noise.
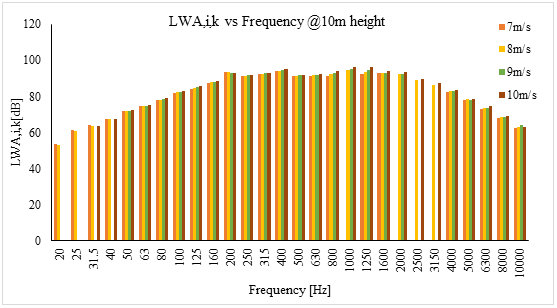
Figure 13: 1/3 Octave band spectrum for 10m height measurement
Conclusion
This paper presents the study of acoustic noise measurement and validation in a test turbine. The acoustic field measurement was conducted during the windy season at the test site. The field measurement records the 10s averaged measurement data of total noise and background noise measurement in 10m height and hub height. The noise measurement results were obtained at the wind speed ranges of 8.5m/s to 13m.s at hub height and 7m/s to 6m/s at 10m height. The average wind speed was obtained for both heights with closer to software results. The sound power level of the test turbine was calculated at the hub height and a 10 m height was obtained. The results indicate the turbine noise level was less than 3dB. The experimental results are validated with the software outputs from the PULSE sound power determination system. That shows the difference between the two approaches was less than 1% which is a 0.1dB variation obtained in analysis results. The resulting noise level from the experiment is comparable with the software result. For further assessment, the noise level is validated within the uncertainties.
References
[1] Deshmukh, S., Bhattacharya, S., Jain, A. and Paul, A.R., 2019. Wind turbine noise and its mitigation techniques: A review. Energy Procedia, 160, pp.633-640. [2] Van Den Berg, F., 2008. Criteria for wind farm noise: Lmax and Lden. Journal of the Acoustical Society of America, 123(5), p.3536. [3] Jacobsen, F., Poulsen, T., Rindel, J.H., Gade, A.C. and Ohlrich, M., 2011. Fundamentals of acoustics and noise control. [4] Rogers, A.L. and Manwell, J.F., 2004. Wind turbine noise issues. White paper by Renewable Energy Research Laboratory, University of Massachusetts at Amherst, Amherst, MA. [5] Doolan, C.J., Moreau, D.J. and Brooks, L.A., 2012. Wind turbine noise mechanisms and some concepts for its control. Acoustics Australia, 40(1). [6] Raman, G., Ramachandran, R.C. and Aldeman, M.R., 2016. A review of wind turbine noise measurements and regulations. Wind engineering, 40(4), pp.319-342. [7] Søndergaard B, Hansen TR, Oerlemans S. Measuring and Analyzing Wind Turbine Noise. InHandbook of Wind Energy Aerodynamics 2021 Jun 11 (pp. 1-19). Cham: Springer International Publishing. [8] Tonin, R., 2012. Sources of wind turbine noise and sound propagation. Acoustics Australia, 40(1). [9] Gallo, P., Fredianelli, L., Palazzuoli, D., Licitra, G. and Fidecaro, F., 2016. A procedure for the assessment of wind turbine noise. Applied Acoustics, 114, pp.213-217. [10] Ramachandran, R.C., Raman, G. and Dougherty, R.P., 2014. Wind turbine noise measurement using a compact microphone array with advanced deconvolution algorithms. Journal of Sound and Vibration, 333(14), pp.3058-3080. [11] Oerlemans, S. and Schepers, J.G., 2009. Prediction of wind turbine noise and validation against experiment. International journal of aeroacoustics, 8(6), pp.555-584. [12] Leloudas, G., Zhu, W.J., Sørensen, J.N., Shen, W.Z. and Hjort, S., 2007, July. Prediction and reduction of noise from a 2.3 MW wind turbine. In Journal of physics: conference series (Vol. 75, No. 1, p. 012083). IOP Publishing. [13] Zajamšek, B., Hansen, K.L., Doolan, C.J. and Hansen, C.H., 2016. Characterisation of wind farm infrasound and low-frequency noise. Journal of Sound and Vibration, 370, pp.176-190. [14] Boczar, T., Zmarz?y, D., Kozio?, M., Nagi, ?., Wotzka, D. and Nadolny, Z., 2022. Measurement of Infrasound Components Contained in the Noise Emitted during a Working Wind Turbine. Energies, 15(2), p.597. [15] Raman, G., Ramachandran, R.C. and Aldeman, M.R., 2016. A review of wind turbine noise measurements and regulations. Wind engineering, 40(4), pp.319-342., [16] Broneske, S., 2014, October. Wind turbine noise measurements-How are results influenced by different methods of deriving wind speed?. In Inter-Noise And Noise-Con Congress and Conference Proceedings (Vol. 249, No. 6, pp. 2023-2032). Institute of Noise Control Engineering. [17] Turbines–Part, W., 2012. 11: Acoustic noise measurement techniques. International Electrotechnical Commission. [18] Hansen, C.H., Doolan, C.J. and Hansen, K.L., 2017. Wind farm noise: measurement, assessment, and control. John Wiley & Sons. [19] Van den Berg, G.P., 2004. Effects of the wind profile at night on wind turbine sound. Journal of sound and vibration, 277(4-5), pp.955-970.
Copyright
Copyright © 2024 Dr. G. Arivukkodi, David Solomon. J.C, Dr. Rajesh Katyal. This is an open access article distributed under the Creative Commons Attribution License, which permits unrestricted use, distribution, and reproduction in any medium, provided the original work is properly cited.

Download Paper
Paper Id : IJRASET64651
Publish Date : 2024-10-17
ISSN : 2321-9653
Publisher Name : IJRASET
DOI Link : Click Here
 Submit Paper Online

