Ijraset Journal For Research in Applied Science and Engineering Technology
- Home / Ijraset
- On This Page
- Abstract
- Introduction
- Conclusion
- References
- Copyright
Microwave Frequency Analysis of Dielectric Properties in Biological Tissues: Insights into Dielectric Constant, Conductivity, and Resistivity at 9.4 GHz
Authors: Dr. M. K. Maurya, Harsh Verma, Sunil A. K. Kerketta
DOI Link: https://doi.org/10.22214/ijraset.2024.64288
Certificate: View Certificate
Abstract
This study investigates the dielectric properties of various biological tissues at microwave frequencies, specifically focusing on their dielectric constant, conductivity, resistivity, and loss tangent. Using methods such as Von Hippel’s and Yadav Gandhi’s techniques, the dielectric characteristics of heart, liver, brain, and muscle of chicken tissues were analysed at 9.4 GHz. It is found that tissues with higher water content exhibit greater dielectric constants and conductivities, while those with higher solid content, like liver, display higher resistivity. It has also been observed that tissues with lower dielectric constants and conductivities are those with greater absorption indices, which are typically associated with increased energy dissipation as heat. An increasing amount of energy dissipation may result from tissues with higher absorption rates being less effective at transferring microwave energy, as suggested by this inverse connection, which also emphasizes the complexity of electromagnetic wave interaction within tissues. This work provides critical insights into the interaction of electromagnetic waves with biological tissues, which is essential for applications in medical diagnostics, therapeutic technologies, and electromagnetic exposure safety standards.
Introduction
I. INTRODUCTION
Understanding the dielectric properties of biological systems is crucial for both determining safe exposure levels to electromagnetic radiation and utilizing it effectively in biomedical applications. Measuring the dielectric and emissivity properties of biological tissues is therefore vital in efforts to understand tissue interactions with electromagnetic energy. To further expand the use and potential applications of microwave energy, it is essential to consider the dielectric properties of tissues, which influence the absorption and propagation of electromagnetic energy through them. Consequently, by studying the dielectric constant, the properties of tissues in the microwave frequency range can be characterized.. Multiple studies [1][2] have proposed that the dielectric measurements of various biological tissues, which have differing water content (moisture), are likely to exhibit variations in their dielectric constants.
Therefore, dielectric constant and emissivity are crucial parameters for predicting the behavior of biological tissues in the microwave range.[3][4] Microwave radiation spans frequencies from 300 MHz to 300 GHz. In mobile communication, frequencies such as 800 MHz, 900 MHz, 1800 MHz, and 2450 MHz are commonly used, all of which fall within the microwave spectrum. Electromagnetic waves at these high frequencies, emitted by mobile phone towers, interact with human body tissues. This interaction is a complex process influenced by various factors.
In free space, electromagnetic waves are defined by their frequency, the intensity of the electric and magnetic fields along the direction of propagation, and polarization. High-frequency mobile phone waves generate fields with varying intensities at different locations.
This results in a stronger field intensity near the towers. Extended use of mobile phones can also impact individuals due to resonance and the concentration of the field near the human brain.
A. Effects of Microwave
(a)Thermal effects: Thermal effects refer to the interactions that result from the heating of biological specimens, which can also be reproduced using standard heating methods. The physiological mechanisms underlying health effects related to mobile phone radiation are not yet fully understood. High-frequency radiation can cause an increase in the temperature of human body tissues, a phenomenon known as the thermal effect. This effect can potentially disrupt cell function and hinder their development [7]. Tissue damage in humans could occur if the body is unable to dissipate the excess heat. Organs like the testis and the eye are particularly susceptible due to limited blood flow, which hampers heat dissipation [8]. When a person uses a mobile phone, most of the heating effect occurs on the surface of the head, leading to a slight increase in temperature. This temperature rise is less significant than what is experienced when the head is exposed to direct sunlight. The brain's blood circulation helps to dissipate excess heat, but the human eye's cornea lacks a similar temperature regulation mechanism. Studies have shown that exposure to Specific Absorption Rate (SAR) values between 100-140 W/kg for 1–2 hours can cause cataracts in rabbits' eyes by raising temperatures to approximately 40°C [9].
B. Non-thermal or Specific Effects
Non-thermal effects arise from the direct interaction between the electromagnetic field of incoming microwave radiation and biological tissues. Researchers have used rabbit eyes to determine the threshold for cataract formation, finding that for continuous-wave (CW) radiation, the threshold for long-term exposure in rabbits is around 100 mW/cm². Additionally, several instances of cataracts in humans due to microwave exposure have been documented at similar power density levels.
C. Biological Effects
- Blood-Brain Barrier Effects: Researchers from Lan University in Sweden investigated the impact of microwave radiation on rats' brains and discovered albumin leakage into the brain through the blood-brain barrier [10-12]. This study was later confirmed by H. Allan et al. [17]. However, other research groups have not fully replicated these results in studies involving whole animals or in vitro cell experiments
- Effects on Male Fertility and Semen: The electromagnetic waves emitted by mobile phone handsets can impact not only the overall body but also specifically affect male reproductive organs. This includes effects on sperm function, motility, count, and morphology. Research often includes studies of Sertoli cells and Leydig cells, as well as examinations of the blood-testis barrier and pituitary gland in relation to mobile phone radiation [13, 14].
- Risks to Pregnant Women and Children: Mobile phone radiation poses greater risks to children than adults, as children absorb more energy due to their smaller brain size, thinner skin and cranial bones, lower blood density, more elastic ears, and greater nerve cell conductivity. Damage to the eggs that form embryos can manifest as issues once the child reaches puberty [15]. The Russian National Committee on Non-Ionizing Radiation Protection advises limiting mobile phone use by pregnant women and children. Children who frequently use mobile phones may experience reduced attention, memory disruption, cognitive impairments, and increased irritability. Long-term risks include potential degeneration of brain structures and the development of depressive disorders [16].
- Effects on Skin: Mobile phone and tower radiation impact human skin. People who frequently use mobile phone handsets have higher levels of Transthyretin protein compared to those who do not. This protein, produced in the liver, aids in transporting vitamin A throughout the body and is also linked to neurological conditions like Alzheimer’s [18].
- Ear Damage and Tinnitus: Tinnitus, characterized by the sensation of hearing a mobile phone ringing or phantom sounds, is a psychological condition reported by millions of mobile phone users worldwide. Those with tinnitus may experience difficulties with hearing and sleeping. Prolonged use of mobile phones, particularly for more than four years or for extended periods exceeding 40 minutes daily, increases the risk of hearing loss [19]. This auditory effect is linked to exposure to high-energy microwave radiation. When the head absorbs microwave pulses, it generates a thermoelastic wave of acoustic pressure that travels through bone conduction to the inner ear [20].
- Cell Phones May Weaken Bones: Researchers have measured bone density at the upper rims of the iliac wings in men who used mobile phones carried on their belts. The iliac wings are commonly used for bone grafting, so any reduction in bone density could necessitate reconstructive surgery. Therefore, it is advisable to keep mobile phones away from the body during daily activities [22].
D. Review of Biological effects
In recent years, there has been a significant global increase in cell phone usage and heightened concern about its impact on human health. This concern centers on public exposure to radiation emitted by cell phones and the potential effects of radio frequency (RF) electromagnetic radiation on biological tissues, particularly the brain and immune system. Research has highlighted various possible health issues, including brain tumors, changes in blood-brain barrier permeability, sleep disturbances, cognitive impairments, DNA damage, immune system dysfunction, and stress reactions. Additionally, there is an increased rate of traffic accidents linked to mobile phone use while driving. The potential risks of electromagnetic field exposure were first brought to public attention in the late 1970s by a Colorado study [2], which suggested a possible connection between magnetic field exposure from power lines and the development of childhood leukemia. The amount of RF radiation from a cell phone typically depends on factors such as the number of nearby base stations, cell phone network traffic, and the distance from the base stations. The power emitted by a base station can vary between different phones in the same area due to interference from obstacles like buildings and trees [3]. While cell phones are engineered to operate below levels that cause known thermal effects, radio frequency radiation may still produce other types of biological effects.
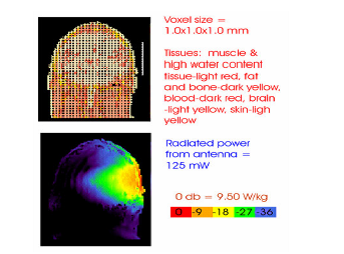
Fig2: SAR Effects
In Figure 2[35], the distribution of Specific Absorption Rate (SAR) is depicted for an anatomical model of the human head placed near a 125 mW dipole antenna. The peak SAR observed is 9.5 W/kg over a 1 mg area, clearly illustrating the impact. Figure 2 illustrates the SAR calculation (USAF/AFRL). Numerous research projects are currently investigating the effects of cell phone radiation on humans; however, there remains ongoing debate regarding safety. The cell phone industry argues that there is no scientific evidence linking electromagnetic radiation to harmful effects, while researchers report cellular damage from exposure to electromagnetic fields. These studies have demonstrated a notable increase in DNA damage in cells, which is not always fully repairable by the cells themselves[35].
II. ABOUT SAMPLE
The sample for Investigation of the Dielectric Properties of biological tissues at Microwave Frequencies is taken as ‘Aseel or Asil’ breed of chicken birdThe Asil birds are mainly found in Andhra Pradesh, Orissa, Madhya Pradesh and also in Chhattisgarh states of India. The Asil birds are characterized by their hardiness and ability to thrive under adverse climatic conditions. Asil chickens do not do well in a cold climate and they usually prefer dry conditions. Hence due to particularly dry & warm conditions and own surviving capability, these birds are found here. For measurement of parameters like dielectric constant, loss tangent, conductivity, resistivity, volume fraction of biological tissues from various organs i.e. brain, muscle, spleen, kidney, heart and liver of freshly battered chicken has been used.

Fig:-Aseel Chicken Bird
A. Methodology Applied
The sample for Investigation of the Dielectric Properties of biological tissues at Microwave Frequencies is taken as ‘Aseel or Asil’ breed of chicken bird, which is easily available in the climatic conditions of Ambikapur 23.1355° North to 83.1818° East, Chhattisgarh. The region experiences usually a warm and humid tropical climate with maximum temperature ranging from 10°C in winter to 45°C in summer seasons.We used only two method for measurement of dielectric properties of biological tissues which are:-
(1)Von hipple’smethod and (2) Yadav Gandhi method
1) Von hipple’s Method
This method is also known as the shorted waveguide method, this technique involves the reflection of microwaves, which propagate in the TE10 mode and are incident normally on a dielectric sample placed against a perfectly reflecting surface. When an electromagnetic wave traveling through medium 1 strike normally on medium 2, a part of it is reflected and the rest is either absorbed or gets transmitted. A standing wave pattern is thus produced in medium 1[4]. The transverse electric field component in this partial reflection case is given by
(1.1)
Where is the propagation constant in medium1
The reflection coefficient is given by
Where is the magnitude and
is the phase angle of reflection coefficient. The input impedance Z
at the boundary x = 0 is given by
Where is the impedance of medium 1.
As attenuation in medium 1 is negligible, inverse voltage standing wave ratio (IVSWR) in medium 1 may be written as
(1.2)
Putting
where
We may write equation as
=
(1.3)
(1.4)
On expanding coth u in equation =
(1.5)
If be the position of the first minimum (from the surface of the dielectric) where the incident and reflected waves combine out of phase, i.e. at a phase difference of π, we obtain
(1.6)
Thus the phase angle is obtained as
(1.7)
Substituting the value of from eq
in eq
=
, we obtain the expression for
as
(1.8)
If medium (2) is terminated in a short circuit, the input impedance at the interface x=0 is given by
(1.9)
Where ,
and d are respectively the characteristic impedance, propagation constant and the length of the medium (2). If the shorting metal plate is placed at a distance
from medium 2, it corresponds to an open circuited termination and the input impedance at the interface is
(1.10)
For rectangular waveguides, the propagation constant for
and
modes is given by
(1.11)
Where ε and μ are the absolute permittivity and permeability of the dielectric medium respectively. If and
are the values of these quantities for free space, then these can be related as
(1.12)
And (for non magnetic materials)
where is the complex dielectric permittivity of the dielectric medium given by
(1.13)
On using above mentioned three equations, equation can be expressed as
(1.14)
(1.15)
Where is the free space wavelength and
is the cut-off wavelength
(1.16)
If
and
are the attenuation constant and phase factor for the dielectric medium then
(1.17)
Separating real and imaginary parts of from previous equations, we get
(1.18)
(1.19)
Thus above two equations may be used for determining dielectric constant and loss factor for both low and high loss dielectric materials[4].
2) Yadav Gandhi Method
This method is used for the samples in powder form. This method is a combination of the method of Dube and Natrajan (1974) and the method employed for polar liquids in dilute solutions of non–polar solvents, employing a slotted waveguide and a short circuiting plunger used by Heston et al (1950). This method has been successfully studied by Srivastava and Vishwakarma (2004) for study of dielectric properties of Bauxite, by Gupta and Jangid (2008) for dielectric properties of soil and by Sharma et al.(2010) for determination of dielectric properties of wheat in powder form. When a rectangular waveguide filled with a dielectric material of complex permittivity ε* is excited in TEmn or TMmn mode, the propagation constant γd of the electromagnetic waves through the dielectric can be written as (Yadav and Gandhi,1992)[3]
(2.1)
Here and
are the attenuation and phase shift introduced by unit length of the material, measured respectively in Nepers/m and radians/m;
represents the wavelength of electromagnetic waves in free space and
is the cut off wavelength of the waveguide.
Substituting in above Eq. and separating real and imaginary parts, we obtain
(2.2)
(2.3)
The food grains are known to appreciably absorb electromagnetic radiation at microwave frequencies, as evidenced from the fact that the domestic microwave ovens operate at 2.45 GHz. In the present investigations equations (3.48) and (3.49) are used for finding out dielectric properties of the biological tissues. The main quantities to be measured experimentally are αd and βd for the samples for which ε' and ε" values are to be determined.
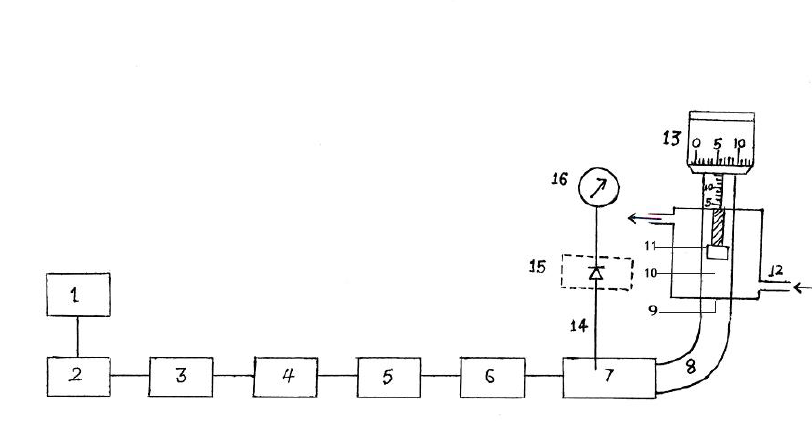
Fig. 3.1: Experimental set up for measurement of dielectric properties of powders by Yadav and Gandhi method.[3]
3) Symbolic Meanings of Numerals used in the Figure are as Given Below
|
1 |
Power supply |
9 |
Mica window |
|
2 |
Microwave oscillator |
10 |
Sample holder |
|
3 |
Isolator |
11 |
Moveable plunger |
|
4 |
Frequency meter |
12 |
Water circulating jacket |
|
5 |
E-H tuner |
13 |
Screw guage for plunger movement |
|
6 |
Variable attenuator |
14 |
Tuning probe |
|
7 |
Slotted waveguide section |
15 |
Crystal detector |
|
8 |
E-band |
16 |
Indicating meter |
4) Measurement of
The experimental arrangement is shown schematically in Fig.3.1. Microwave power obtained from a microwave source, viz. Klystron tube or Gunn Oscillator, is allowed to form standing waves in the slotted waveguide section after being reflected from the short circuiting plunger in the dielectric cell, which is initially kept at its lowest position in the cell. The probe in the slotted waveguide section is accurately adjusted at the node of the standing waves, as adjudged by the position of the minima in the indicating meter. Now a small quantity of food grain powder is introduced in the dielectric cell and the plunger is brought over it by moving the micrometer screw till a proper contact is established. The height h of the powder in the dielectric cell is determined from the difference of readings on the scale of micrometer screw taken with and without food powder in the cell. The position of minima in the slotted section shifts either towards the receiver or towards the generator on introducing the powder in the cell. The shift is towards the receiver when h < ( /4) and towards the generator when (
/4) < h < (
/2). If
and
are two heights of the powder column in the cell for which equal shift of minima position is obtained towards the receiver and the generator respectively, then
(2.4)
Where is the guide wavelength.
Combining above equations
(2.5)
Or (2.6)
Alternatively, we may go on adding slowly the powder in the dielectric cell till for a height h of the powder in the cell, the position of minima in the slotted section is the same as for the empty cell. For this position
or
(2.7)
Above equation permits us to directly determine the value of .
5) Measurement of
Let and
be the amplitudes of the incident and reflected fields respectively forming standing waves in the slotted guide carrying the probe. Assuming no loss in reflection,
with no sample in the sample holder, if the movable probe is located at maximum position and the indicating meter gives a deflection of
units, we may write
(2.8)
On introducing the sample of length L in the sample holder and locating the movable probe at the resulting maximum position, the output shown by the indicating meter will change to units due to partial absorption of the e.m. waves. The absorption takes place twice, once when the incident wave travels through the sample and again when the reflected wave travels through it. Therefore,
becomes
(2.9)
Again at the maximum, we have
(2.10)
From above mentioned two equations, we have
(2.11)
For measuring we start with the empty cell, the plunger being kept at the bottom of the cell. The probe is located at one of the maximas i.e., at the position of a voltage antinode in the waveguide slotted section, and reading
of the indicating meter is noted. The powder (flour of the food stuff in the present case) is now added slowly in the dielectric cell and position of the maxima in the slotted section is noted every time from the indicating meter. The height of the powder column in the dielectric cell (h') is accurately adjusted so that the probe position locating the maxima in the slotted section is again the same as with the empty cell. The deflection
of the indicating meter in this state, for such height h' of the powder column, is noted. In this experiment the electromagnetic waves travel twice through the powder column in the cell before they form stationary waves in the slotted waveguide section, after being reflected from the plunger of the dielectric cell. For obtaining appreciable absorption of the wave, height of the powder column in the cell is taken equivalent to several
The value of the
is then calculated using last equation .
III. RESULT & DISSCUSSIONS
The results obtained on the measurement of various parameters viz dielectric constant, Conductivity, resistivity and loss tangent for all important biological organs viz heart, spleen, kidney, muscle, brain, liver, of chicken bird at a frequency range @9.4 GHz, along with the variation of frequency are listed in table below.
Table for measured values
|
S.NO |
TISSUES |
CHICKEN TISSUES DATA |
|||||
|
|
|
Dielectric permittivity |
Conductivity |
Loss tangent |
Resistivity |
Index of absorption |
Volume fraction |
|
1 |
Liquid cell |
62-56 |
9.68 |
0.56 |
0.10 |
0.10 |
0.41 |
|
2 |
Brain cell |
59-57 |
9.17 |
0.51 |
0.10 |
0.09 |
0.43 |
|
3 |
Stomach |
58-56 |
8.70 |
0.44 |
0.11 |
0.07 |
0.44 |
|
4 |
Muscle |
34.1-33.8 |
7.50 |
0.40 |
0.13 |
0.05 |
0.73 |
|
5 |
Spleen |
33.2-32.7 |
6.68 |
0.43 |
0.14 |
0.06 |
0.74 |
|
6 |
Kidney |
31.1-29.05 |
5.95 |
0.42 |
0.16 |
0.06 |
0.76 |
|
7 |
Heart |
29.3-28.3 |
5.43 |
0.41 |
0.18 |
0.05 |
0.78 |
|
8 |
Liver |
22.4-21.2 |
4.49 |
0.39 |
0.22 |
0.05 |
0.84 |
The data indicates that the dielectric properties of tissues are heavily dependent on their water content, with tissues rich in water displaying higher dielectric constants, conductivity, and loss tangent, and lower resistivity. Conversely, tissues with higher solid content, such as the liver, show the opposite trend. These findings are crucial for understanding how electromagnetic waves interact with different biological tissues, with significant implications for medical diagnostics, therapeutic technologies, and safety standards regarding electromagnetic exposure.
The variation of dielectric permittivity and conductivity with tissues solid content, the Variation of dielectric constant & conductivity with index of absorption of tissue, the Variation of loss tangent & resistivity with tissues solid content and the Variation of loss tangent & resistivity with Index of absorption of tissue at 9.4GHz are plotted in fig 1,2,3,4 respectively.
The findings are summarized and discussed in relation to the four graphs presented:
A. Variation of Dielectric Permittivity and Conductivity with Tissue Solid Content
The analysis reveals a negative correlation between dielectric permittivity and conductivity with the solid content of tissues. Tissues with higher water content, such as the brain and liquid cells, exhibited higher dielectric permittivity and conductivity. This is consistent with the fact that water, a highly polar molecule, enhances the dielectric response and conductivity of tissues. Conversely, tissues with higher solid content, like the liver, demonstrated lower dielectric permittivity and conductivity. This trend indicates that the dielectric properties of tissues are significantly influenced by their water content, which is a critical factor in the interaction of microwave radiation with biological tissues.
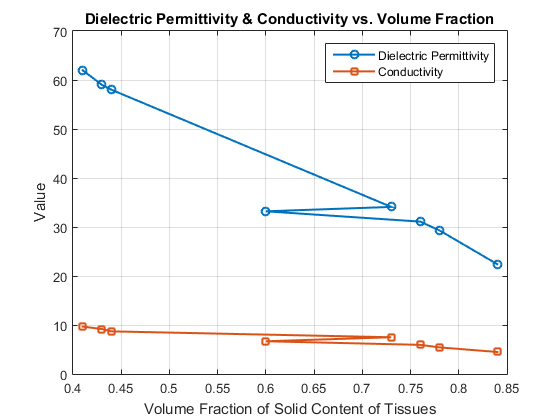
Fig1:- Relation between Dielectric Permittivity & Volume Faction
B. Variation of Dielectric Constant and Conductivity with the Index of Absorption
The dielectric constant and conductivity decrease as the index of absorption increases. This suggests that tissues with a higher absorption index, which generally corresponds to higher energy dissipation in the form of heat, have lower dielectric constants and conductivities. This inverse relationship highlights the complexity of electromagnetic wave interaction within tissues and suggests that tissues with higher absorption rates may be less efficient at transmitting microwave energy, leading to increased energy dissipation.
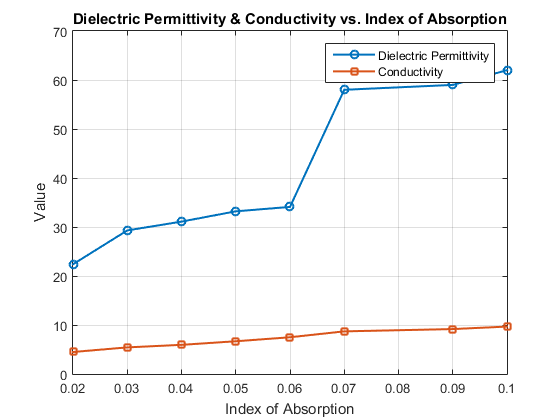
Fig2:- Relation between Dielectric Permittivity-Volume Faction & Index of Absorption
This also clears that as the index of absorption rises, the conductivity and dielectric constant fall. This indicates that tissues with lower dielectric constants and conductivities are those with greater absorption indices, which are typically associated with increased energy dissipation as heat. An increasing amount of energy dissipation may result from tissues with higher absorption rates being less effective at transferring microwave energy, as suggested by this inverse connection, which also emphasizes the complexity of electromagnetic wave interaction within tissues.
C. Variation of Loss Tangent and Resistivity with Tissue Solid Content
The loss tangent, which represents the energy lost as heat in the tissue, decreases with increasing solid content, while resistivity increases. Tissues with higher solid content, such as the liver and spleen, exhibit higher resistivity, indicating a reduced ability to conduct electric current. This trend reinforces the understanding that tissues with lower water content are less conductive and more resistant to microwave energy, thereby reducing energy dissipation.
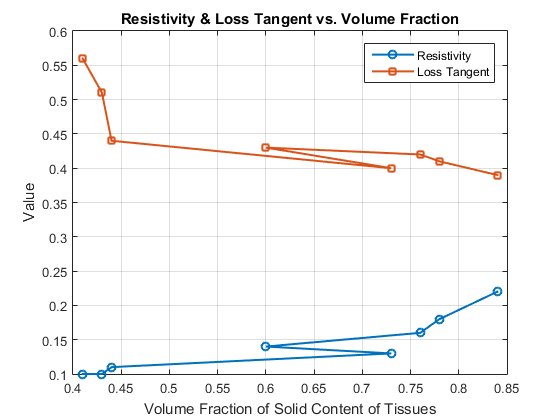
Fig3:- Relation between Resistivity- Loss tangent & Volume Faction
Which concludes Resistance rises as solid content increases, while the loss tangent—which shows the energy lost as heat in the tissue—decreases. Higher resistivity indicates a decreased capacity to conduct electric current in tissues with a higher solid content, such as the liver and spleen. The knowledge that tissues with reduced water content dissipate less energy because they are less conductive and more resistive to microwave energy is supported by this trend.
D. Variation of Loss Tangent and Resistivity with the Index of Absorption
As the index of absorption decreases, both the loss tangent and resistivity increase. This suggests that tissues with lower absorption indices (i.e., those that absorb less energy) are more resistive and lose less energy as heat. This relationship further supports the notion that water content and solid content significantly influence the electromagnetic properties of tissues, particularly in how they absorb and dissipate energy at microwave frequencies.
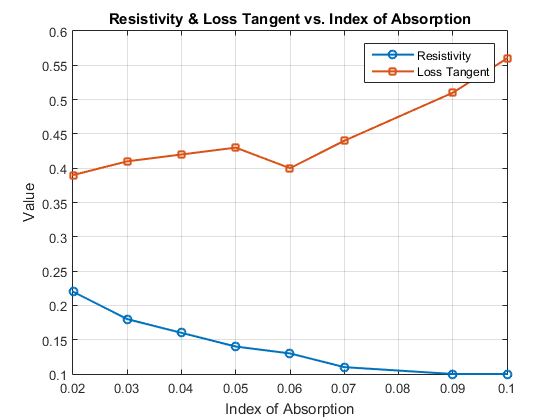
Fig4:- Relation between Relation between Resistivity- Loss tangent & Index of Absorption
The volume fraction of the solid content in the tissues P is calculated by assuming that the tissues are electrically equivalent to a suspension of low permittivity non-conducting sphere in water, using maxwell’s theory
where is dielectric constant of tissue
and is dielectric constant of water =80
The value of dielectric constant at 9.4GHz was used for calculation
- The index of absorption k is determinedby using following relation, provided the value of dielectric constant known, given by
Where is loss tangent.
Upon examining Figures 1 and 2, it is evident that as the solid content of tissue grows at 9.4GHz, dielectric permittivity, conductivity, and loss tangent drop, while resistance increases. As the index of absorption decreases, we can see from figures 2 and 4 that the resistivity increases while the dielectric permittivity, conductivity, and loss tangent decrease. Alternatively, we can draw the opposite conclusion: at 9.4GHz, the dielectric permittivity, conductivity, and loss tangent all rise as the absorption index does.
Consequently, it is evident that the water content of tissues affects how those tissues behave when exposed to microwave radiation. In light of this, it may be said that, in contrast to high solid content tissues like liver, high water content tissues, such as liquid cells or brain, have high dielectric constants, high conductivities, and small resistivities.
Conclusion
In order to better understand how different biological tissues interact with electromagnetic waves, we investigated their dielectric characteristics at a microwave frequency of 9.4 GHz in this work. We examined important characteristics including the dielectric constant, conductivity, resistivity, and loss tangent in a variety of tissue types, including chicken tissues such as the heart, liver, brain, and muscles, using the Von Hippel and Yadav-Gandhi methods. According to our research, there is a direct relationship between a tissue\'s water content and its dielectric characteristics. Higher water content results in higher dielectric constants and conductivities as well as lower resistivity. On the other hand, tissues like the liver that contain more solid matter have lower dielectric constants and higher resistance. These findings have implications for therapeutic technology, medical diagnostics, and the development of electromagnetic exposure safety guidelines. The employed approaches yielded a thorough comprehension of how the composition of tissue influences its reaction to microwave frequencies, underscoring the possibility of optimizing microwave-based technologies for use in safety and medical applications.
References
[1] B. D. karolker, j behari and A prime ‘biological tissues characterization at microwave frequencies’, IEEE Transcation on theory and techniques, vol MTT-33, no 1 january 1985. [2] Z. C. alex , j behari and A prime ‘biological tissues characterization at microwave frequencies: a review’ IEEE technical review, volume 11, no 1, January 1994. [3] S. K. Shrivastava, N. K. Gupta and H V Tiwari. “transmission line model of biological tissues at microwave frequency” , published in abstract of national conference on science and technology of nano-materials and clusters, November 23-25, 2000, Bhopal university M.P. [4] R Von hippel ‘dielectrics and waves’ john wiley and sons, INC, chapman & hall limited, London. [5] Joint Report by the Department of Defense and the U. S. Department of Health, Education and Welfare, \"A partial inventory of microwave towers, broadcasting transmitters, and fixed radar by states and regions,\" BRH/DEP 70-15 (1970). [6] J. Y. Harris, \"Electronic product inventory study,\" BRH/ DEP 70-29 (1970). [7] Environmental Health Series, U. S. Department of Health, Education and Welfare, \"Regulations, Standards and Guide for Microwave, Ultraviolet Radiation and Radiation from Lasers and Television Receivers, An Annotated bibliography,\" 1969. [8] T. S. Ely and D. E. Goldman, \"Heating Characteristics of Laboratory Animals Exposed to 10 cm Microwaves,\" Proceedings of Tri-Service Conference on Biological Hazards of Microwave Radiation, 1957. [9] L. E. Daily, Jr., \"Effects of microwave diathermy on the eyes,\" Amer. J. Physiol155: 432 (1948). [10] A. W. Richardson, T. D. Duane, and H. M. Hines, \"Experimental lenticular opacities produced by microwave irradiation,\" Arch. Phys. Med. 29: 765 (1948). [11] D. B. Williams,/. P. Monahan, W. J. Nicholson, and J. J. Aldrich, \"Biologic effects studies on microwave radiation time and power thresholds for production of lens opacities by 12.3 cm microwaves,\" A.M.A. Arch. Ophth. 54: 863 (1955). [12] R. L. Carpenter, \"An Experimental Study of the Biological Effects of Microwave Radiations in Relation to the Eye,\" RADC-TDR-62-133, 1962. [13] L. Birenbaum, G. M. Grosof, S. W. Rosenthal, M. M. Faret, \"Effects of microwaves on the eye,\" IEEE Transactions onBiomedical Engineering, BME-16(1): 7 (1969). [14] F. G. Hirsch and J. T. Parker, \"Bilateral lenticular opacities occurring in a technician operating a microwave generator,\" A.M.A. Arch. Indust. Hyg.6: 512 (1952). [15] M. M. Zaret, \"An experimental study of cataractogenic effects of microwave radiation,\" Technical Documentary Report No.RADC-TDR-64-273. Rome Air Development Center, Griffiss AFB, N. Y., 1964. [16] K. Marha, J. Musil, and H. Tuha, Electromagnetic Fields and the Life Environment, San Francisco Press, Inc., San Francisco,1971. [17] L. Minecki, \"Critical evaluation of maximum permissible levels of microwave radiations,\" Arhiv.zaHigijenu Rad. IToksikologiju {Zagreb) 15: 47 (1964). [18] A. A. Letavet and Z. V. Gordon, \"The biological action of ultra-high frequencies,\" Acad. Med. Sci. U.S.S.R. Translated by U. S. Joint Publ. Research Ser., 12471 (1962). [19] Y. A. Kholodov, \"The effects of electromagnetic fields on the central nervous system,\" Priroda4: 104 (1962). [20] A. S. Presman and N. A. Levitina, \"Nonthermal action of microwaves on cardiac rhythm,\" Biul, Eksper, Biol. Med.53(1): 41 (1961). [21] L. E. Daily, \"Clinical study of results of exposure of laboratory personnel to radar and high frequency radio,\" U. S.Navy Med. Bull. 41: 1052 (1943). [22] C. I. Barron and A. A. Baraff, \"Medical considerations of exposure to microwaves (Radar),\" / .Amer. Med. Assoc.168: 1194 (1958). [23] A. H. Frey, \"Biological function as influenced by low-power modulated RF energy,\" IEEE Transactions on MicrowaveTheory and Techniques. MTT-19(2): 153 (1971). [24] G. E. Hearn, \"Effects of UHF Radio Fields on Visual Acuity and Critical Flicker Fusion in the Albino Rat,\" Ph.D. dissertation, Baylor University, Waco, Tex. Univ. Microfilms 65-10,002 (1965). [25] S. Korbel and W. D. Thompson, \"Behavioral effects of stimulation by UHF radio field,\" Psychol. Rep. 17: 595 (1965) [26] J.A. Tanner, C. Romero-Sierra, and S. J. Davie, \"The effects of microwave on birds: preliminary experiments,\" / .Microwave Power 4(2): 122 (1969). [27] C. A. Van Ummersen, \"An Experimental Study of Developmental Abnormalities Induced in the Chick Embryo by Exposure to Radio Frequency Waves,\" Ph.D. dissertation, Dept. Biol., Tufts University, Medford, Mass., 1963. [28] R. L. Carpenter and E. M. Liystone, \"Evidence for nonthermal effects of microwave radiation: Abnormal development of irradiated insect pupae,\" IEEE Transactions onMicrowave Theory and Techniques, 19(2): 173 (1971). [29] J. H. Heller and Teizeira-Pinto, \"New physical method for creating chromosomal aberration,\" Nature, 183: 905 (1959). [30] D. E. Janes, W. M. Leach, W. A. Mills, R. T. Moore, and M. L. Shore, \"Effects of 2450 MHz microwaves on protein synthesis and on chromosomes in the Chinese hamsters,\" Non-Ionizing Radiation 1: 125 (1959). [31] G. Mickey, \"Electromagnetism and its effect on the organism,\" N. Y. State J. Med. 63: 1935 (1963). [32] J. Heller and G. Mickey, \"Nonthermal effects of radio frequency in biological systems,\" Digest Internat. Conf. Electronics 21: 2(1961). [33] A. T. Sigler, A. M. Lilienfeld, B. H. Cohen, and J. E. Westlake, \"Radiation exposure of parents of children with mongolism (Downs Syndrome),\" John Hopkins Hosp. Bull.117: 374 (1965). [34] \"Man\'s Health and Environment—Some Research Needs.\" Report of the Task Force on Research Planning in Environmental Health Sciences. U. S. Dept. of Health, Education and Welfare, 1970. [35] A. A. Aly, S. Bin Deris, and N. Zaki, \"Research review on the biological effect of cell phone radiation on human,\" in Proc. Innovations in Information Technology, 2008. IIT.
Copyright
Copyright © 2024 Dr. M. K. Maurya, Harsh Verma, Sunil A. K. Kerketta. This is an open access article distributed under the Creative Commons Attribution License, which permits unrestricted use, distribution, and reproduction in any medium, provided the original work is properly cited.

Download Paper
Paper Id : IJRASET64288
Publish Date : 2024-09-20
ISSN : 2321-9653
Publisher Name : IJRASET
DOI Link : Click Here
 Submit Paper Online

