Ijraset Journal For Research in Applied Science and Engineering Technology
- Home / Ijraset
- On This Page
- Abstract
- Introduction
- Conclusion
- References
- Copyright
Monitoring of Surface Water bodies in Mainpuri District Using Remote Sensing and GIS Technology
Authors: Harshita Kudeshiya, Monowar Alam Khalid, Sudhakar Shukla
DOI Link: https://doi.org/10.22214/ijraset.2023.54898
Certificate: View Certificate
Abstract
These days, a range of analytical tasks are carried out using popular, computer-dependent, time-oriented methodologies such as remote sensing and GIS (Geographic Information System) technology. Remote sensing technology provides a synoptic perspective that aids in mapping the dynamics of surface water bodies at regional and global scales. With this study, we can gather information on seasonal changes over time in the Mainpuri District because variations in the distribution of surface water have an impact on the hydrogeology and physical surroundings of the area. Mainpuri District has a Ramsar site named Saman Bird Sanctuary, which is home to a significant number of migratory and local migratory birds, primarily Sarus cranes. The research demonstrated that the area\'s abundance of waterbodies benefits biodiversity by giving migratory birds enough food and shelter. Shrinkage and expansion in surface water bodies are useful for determining the ecology of the region. In the current work, pre-monsoon and post-monsoon multi-temporal Landsat satellite images have been used to monitor spatiotemporal changes in the water bodies’ surface area in the Mainpuri District of Uttar Pradesh, India. In the north-west to southeast of the district, waterbodies\' temporal changes show a 60% sharp decline in the number of waterbodies from 1992 to 2022.
Introduction
I. INTRODUCTION
Water bodies are an essential part of the Earth's system. Understanding the distribution of water resources is the first stage in water resource management and use. Human activity and climate change may significantly alter water supplies. Despite the difficulty of conducting field surveys of bodies of water because of costs and logistics, satellite remote sensing data provide useful information for monitoring water resources in many places. The mapping and possible monitoring of Earth's surface water resources have long been aided by remote sensing technology. For managing water resources, timely surface water monitoring and data on surface water dynamics are important. So, Researchers came up with different water indexing approaches for extracting water bodies from remotely sensed data. Mainpuri District is in the Uttar Pradesh state of India's Agra division. Mainpuri has over a dozen wetlands, and a bird sanctuary is home to the largest Sarus crane population in the country. A seasonal oxbow lake named Saman Bird Sanctuary is in the Ganges floodplain and was notified in 1990 in order to protect the large population of sarus cranes in the area. It has been designated as a protected Ramsar site since 2019. Wetlands and agricultural fields contribute to the healthy population of Sarus and other wetland birds.
Mainpuri is the favorite place of local and migratory birds. This study's major objective is to keep monitor of how water bodies change through Remote sensing and GIS (Geographic Information systems). These together are extremely significant for time-series analysis of extracted waterbodies using a number of Landsat satellite images acquired at various time periods. In recent years, there hasn't been any research on the area's spatial and temporal evolution. As a result, remote sensing should be used to study the changes in waterbodies in Mainpuri, and GIS is crucial for analyzing the existing condition.
II. STUDY AREA
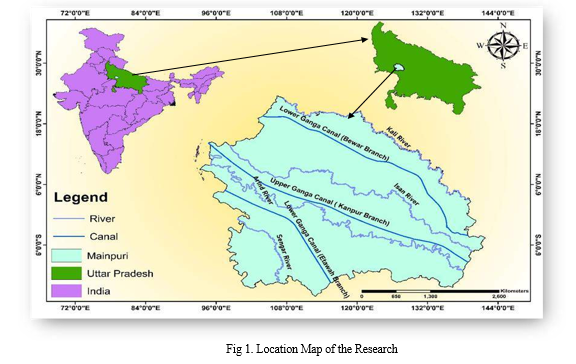
North latitude 26° 53' to 27° 31' and East longitude 78° 27' to 79° 26' are the geographic coordinates for Mainpuri. The district covers 2760 square kilometers. Mainpuri is covered by Etah district from the north, Farrukkhabad and Kannauj from the east, Etawa district from the south, and Firozabad and Etah from the west. There are six tehsils, namely Mainpuri, Bhongaon, Karhal, Kishni, Kurawali, and Ghiror, in the district. As per the 2011 census, the district has a total population of 1868,530.
Mainpuri has more than a dozen wetlands and a bird sanctuary, home to the largest Sarus Crane habitat in the country. Mainpuri is a favorite spot for local and migratory birds from North Asia and Central Asia. Wetlands and agricultural land contribute to healthy populations of Sarus and other wetland birds. According to district statistical data (2010–11), the Mainpuri district cultivated approximately 70% of its total geographic area. Mainpuri district still has 2.45% of cultivable land. Only 0.64% of the area is covered by forest cover, which is significantly lower than the state average and environmental standard.

III. DATA COLLECTION
A. Survey of India (SOI) Toposheet maps
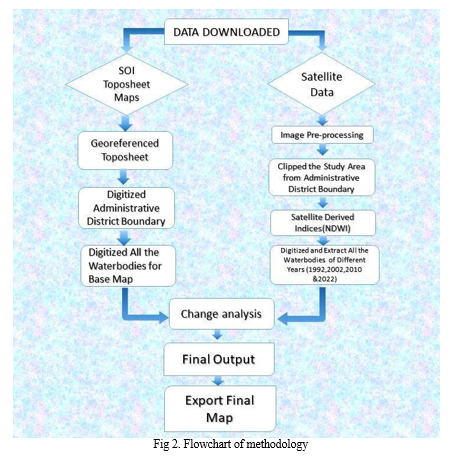
The toposheet provides the physical features of the study area, like rivers, roads, canals, highways, railway lines, settlements, ponds, swamps, and other water bodies, etc. Toposheets also provide information regarding the latitude and longitude of the area on a suitable projection for that area. The primary database has been developed with the help of SOI topographic maps on a 1:50,000 scale. The toposheets that have been used for the present study are listed below in Table 1.
Table I. Toposheets of the study area
|
S. No. |
Toposheet number |
|
1 |
54I/11 |
|
2 |
54I/12 |
|
3 |
54I/15 |
|
4 |
54I/16 |
|
5 |
54J/13 |
|
6 |
54M/3 |
|
7 |
54M/4 |
|
8 |
54M/7 |
|
9 |
54M/8 |
|
10 |
54N/1 |
|
11 |
54N/5 |
B. Satellite Images
Pre-monsoon, or the dry season (March to May), and post-monsoon, or the wet season (October to December), data have been collected from USGS (United States Geological Survey) Earth Explorer to determine the variations of the water bodies in the study area. Data from multi-spectral Landsat images was gathered between 1992 to 2022. Thematic Mapper (TM) images from 1992 and 2010, Enhance Thematic Mapper (ETM+), Operational Land Imager (OLI), and Thermal Infrared Sensor (TIRS) images from 2002 and 2022 are used to extract data and information about Surface Water bodies. Table No. 2 lists the data from Landsat satellite images that have helped identify seasonal variations.
table II
Satellite images with specific details used in study.
|
Date/Year |
Path/Row |
Satellite |
Bands |
Wavelength (micrometers) |
Spatial Resolution |
|
26/04/1992 |
145/041 |
LANDSAT - |
BAND1(B) |
0.45-0.52 |
|
|
|
|
5 (TM) |
BAND 2(G) |
0.52-0.60 |
|
|
|
|
|
BAND3(R) |
0.63-0.69 |
|
|
|
|
|
BAND4(NIR) |
0.76-0.90 |
|
|
29/03/2002 |
145/041 |
LANDSAT- |
BAND 1(B) |
0.45-0.52 |
|
|
23/10/2002 |
|
7(ETM+) |
BAND 2(G) |
0.52-0.60 |
|
|
|
|
|
BAND 3(R) |
0.63-0.69 |
|
|
|
|
|
BAND4(NIR) |
0.77-0.90 |
|
|
27/03/2010 21/10/2010 |
145/041 |
LANDSAT - 5 (TM) |
BAND 1(B) BAND 2(G) |
0.45-0.52 0.52-0.60 |
30 (m) |
|
|
|
|
BAND 3(R) |
0.63-0.69 |
|
|
|
|
|
BAND4(NIR) |
0.76-0.90 |
|
|
28/03/2022 |
145/041 |
LANDSAT-9 |
BAND 2(B) |
0.45-0.51 |
|
|
30/10/2022 |
|
(OLI and |
BAND 3(G) |
0.53-0.59 |
|
|
|
|
TIRS) |
BAND 4(R) |
0.64-0.67 |
|
|
|
|
|
BAND5(NIR) |
0.85-0.88 |
|
IV. METHODOLOGY
Toposheets are used to create a base map of the area. For base map creation, we have digitized the district boundary, rivers, canals, water bodies, and wetlands of the area. For identifying the changes in the water bodies, pre-monsoon season (March– May) and post-monsoon season (October–December) data have been collected from USGS (United States Geological Survey) Earth Explorer of different years. The surface waterbodies and wetlands in the study region are detected using the NDWI (Normalized Difference Water Index) and NDVI (Normalized difference vegetation Index) which is helpful in the differentiation of land and water features.
A. NDWI (Normalized Difference Water Index)
A popular measure for identifying and defining locations with high soil moisture levels and water-like features is the Normalized Difference Water measure (NDWI). The NDWI calculation formula is as follows:

Where NIR and GREEN stand for the spectral reflectance measurements made in the electromagnetic spectrum's near- infrared and green regions, respectively. The maximum moisture is indicated by an NDWI value close to +1, according to concept.
B. NDVI (Normalized Difference Vegetation Index)
The Normalized Difference Vegetation Index (NDVI) is the most well-known and often used index to identify green vegetation from multispectral remote sensing data. To pinpoint specific plant species or vegetation types that are indicative of wetlands, remote sensing data is routinely used.
The NDVI calculation formula is as follows:

where NIR and RED stand for the spectral reflectance measurements made in the electromagnetic spectrum's near-infrared and red regions, respectively. The theoretical range of NDVI values is from -1 to +1. No vegetation is indicated by an NDVI value that is negative or close to zero, whereas the largest amount of greenery is indicated by an NDVI value that is close to +1.

V. RESULLT AND DISCUSSION
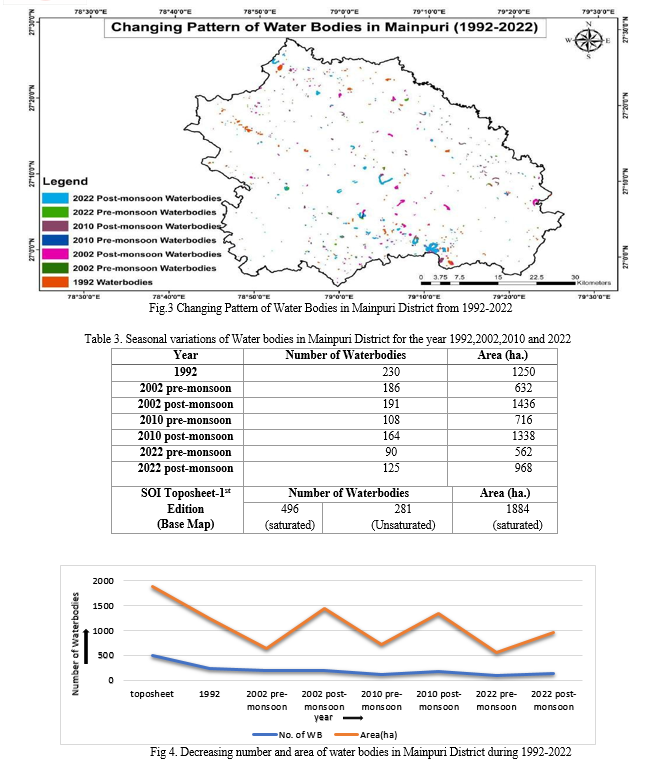
All the small and large water bodies are identified in the study area. The map given below shows the changes in the waterbodies from 1992 to 2022 in the Mainpuri District. The number and surface area of water bodies are shown in the following table and map in detail. The statistical results are shown in Table 3.
The spatial pattern of water surface change in Mainpuri for the years 1992, 2002, 2010, and 2022 is shown in figure 3. According to table 3, it is revealed that the water surface area was about 1884 hectares according to the SOI toposheet: 1250 hectares in 1992, 1436 hectares in 2002 (post-monsoon), 1338 hectares in 2010 (post-monsoon), and 968 hectares in 2022 (post- monsoon). It is revealed that, from 1992 to 2010, most of the waterbodies in the north-west part are over, and Mainpuri continuously loses its surface water in the south-east part.
Finally, in 2022, Mainpuri will have lost its maximum water surface. Although the surface area of waterbodies is increasing after the monsoon period, but the number of waterbodies is reducing with time. The area of water bodies is changing rapidly due to various factors over time.

Conclusion
Till date, very little research has been done in Mainpuri District. This study shows that the waterbodies, which are primarily located in the study area’s agricultural fields, play a significant role in the lives of rural residents and wildlife. The study proved that the presence of several waterbodies makes the area favorable for wildlife by providing migrating birds with enough food and shelter. The local water bodies contributed to the Saman Bird Sanctuary’s designation as a Ramsar site. Saman Bird Sanctuary provides a safe habitat for several rare and threatened species, such as the Sarus Crane and Greater Spotted Eagle. Based on the findings, it can be stated that the number of waterbodies (pre-monsoon) has decreased by 60% between 1992 and 2022, with the majority of the waterbodies being lost and the remainder reducing in surface water area, particularly natural small water features. Seasonal fluctuations can also be detected in study locations where small bodies of water have changed over time. After the monsoon, expansion in the area of surface water bodies is the main cause of attracting migratory birds in the Mainpuri District. The population of migrating birds in the area, for instance, could suffer if there are fewer water bodies in the area. The loss of several native aquatic plants, herbs, and shrubs; the extinction of numerous domesticated and wild plant species; the reduction of soil’s essential nutrients; and the loss of natural water reservoirs and the advantages they provide.
References
[1] Alsdorf, D.E.; Lettenmaier, D.P, “Tracking fresh water from space”. Science, 301(5639), pp.1491-1494. 2003. [2] Mainpuri District, “District Ground Water Brochure”, UP. Mainpuri: cgwb. 2012-2013 [3] McFEETERS, S. K., “The use of the Normalized Difference Water Index (NDWI) in the delineation of open water features”.International Journal of Remote Sensing , pp.1425-1432. 1996 [4] Scanlon, B. R., “Global impacts of conversions from natural to agricultural ecosystems on water resources: Quantity versus quality”. Water Resource Research . 2007. [5] Saman Bird Sanctuary. Ramsar Sites Information Service. 2020 Available: https://rsis.ramsar.org/ris/2413/ [6] Al Sghair, F. G., “Remote sensing and GIS for wetland vegetation study”. University of Glasgow. 2013 [7] Chandra, K. B., “Faunal Diversity in Ramsar Wetlands of India. Kolkata: Govt. of India ” , 2021 [8] Charles G. O’Hara, C. M., “Resmote Sensing And Geospatial Application For Wetland Mapping, Assessment, And Mitigation”. 2002 [9] Harmanpreet Kaur Sekhon, A. K. “Creation of Inventory of Water Bodies in Hoshiarpur District using Remote Sensing and GIS”,. IJARSGG Vol.4, pp.32-41.
Copyright
Copyright © 2023 Harshita Kudeshiya, Monowar Alam Khalid, Sudhakar Shukla. This is an open access article distributed under the Creative Commons Attribution License, which permits unrestricted use, distribution, and reproduction in any medium, provided the original work is properly cited.

Download Paper
Paper Id : IJRASET54898
Publish Date : 2023-07-21
ISSN : 2321-9653
Publisher Name : IJRASET
DOI Link : Click Here
 Submit Paper Online

