Ijraset Journal For Research in Applied Science and Engineering Technology
- Home / Ijraset
- On This Page
- Abstract
- Introduction
- Conclusion
- References
- Copyright
Monitoring of Traffic Flow Parameters Using Geospatial Technology for Effective Traffic Management around Maiduguri Central Business District
Authors: Bukar A. G., Shettima M., Kunduri A. M., Sambo G. H.
DOI Link: https://doi.org/10.22214/ijraset.2025.66692
Certificate: View Certificate
Abstract
The ever-increasing traffic flow has become one of the most critical challenges faced by municipalities and governments worldwide. This paper intends to ascertain the traffic flow parameters using geospatial technology for effective traffic management around the Central Business District (CBD) in Maiduguri to provide solutions to the menace of traffic congestion. Data were obtained from primary and secondary sources. The primary data were obtained from Unmanned Aerial Vehicles (UAV) and Global Positioning System (GPS). UAVs were utilized to record (videography) the traffic flow of the chosen traffic corridors during the peak hours (morning, 7:00 to 9:00 am and evening, 4:00 to 6:00 pm). The classification of the vehicles and conversion to a common standard format was done in Microsoft Excel before being carried forward for GIS Operations in ArcGIS 10.7 Environment to achieve geospatial spatial analysis and mapping of the field data. The results show that Tricycles dominated the traffic during the peak periods, followed by Cars. This indicates that the Tricycle has been the overriding and preferred means of public transport in Maiduguri since 2009 after the ban placed on motorcycles. The also reveals that no matter the direction of movement in all the approach arms, Tricycles override all other means of transportation. The results also show that all the Trio Intersections were observed to have high traffic volume on all their trajectory arms, with only the Tabacco intersection having medium traffic volume during the morning peak period. Given the above findings, the study recommended that the Government to consider the construction of a flyover, particularly at the post office intersection.
Introduction
I. INTRODUCTION
The ever-increasing traffic flow has become one of the most critical challenges faced by municipalities and governments worldwide. This problem is further magnified particularly at urban intersections within Central Business Districts (CBD) where a high number of emerging conflict points, road safety issues and capacity constraints.
Traffic flow is an important microscopic characteristic in transportation management which predicts traffic flow parameters (Kong and Guo, 2016; Haryadi and Narendra, 2016). Over the years manual counts have been used in traffic engineering for traffic flow studies. However, due to advancements in technology, traffic flow data can now be collected and analysed effectively and efficiently by Geospatial Technology such as Closed-Circuit Television (CCTV), unmanned aerial vehicles (UAV) Remote Sensing and Geographic Information Systems (Butil? & Boboc, 2022; Fedorov, et al. 2019). The vehicle trajectory data acquired from UAV video (one of the geospatial systems) for analysis of traffic flow parameters for urban uncontrolled intersections is now one of the latest advances in traffic studies (Kim., E.J. et al 2019). Similarly, Taylor et al. (2015) reported that Video and recently developed automatic data-extraction techniques have the potential to provide cheap, quick, easy, and accurate methods of investigating traffic systems.
The Traffic Management system within the GIS framework is an open and comprehensive system engaged in control, management and decision-making. It can compute queries and display the corresponding results on a map (Barman et al., 2019).
The Maiduguri Central Business District is witnessing a progressive reduction in traffic speed, increased traffic congestion and conflicts during peak periods, and sometimes even at off-peak periods. The traffic condition of the CBD is also heterogeneous and un-signalized.
This situation causes serious traffic issues which are difficult to ascertain using manual count since all the trajectory arms cannot be viewed at a time. Hence, in the quest for advanced modern traffic monitoring technology (Geospatial technology), the traffic situations can effectively display different levels of congestion, in terms of identification and interpolation of vehicular volume along digital traffic corridors, as well as its behaviour within the CBD. Therefore, this study intends to use this novel technology to ascertain the traffic flow parameters for Effective Traffic Management around the CBD in Maiduguri to proffer solutions to the menace of traffic congestion.
II. THE STUDY AREA AND METHODOLOGY
A. Study Area
The ever-increasing traffic flow has become one of the most critical challenges faced by municipalities and governments worldwide. This problem is further magnified particularly at urban intersections within Central Business Districts (CBD) where a high number of emerging conflict points, road safety issues and capacity constraints.
The Maiduguri Central Business District is witnessing a progressive reduction in traffic speed, increased traffic congestion and conflicts Maiduguri Central Business District is located in Maiduguri Metropolitan Council of Borno State in the North-Eastern region of Nigeria. Maiduguri is located between latitudes 11° 42’00’’N and 12° 00’ 00”N and from longitudes 12° 54’ 00” to 13°14’ 00”E (Mayomi and Jimme, 2014). They further claimed that Maiduguri covered an area of 543 km2. The city is bounded in the north by Jere LGA, in the west and south by Konduga LGA, to the east by Mafa LGA.
The city receives rainfall from June to September. However, in rainy years, the city records rainfall earlier than June and later than September. But in some years rain starts as early as April and lapses into October (Mayomi and Jimme, 2014). The rainfall pattern in the area generally shows spatial and temporal variability and has been characterized by a single maximum, with a peak around August. In the dry period, the temperature over the area may go up to 48°C. During harmattan, it may be as low as 15°C. It has a mean annual maximum temperature of 35°C with a mean temperature ranging between 30° and 40°C. The months of March and April are usually the hottest months, while November and January are the cold and dry periods of harmattan. Maiduguri is drained by the Rivers Ngadda and Ngaddabul which acts as a tributary to the Ngadda and the vegetation is similar to Sahel Savannah which is surrounded by shrubby vegetation interspersed with tall tree woodland.
The study area comprised all the trio intersections around the Central Business District (CBD) (El-kanemi, Post Office and Tobacco intersections) each with it four approach arms. El-kanemi intersection consists of Mogaram Road, Shehu Sanda Kura Road North Bound as well as Ahmadu Bello Way East and West Bounds. Post Office intersection encompasses Kano/Jos Road, Ahmadu Bello Way and Shehu Laminu Way North and South Bounds. Tobacco comprises Yerima Road, Galadima Kyari Drive and Shehu Sanda Kura Road North and South Bounds.
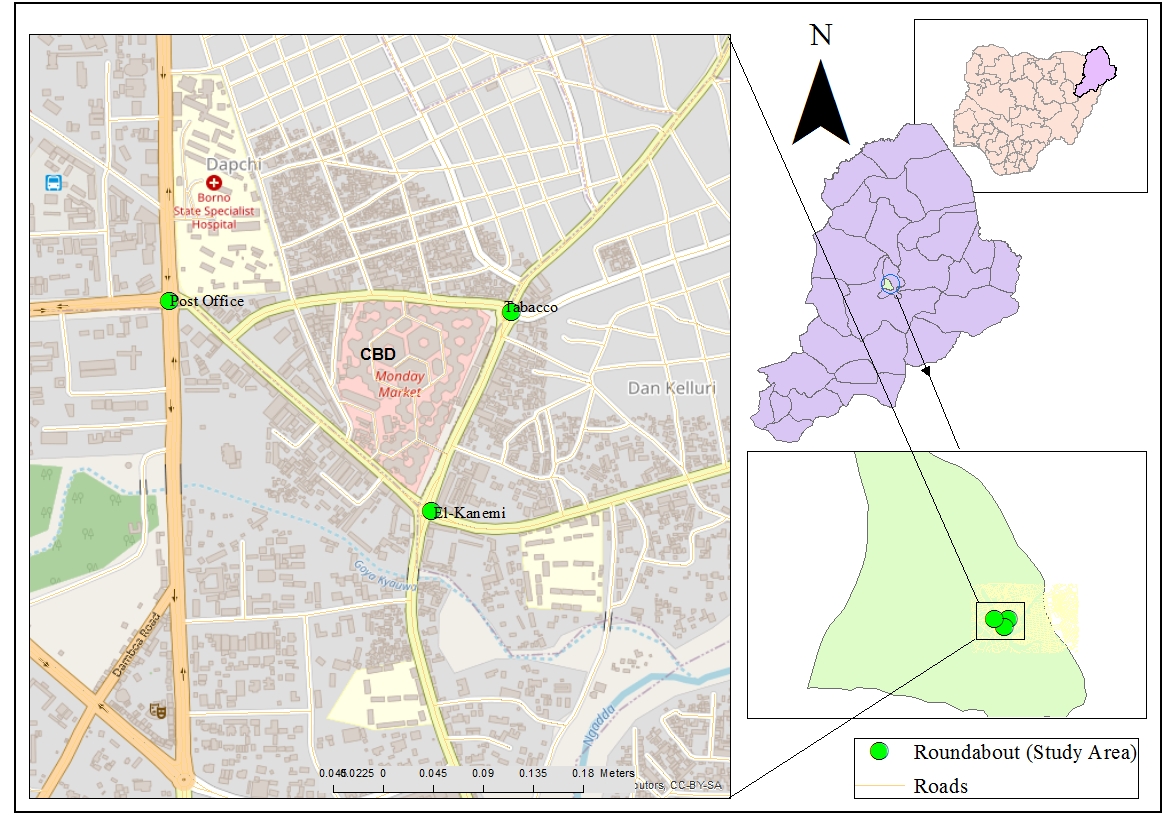
Figure 1. The Study Area
Source: GIS LAB, Department Geography, University of Maiduguri (2023)
B. Methodology
1) Materials and Methods
Unmanned Aerial Vehicles (UAV) were utilized to record the classified automatic counts (videography) of traffic flow of the chosen traffic corridors during the peak hours (morning, and evening) within the study area. The peak hours were chosen as a result of the limited battery life of UAVs, because the traffic cannot be monitored for the whole day. It was therefore decided that the Morning and evening peak 2-hour periods be recorded (7:00 a.m. – 9:00 a.m. and 4 p.m. – 6 p.m.). The UAV uses 4 pieces of DJI Phantom-4, each with a maximum battery life of about 30 minutes (or 2 hours for the 4 sets). Due to the security issues, before the UAV was in flight, the researcher obtained authorization from security personnel to avoid any sort of problem.
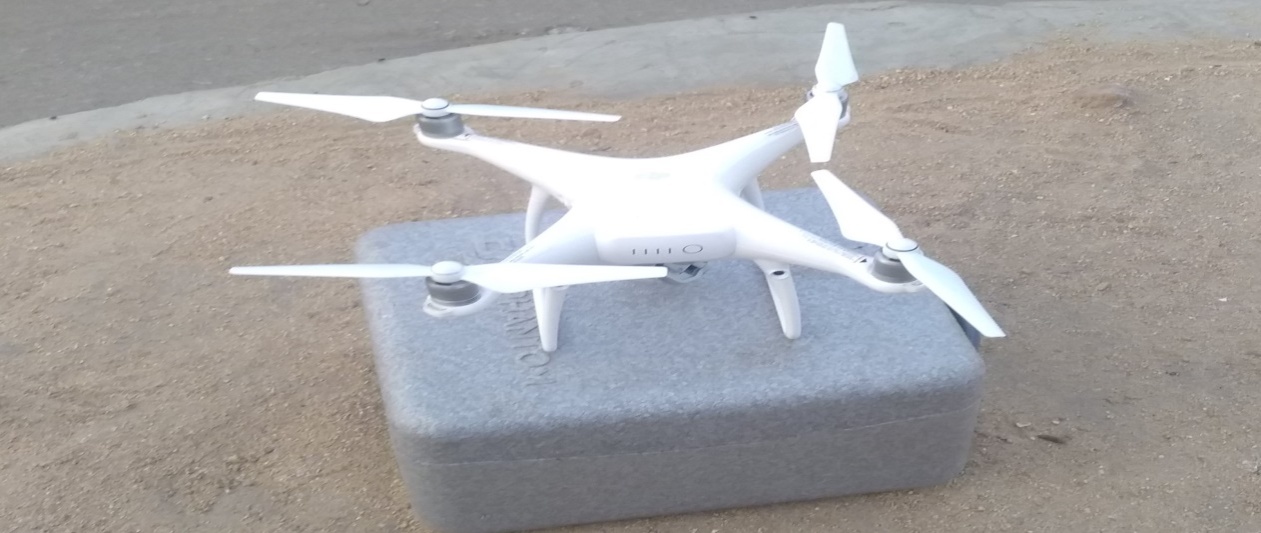
Plate 1: DJI phantom 4
Data Acquired
Table .1: Datasets used for the Study
|
SN |
Type of Data |
Temporal Resolution |
Spatial Resolution |
Date Available |
Source(s) |
|
Earth Observation Data UAV |
|||||
|
1. |
UAV Images |
Twice per day |
Very High |
2022 |
|
|
2. |
GeoEye |
16-day |
0.35 m |
2023 |
Digital Imagine |
|
4. |
Global Positioning System (GPS) Point Data |
Instantaneous |
3 m |
2023 |
Garmin GPS Pro |
Source: Researcher, 2023
2) Data Processing and Analysis
The data processing method for the videos acquired by the UAV has been realized by manual counts, which were conducted to determine the traffic Composition, directional flow pattern and vehicle classification. Five vehicle types were detected from the UAV video, which includes cars, tricycles, buses, trucks and bicycles. Since the traffic is heterogeneous, it's common to standardize the vehicle into equivalent homogenous traffic to obtain the volume. Hence, Passenger Car Equivalents (PCE) or Passenger Car Units (PCU) factors are used to convert counts of vehicles into volume (See Table 2). Passenger car units were multiplied by the traffic composition to obtain the volume as obtained in Equation i.
TV = TC x PCU ……………..i.
Where: TV = Traffic Volume; TC = Traffic Composition; PCU =Passenger Car Unit
Table 2: PCE/PCU Highway Capacity Manual
|
Classification |
Standard Equivalent |
|
Tricycle |
0.4 |
|
Car |
1 |
|
Bicycle |
0.1 |
|
Bus |
1 |
|
Trucks |
3 |
Source: Highway Capacity Manual (2010)
3) Method of Data Analysis
The classification of the vehicles and conversion to a common standard format was done in Microsoft Excel before carried forward for GIS Operations in ArcGIS 10.7 Environment to achieve geospatial mapping of the field data collected from UAV. To better reflect the differences and achieve the study's objectives, traffic compositions, including the corresponding locations (Geographical coordinates) were converted to traffic volume using PCU factors.
All the results in the Excel were later imported into ArcGIS Software – ArcGIS 10.7 was used to digitize the Maiduguri Road network map using GeoEye High-Resolution satellite image with 0.35 spatial resolution. The locations of selected corridors were also plotted as point features using the Spatial Analyst tools and the volume-to-points feature from the attributes table to analyze traffic flow parameters (traffic flow density and directional flow pattern) at the trio intersections.
Traffic Flow Density
To determine traffic flow density, the roads connecting all the trio intersections were segmented and buffered by 10 meters. Then, traffic volume was interpolated to depict the density using the Spatial Analyst tool of ArcGIS 10.7.
Directional Flow Pattern
The directional flow pattern was determined using a traffic flow cartogram. The cartogram was produced based on directional flow pattern volumes. The volumes were then converted to a map able scale, utilizing a scale of 2 meters to 100 Vph and used to create the cartogram through a 10m buffering roads and assigned distinct colors to depict the directional flow pattern.
III. RESULTS AND DISCUSSION
The traffic composition was extracted from UAV at the Trio intersections for the periods of observations per day, in the Morning between 7:00 am and 9:00 am and in the Evening between 4:00 pm and 6:00 pm, being the peak periods for high traffic flow around the Maiduguri CBD. However, the traffic in the area mainly consists of Tricycles, Cars, Buses, Bicycles and Trucks. This observation is in agreement with research findings by Shevtsova and Burlutskaya (2021).
A. Average Pattern of Traffic Composition for the Trio Intersections
Geospatially, the average pattern of traffic composition for the Trio Intersections during the morning and evening peak periods are depicted in the Figures 2 and 3 respectively. The maps shown the spatial composition at different intensity of the Traffics during the peak hours in the CBD. Geostatistically, at different locations and histogram results show the overriding and preferred means of public transport (Tricycle – Green) throughout the peak periods. This also indicates that no matter the direction of movement in all the approach arms, Tricycles override all other means of transportation.
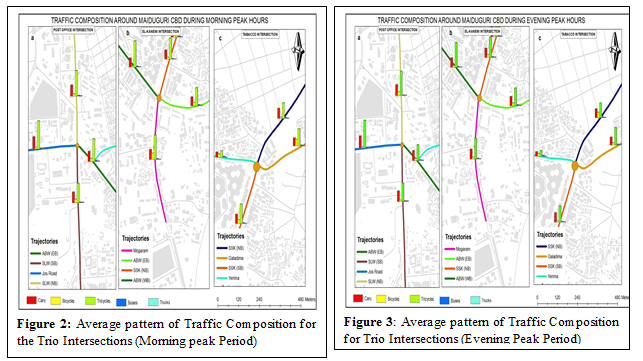
The traffic composition generated from the Trio Intersections showed that Tricycles dominated the traffic for the peak periods, followed by Cars as depicted in Figures 2 and 3. Due to its size, flexibility, affordability, comfortability and dominant source of public transport. The dominance of Tricycles among the types of vehicles recorded shows an emerging trend in the use of Tricycles for public transportation in cities, especially after the ban on motorcycles in 2009 due to the Boko Haram insurgency in Maiduguri as also observed in Maiduguri by Balami & Sambo, (2019). Similar findings were also revealed by Chowdhury and Marzan (2017), where Sylhet City found that most of the vehicular types recorded at the selected junctions were auto rickshaws (Tricycles), with an average of 46%. This showed the growing tendency towards the use of Tricycles for easy and low-cost intra-urban transportation (Isaac 2013). Similarly, Gunn and Ohwo (2022) opined that Tricycle and cars generate more traffic across all the traffic corridors in Yenagoa.
B. Traffic Flow Density around Maiduguri Central Business District
The first vehicle arrived in Maiduguri in 1904 (Waziri, 1995), marking the beginning of a steady increase in traffic volume. According to Max Lock (1976), approximately 11.9% of the population in Maiduguri owned a form of modern transportation. Since then, the number of vehicles has continued to proliferate in Maiduguri, and the Central Business District (CBD) has been observed to attract and generate more traffic. Thus, Figures 4 and 5, show the traffic volume around Maiduguri Central Business District.
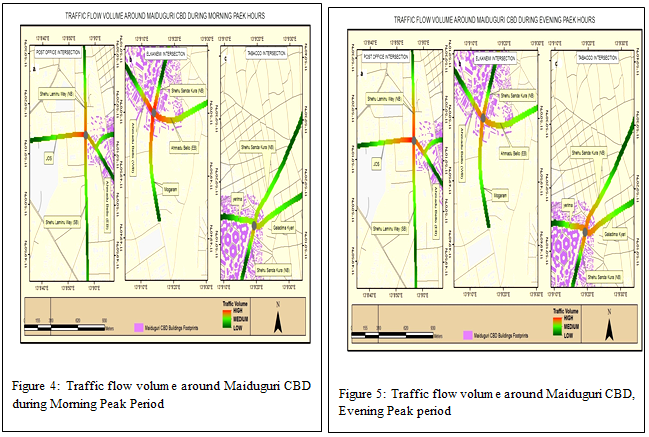
The results revealed that at Post Office intersection, Kano/Jos Road had the highest traffic volume during the morning peak period, which is expected due to commute to work, schools, and businesses, as well as the location of the State Secretariat offices. Following this were Shehu Laminu Way North Bound and Shehu Laminu Way South Bound, as they generate traffic from the core of the town while Ahmadu Bello Way East Bound had the lowest traffic volume, as clearly depicted in Figure 4a.
El-Kanemi Intersection was observed to have the highest traffic volume on all its trajectory arms, with Mogaram Road having slightly higher traffic than the rest as shown in Figure 4b. This pattern can be attributed to the opening hours of the Monday Market, which puts a high volume of traffic on the road during that time.
Tobacco intersection had the lowest traffic volume during the morning peak period (Figure 4c), which is also expected since the area has no major schools or government parastatals that generate traffic. Moreover, most residents in the area use bicycles, which do not contribute significantly to traffic volume. These findings are consistent with a study conducted by Osoba (2012), who reported that peak-hour traffic flow indicates high traffic intensity in the early morning in the Central Business District of Lagos, Nigeria.
The traffic volume during the Evening Peak period reveals that the traffic volume at Post Office intersection Figure 5a, is very high, along all its trajectory arms. This is because most people are returning home from work, school, recreational activities, etc.
Meanwhile, the traffic volume at El-Kanemi and Tobacco intersections (figures 5b and 5c respectively), are also relatively high. This is because the evening peak period is a rush hour, and the market closure during this time may contribute to the increased traffic volume around the Central Business District (CBD).
C. Directional Flow Pattern of Traffic around Maiduguri CBD
Figures 6 and 7 depict the directional flow pattern of traffic for the three peak periods around the Maiduguri Central Business District. The Figures displayed the directional flow pattern of Traffic during morning and evening peak periods, with their respective in-bound and out-bound.
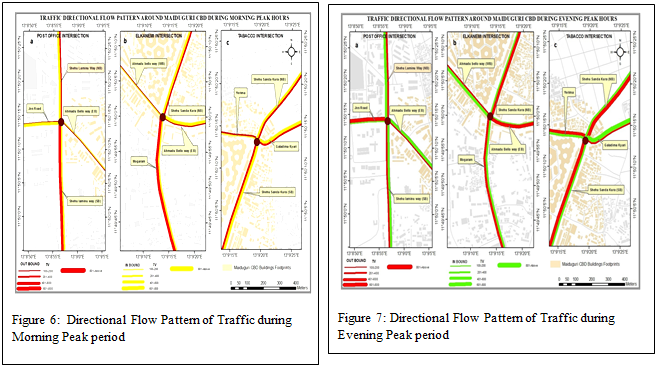
The results revealed that all the Trio Intersections exhibited different flow patterns. During the morning peak period, the traffic inflow recorded at the Post Office intersection along Kano/Jos and Shehu Laminu Way North Bound was between 201 and 600 vehicles per hour (Vph), while the outflow recorded along Shehu Laminu Way South Bound was 400 – 600 Vph (Figure 6a). This is likely because this trajectory arm leads to the university, resulting in more people leaving the area in the morning. Most of the traffic flow on the Kano/Jos trajectory and Shehu Laminu Way Northbound is directed towards Shehu Laminu Way Southbound.
At El-Kanemi Intersection, the traffic inflow recorded during the morning peak period along Shehu Sanda Kura North Bound and Ahmadu Bello East Bound was 200 – 600 Vph, while the highest traffic outflow recorded was along the Mogaram Road (400 – 600 Vph), as shown in Figure 6b.Similarly, the Tobacco intersection revealed a traffic inflow of 200 – 600 Vph along Shehu Sanda Kura North and South Bounds and Galadima Kyari Drive, while the outflow recorded along all trajectory arms was 200 – 400 Vph, as depicted in Figure 6c. These outcomes were likely due to the opening of school hours, workplaces, and businesses in the area during the morning hours. During the evening peak period, the directional flow pattern generated at the Trio Intersections revealed that, at the Post Office intersection, the traffic inflow recorded along Shehu Laminu Way North and South Bounds and Ahmadu Bello Way East Bound ranged from 200 to 600 vehicles per hour (Vph),
while Jos Road exhibited a high traffic outflow of 800 – 900 Vph, as shown in Figure 7a. This is likely because, during the evening, most of the traffic along Shehu Sanda Kura North and South Bounds and Ahmadu Bello Way were directed towards Jos Road. El-Kanemi Intersection in the evening revealed high traffic inflow along Ahmadu Bello Way West Bound and the Mogaram Road, ranging from 400 to 600 Vph, while Shehu Sanda Kura North Bound and Ahmadu Bello East Bound yielded high outflow, ranging from 200 to 600 Vph, as shown in Figure 7b.
Similarly, Tobacco intersection showed high outflow along its three trajectory arms (Shehu Sanda Kura North and South Bounds and Yerima Road), ranging from 200 to 800 Vph, while high inflow was recorded along Galadima Kyari Drive, ranging from 400 to 800 Vph, as shown in Figure 7c.
Conclusion
This paper has demonstrated that traffic can be effectively and efficiently monitored by geospatial technology. It has provided insight into the traffic situations, revealing that intersections in the cities are the most congested areas. The study has also shown that GIS can handle voluminous data, and the results presented in maps are easy to interpret and understand for multiple stakeholders. Based on the findings, it can be concluded that tricycles are the preferred means of public transport around the CBD in Maiduguri due to their size, flexibility, affordability, and comfort. The study found that all intersections experience high traffic volume during peak periods, attributed to the opening and closing hours of the Monday Market, Musa Usman Secretariat, schools and other attractions which puts a high volume of traffic on the road during that time, making the area prone to congestion. Given the above findings we wish to recommend the following: - 1) Government should consider the construction of flyover particularly at the Post Office Intersection. 2) Government should provide ample parking space along the road shoulders especially along Ahmadu Bello Way and Mogaram Road for loading and unloading passengers by the tricycle riders. 3) Enforcement of traffic rules and regulations by the concerns authorities
References
[1] Balami, A.D., and Sambo, G., (2019). Road Traffic Accidents, Near-Misses and their Associated Factors among Commercial Tricycle Drivers in a Nigerian City. Annals of Biostatistics & Biometric Applications. DOI: 10.33552/ABBA.2019.02.000539. ISSN: 2641-6336. https://www.academia.edu/57920021/Road_Traffic_Accidents_Near_Misses_and_their_Associated_Factors_among_Commercial_Tricycle_Drivers_in_a_Nigerian_City [2] Barman, S., Sarkar, A., Roy, R. K., Saha, S., Rajak, K., and Sarkar, J. (2019). An Approach to GIS-based Traffic Information System Using Spatial Oracle. International Journal of Spatial Temporal and Multimedia Information Systems, 1(3), Pp 253. https://doi.org/10.1504/ijstmis.2019.103559 [3] Barman, S., Sarkar, A.,Roy, R.K., Saha, S., Rajak, K. and Sarkar, J. (2019) \'An approach to GIS-based traffic information system using Spatial Oracle,\' International Journal of Spatial Temporal and Multimedia Information Systems, 1(3), p. 253. https://doi.org/10.1504/ijstmis.2019.103559. [4] Butil? EV, and Boboc RG. Urban Traffic Monitoring and Analysis Using Unmanned Aerial Vehicles (UAVs): A Systematic Literature Review. Remote Sensing. 2022; 14(3):620. https://doi.org/10.3390/rs14030620 [5] Chowdhury, T. D and Marzan, K. (2017). Estimating traffic delay of motorized vehicles and identifying responsible causes at five unsignalized intersection of Sylhet city. International Conference on Engineering Research, Innovation and Education, 13 pp.057 [6] Fedorov, A., Nikolskaia, K., and Ivanov, S. (2019). Traffic flow estimation with data from a video surveillance camera. J Big Data 6, 73. https://doi.org/10.1186/s40537-019-0234-z [7] Gunn, E. O., and Ohwo, O. (2022). Analysis of Traffic Flow and Management Strategies in Yenagoa, Nigeria. Wilberforce Journal of the Social Sciences, 7(1), pp. 48–66. https://doi.org/10.36108/wjss/2202.70.0140 [8] Haryadi B, and Narendra A (2016) Vehicle headway distribution models on two-lane two-way undivided roads. Int J Innov Res Adv Eng 07(3). Pp. 2349–2763 [9] Kim, E., Park, H., Ham, S., Kho, S., and Kim, D. (2019). Extracting vehicle trajectories using unmanned aerial vehicles in congested traffic conditions. Journal of Advanced Transportation, 2019, Pp. 1–16. https://doi.org/10.1155/2019/9060797 [10] Kong, D. and Guo, X. (2016). Analyzing the impact of trucks on traffic flow based on an improved cellular automaton model. Discrete Dynamics in Nature and Society, pp 1–14. https://doi:10.1155/2016/1236846 [11] Max Lock, (1976) Maiduguri Survey and Planning Report for the North eastern state Government in Nigeria.part 5, Ch 2, item 2. [12] Mayomi, I., and Jimmie, A.M. (2014). A Decade Assessments of Maiduguri Urban Expansion (2002-2012) Geospatial Approach, Global Journal of Human-Social Science: B Geography, Geosciences Volume 14 Issue 2 Version 1.0 [13] Osoba, S. B. (2012). Appraisal of parking problems and traffic management measures in Central Business District in Lagos, Nigeria. Journal of Sustainable Development, 5(8). https://doi.org/10.5539/jsd.v5n8p105 [14] Shevtsova, A., and Burlutskaya, A. (2021). Qualitative assessment of the composition of the traffic flow. MATEC Web of Conferences, 341, 00033. https://doi.org/10.1051/matecconf/202134100033 [15] Taylor, S.J, Bogolan, R. and Devault, M. (2015). Introduction to Qualitative Research Methods: A Guidebook and Research. 4th Edition, John Wiley and Sons, London UK. [16] Waziri, M. (1995) Trip Generation in public Transportation System in Maiduguri: Unpublished M.Sc Dissertation, Geography Department, University of Maiduguri.
Copyright
Copyright © 2025 Bukar A. G., Shettima M., Kunduri A. M., Sambo G. H.. This is an open access article distributed under the Creative Commons Attribution License, which permits unrestricted use, distribution, and reproduction in any medium, provided the original work is properly cited.

Download Paper
Paper Id : IJRASET66692
Publish Date : 2025-01-26
ISSN : 2321-9653
Publisher Name : IJRASET
DOI Link : Click Here
 Submit Paper Online

