

Ijraset Journal For Research in Applied Science and Engineering Technology
Multi-Source Maximum Relation Mapping of Sentiments and Events Based Multi-Agent Deep Reinforcement Learning for Stock Price Trend Forecasting
Authors: Dr. Bhuvaneshwari C
DOI Link: https://doi.org/10.22214/ijraset.2025.66712
Certificate: View Certificate
Abstract
Forecasting of future stock price variations in the ever fluctuating stock exchanges has attracted greater interest from all fields because of its prominent role in the economy building of a nation. Traditional forecasting models relied on single source data for price prediction while the recent research has inclined towards the multi-source data for more reliable forecasting model. Recent studies extracted stock related events and public opinions from different sources as indicators for future stock price forecasting and have resulted in effective forecasting models. In this paper, a novel Maximum Relation Mapping Multi-Agent Deep Reinforcement Learning (MRMMA-DRL) model has been developed for efficient stock price forecasting. The novelty of this model is that it extracts multiple indicators from public tweets and news events through maximum relation mapping to enhance the interrelation among them. These interrelated indicators for stock price were extracted using Deep Weighted Extreme Learning Machine (DWELM) and Convolutional Deep Restricted Boltzmann Machine (CDRBM). Maximum relation mapped sentiments extracted by DWELM and events extracted from CDRBM which are used learning for stock price fluctuations. The stock forecasting results obtained by this novel forecasting model are highly reliable and accurate due to the interrelated indicators. Real-time datasets collected from Twitter, News website and Stock exchange for 12 months period is used for evaluation. The results highlight the efficiency of the MRMMA-DRL model which achieved promising results of 96.67% accuracy and minimized time complexity.
Introduction
I. INTRODUCTION
Stock market prediction [1] is considered as a classical problem which combines the financial analysis and computing solutions for forecasting the future price movements of shares. Stock markets or share markets have listed companies whose market shares would rise/fall based on its performance in the market and also based on multiple global factors [2]. Forecasting this rise/fall for a certain time period will help both the companies and the trade investors in selecting the shares that has high returns. Yet, in the big data era it is very challenging process since the stock markets are affected by various sources of features. For effectively solving this forecasting problem, the efficient market hypothesis (EMH) is the popular analysis process which often provides pessimistic view and states that the technical analysis of the market trends based on economic factors does not provide consistent profits to the investors [3]. However, the researchers are often disagreed with this model since the technical analysis is one approach to undermine the future stock trends. As an alternative, the Behavioral Finance Hypothesis (BFH) states that the returns from stocks are usually dependent on the market sentiments. BFH helps in designing the prediction, risk analysis and business strategies in stock markets [4]. Recent studies have also seen the increased use of multi-source attributes in stock price forecasting and have resulted in superior performance. Based on BFH, the multi-source sentiments can be defined as the prominent indicators for prediction. Compared with single source data, the multi-source data provides with multiple stock indicators that increases the accuracy and reliability of forecasting process for price fluctuations [5]. Hence the whole trading system relies on this prediction model to provide with the reliable results to make stock decisions. Data mining algorithms have been traditionally employed for the prediction tasks. Particularly, the machine learning algorithms has gained massive interest among the researchers to predict the stock price movements. Artificial neural networks (ANN) [6] and support vector machine (SVM) [7] are the two most common algorithms utilized for stock price forecasting.
The statistical models, random forests, logistic regression, k-means algorithm and many classifiers have been greatly employed for forecasting methods [8]. Some methods have used the optimization algorithms for feature selection to improve the prediction accuracy. However, most of these approaches sparsely learn the attributes and perform limited classification which results in prediction results that are lesser than expected. To overcome these limitations, advanced class of modern machine learning tools called deep learning has been widely utilized in the recent years. As deep learning algorithms are suitable for automatic feature extraction and forecasting, they have various applications in natural language processing, data processing and prediction models. Deep learning algorithms efficiently extract the features from the complex, noisy and non-linear stock market data, thus increasing the forecasting accuracy and reliability to higher ranges [9]. They are also highly supportive of the multi-source data and hence the most recent studies have started utilizing the deep learning methods.
In this paper, MRMMA-DRL based stock price forecasting model is established with DWELM and CDRBM are used for extracting the multi-source maximum relation mapping based tweet sentiments and news events, respectively. Although, previous studies have extracted stock related events and public opinions from tweets for stock price forecasting, the interrelation between the indicators is less. To enhance the interrelation between the indicators, the proposed MRMMA-DRL model employs the maximum relation mapping concept for the sentiments and events extraction. The rest of article is organized as: Related works in Section 2. Proposed MRMMA-DRL based stock price forecasting model in section 3. The results are presented in section 4 followed by the conclusion of this paper in section 5.
II. RELATED WORKS
All the related works that have been done by other researchers Stock market forecasting is a hot research topic and hence many studies were dedicated to develop effective and efficient forecasting algorithms. While many studies focused on single-source data, the recent studies were concentrated on multi-source data. Long et al. [10] proposed stock forecasting model using multi-filters neural network (MFNN) for feature extraction and classification of financial time series data with high accuracy and profitability. But this model has lesser stability and higher risks mainly due to inability to employ multi-source features. Selvamuthu et al. [11] designed a stock forecasting model using three learning algorithms for neural networks namely Levenberg-Marquardt, Scaled Conjugate Gradient and Bayesian Regularization.
This model has achieved 99.9% accuracy on tick data but the results are poor when 15-mins dataset was used. Zhang et al. [12] introduced Extended Coupled Hidden Markov Model for extracting the news events and used them to predict the stock price movements. It also resolves the data sparsity problem by using fluctuation correlations but the major drawback in this model is the lack of sentiment factors for analysing the stock movements.
Deep learning algorithms have gained greater attention in many domains and stock prediction is no exception. Lee et al. [13] proposed Deep Q-Network with a Convolutional Neural Network function approximation for interpreting the stock chart images for stock price forecasting. However, it uses only daily scale data and hence it is difficult to interpret the manageable amount of actual stocks. Long Short-Term Memory (LSTM) has been widely used for stock forecasting. Huang et al. [14] introduced sub-mode coordinate algorithm (SMC) and LSTM neural network for forecasting the stock price. The tensor integrates multi-source time series data whose dimension is reduced by SMC and the prediction is performed using LSTM. Although effective, the tensor model is hard to learn and requires extensive memory. Liu et al. [15] proposed LSTM and attention model for stock prediction based on cluster stocks and increased the forecasting accuracy. But this model has limitations in high training for network structure formation.
Liang et al. [16] developed LSTM with multi-optimal combination wavelet transform (MOCWT) to reduce the noise in the stock data for improving the forecasting accuracy. Although the wavelet transform improved the prediction with reduced fluctuations, the loss functions in the LSTM are still limited and require effective optimization. Pang et al. [17] proposed an innovative neural network through adding embedding layer and automatic encoder to deep LSTM to vectoring the data for stock forecasting using multi-stock indicators. Although efficient, this model achieves only 50 to 60% accuracy due to only partial use of text data. Kesavan et al. [18] designed stock forecasting model using LSTM with the integration of historical time series data and social media sentiments. Although the accuracy was increased to 96.95%, this model has higher time complexity and requires extensive learning process. Kelotra & Pandey [19] proposed deep convolutional long short-term memory (Deep-ConvLSTM) model for forecasting which is trained using Rider-based monarch butterfly optimization (Rider-MBO) algorithm and features clustered using Sparse-Fuzzy C-Means (Sparse-FCM). Although it provided superior performance, the complexity of this model increases with high end algorithms.
Zhang et al. [20] developed multi-instance learning (MIL) model for extracting the knowledge from social media and news articles for forecasting the stock prices. Although it provided high accurate results, they do not perform efficiently when precise classes are not defined. Previously, TMA-DRL [21] and TFMA-DRL [22] models were developed to tackle these issues through efficient deep learning and advanced sentiment and event extraction models. Irrespective of their efficiency, the forecasting approaches in literature have also highlighted their shortcomings. One important limitation is the appropriate model for completely learning the multi-source data. The other vital drawback is the limited inference of the stock price patterns and different indicators. Hence considering these limitations, the proposed approach in this paper has introduced MRMMA-DRL to extract interrelated sentiments and events and accurately forecast the future trends in the stock prices.
III. METHODOLOGY
The proposed stock market forecasting model consists of three main phases: Data collection, Extraction of sentiments and events, and learning the stock price patterns for prediction.
A. Data Collection
The proposed MRMMA-DRL model has been employed using multi-source data from three different sources. The three source data are tweets, news articles and stock index prices collected at the same duration from October 1, 2018 to September 30, 2019. This 12 month data is split into training (first 11 months) and testing data (last month data).
- Stock price data: Historical stock price data of BSE 500 and NSE 500 were gathered at BSE and NSE stock indexes for the 1year duration. It includes the beginning and ending value, highest and lowest stock values, revenue and trade bonuses of top 500 listed companies.
- News data: The stock market related news including the government announcements was extracted from https://www.moneycontrol.com. It includes the date and time of news publication, headlines and news preamble from 47,652 news articles during the specified period. The data with non-English sentences are eliminated and the evaluation dataset was formed with 10,026 news articles.
- Tweets: 176248 Public tweets were collected using 50 stock market related keywords. After initial screening, the non-English tweets are eliminated and the evaluation dataset was created with 66,542 tweets.
The collected data are pre-processed to minimize the missing values and noise problems. The stock price data are historical data and hence the noise must be removed significantly to reduce the negative impacts. The news and tweets data are applied with the NLP tools for language modelling. Apart from these processes, the tweets are processed additionally by removing the other language tweets and only the English tweets are retained.
???????B. Maximum relation mapping hierarchically interrelated news event extraction
Hierarchical news is the highly interlinked news events that contain almost every correlated factor that impact a certain event. It is correlated in such a way that the occurrence of an event possibly will trigger another related event with high probability. Integrating the story-like interrelatedness will further improve this hierarchical relatedness. In the MRMMA-DRL model, the CDRBM is used to extract the interrelated news events based on event hierarchy. The CDRBM algorithm is generated by merging the convolutional operated deep Boltzmann machine (DBM) and restricted Boltzmann machine (RBM) to form a complex but highly efficient for extracting the events from sparse news data. Employing this model enhances the maximum relation mapping between the news articles. The standard RBM extracts the events through the hidden variables relatedness and the spatial relationships are sparsely identified. Hence the DBM model was established by constructed stacking the RBM models greedily. However, both the RBM and DBM models failed to explicitly capture the relational structure of the events from news data [23]. To tackle this issue, the convolution operation as in CNN is used to construct the convolution RBM which is stacked greedily to form the CDRBM algorithm. The tree centred sentence constructions outlining the object and subjects and the essential words are associated to event representation. m(l) denote the state of l-th layer and in CDRBM m(i+1)
 is the unified layers of the RBM’s h(i)
 and DBM’s v(i+1)
 . The ascending and descending data transient is given as
pmjl+1=1ml=σimilMWijl+cjl (1)
(1)
pmil+1=1ml+1=σimjlMWijl+bil (2)
(2)
pmjl+1=1ml andpmil+1=1ml+1
 are the ascending and descending data transient models for the l-th layer with j-th class.
The convolution operation (Θ ) is applied at this stage to extract relevant features with reduced overhead similar to the CNN models. The vector form of the hidden layer is applied with the convolutional kernels and a number of feature points to calculate the inference. The inference is computed as
pmi,jl=1mlNσ2i(mlΘMW)i,j+bil,σ2 (3)
(3)
Here, the visible units are independent for each other. This allows exploring the new structure of CDRBM with two distinct feature models. These two kinds of hidden feature models contribute the covariance structure of CDRBM and improve the probabilistic pooling and penalty term objective functions. Based on this model, the output obtained from the CDRBM is given to the sentence2vec model for training.
???????C. Maximum relation mapping interrelated sentiment extraction
The major challenge in handling the tweets into multi-class classification is the class imbalance data. Although the Extreme Learning machine (ELM) and weighted ELM using optimization effectively handles this problem, the weighted ELM has certain limitations that restrict the overall performance. In weighted ELM, the sample weight matrix is physically nominated through the learning period. Similarly, the illustration competency to extract the features is limited due to the shallow architecture. This also becomes ineffective for complex and large datasets. Because of these problems, the weighted ELM also leads to limited performance on imbalanced data. To overcome these problems for tweet sentiment extraction, the deep weighted ELM (DWELM) [24] is employed in this study. The DWELM algorithm is offered as an improved loaded multilayer deep illustration network that increases the illustration ability and optimal sample weights.
The DWELM consists of several cascaded ELMs with each block using a linear ELM for data mapping. The input data mapping function for hidden layer is H=a(Wx+b) where W denotes the input weight matrix, and a(.)
 denotes the non-linear mapping function. The modified input vector for hidden layer x=a(W'H+b')
 is formed using the revised metrics W'
 and b'
 . First the training stage is performed with the output weight β regularized as
β=HTIC+DHHT-1DT (4)
(4)
Here D is an N x N diagonal sample weight matrix, I is the indication function, and C is the regularized factor. Then the prediction function is calculated as
Ωx=a(Wx+b)β (5)
(5)
Then the output of the DWELM is O=ΩX . The j-th class weights of the classifier is calculated as the
σj=12lnxi∈jDxiI(Ωxi=tixi∈jDxiI(Ωxi≠ti (6)
(6)
Here xi is the i-th input vector, ti
 is the class of samples and amount of sample weights in the class j is equal to the 1/M
 (M is the total quantity of classes). After updating the sample weights, the classifier decision weight can be computed as
σ=12lniDxiI(Ωxi=tiiDxiI(Ωxi≠ti+12ln(M-1) (7)
(7)
Finally generate the projection weight matrix W2 using all the elements following the normal distribution and compute the value of X
 for (k+1)
 building block of DWELM.
X(k+1)=a(Xk+aX+γW2O) (8)
(8)
Then the DWELM is trained using Xk and Dxi
 to obtain β
 . This leads to the computation of DWELM weight (σ
 ). For testing stage, unlabeled data is used and the outputs are calculated using the values obtained as
Ox=argmaxmk=1KσkI(Ωkx=m) (9)
(9)
???????D. Stock price forecasting through MRMMA-DRL
The proposed MRMMA-DRL model incorporates the cooperative policies to the tolerant and flexible multi-agent system to learn the multi-source sentiments and events with high interrelation. The tolerance policy is applied to the flexible multiple agents to evade the relative overgeneralization. Similarly, the cooperative policy [25] is added to increase co-ordination between agents by defining a communication mechanism. The coordinated model learns the slowest but is stable and converges to near perfect performance. These properties can greatly enhance the learning process of combined opinions, events and the quantitative data for the analysis of the stock market data. Fig.1 shows the architecture of the proposed MRMMA-DRL.
Let θ be the weights constraint of Q-networks, at
 is the action and st
 is the state of the restructured Q–function. The network has three convolutional layers and two fully connected layers. For stability, the target network and flexible network are included; whose weights are updated after each round to match the objectives. The objective function is modelled as
Lθ=r+γmaxatQs't, a't,θ--Q(s, a,θ) 2 (10)
(10)
Here θ denotes the network weights, θ- denote the target network weights and Q
 denotes the output of the deep learning network. As concurrent learning without communication results in poor learning, the coordinated learning with communication is proposed. Similarly, the parameter sharing scheme has limitations in bandwidth allocation and lesser coordination between the multi-agents. To ensure the coordination, the learning process is initiated with centralized learner. It computes the Q-learning gradient to update the Q network and enables the network to share same weights between all agents. The tolerance is added to the flexible policy by
tols, t=1-e-K*Temp(?(s), a) (11)
(11)
Here (?(s), a) is symbolized to the heat value Temp
 and the hash-keys ?(s)
 are measured at time t
 for the state-action pair (s, a)
 .
.
The traditional methods to ensure coordination through communication between the multi-agents were equipped with the constraint optimization modelling which causes higher communication bandwidth and increased latency between the agent selections. To alleviate these limitations, the coordinated communication in MRMMA-DRL uses a small amount of bandwidth and reduced the computations for selecting the agents in the groups. This is achieved using a joint action with communication parameter a*
a*=(ai,ag) (12)
(12)
Here ai and ag
 are the action taken by individual agents and communicated actions between the agents, respectively. The communication from the nearer agents are joined by the agents own observation xit
 from the state space as
sit=xit,aft∀f, f≠i (13)
(13)
This model allows performing coordinated communication between the agents and allows the parameter sharing scheme to share the states and actions. However, one limitation in this model is that the action space gradually increases to reach |ai|×|ag| . This reduces the effectiveness and hence discretion is used to select the group action. It is achieved through a modified joint action
a*=argmaxatQst, at (14)
(14)
Additionally, the mini-batches and relay buffer are employed to improve the learning process and achieve stationary dynamics. The reward for each agent is allocated equally through appropriate credits. The difference reward is computed as
DRiz=Gz-G(zi+ui) (15)
(15)
Here Gz is the global reward of unified state z
 and zi
 and ui
 are the system state without agent i and counterfactual term, respectively. As it is non-trivial to calculate the value of G(zi+ui)
 , the reward allocation is determined using another simple strategy formulated as
Ri=R.Qist, at(1Ni=1NQisit, ait) (16)
(16)
Here N denotes the number of agents, R is the global reward signal and Qisit, ait denote the state-action pair for agent i at time t. The lesser the value of Qisit, ait , the better performance is achieved. The implementation of this cooperative policy will result in better learning of the multi-source sentiments and events. The MRMMA-DRL incorporates the stock indexes in a deep learning process and through the tolerant and cooperative policies, achieves the high accuracy in stock forecasting. Algorithm 1 summarizes the MRMMA-DRL model for stock forecasting.
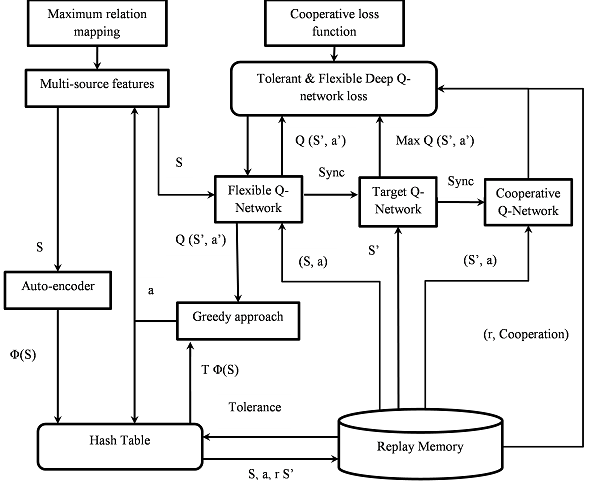
Fig.1. Architecture of MRMMA-DRL
Input: Tweets, news data and stock quantitative data
Perform pre-processing
Perform CDRBM through stacked RBM models
For each RBM model
Initialize layers and state
Compute energy and data passing using Eq. (1), & (2).
Apply convolution using Eq. (3)
End for
Return event features
Perform DWELM for sentiment extraction
Set the initial parameters
For each hidden layer
Construct the network for training
Compute output matrix and prediction function
Using Eq. (4) & (5)
Predict the class weights and decision weights of
classifier Eq. (6) & (7)
End for
Perform DWELM testing
Return sentiment features
Perform Deep reinforcement learning
Set learning rate α and β, N, weight θ , Maximum iterations, Initial Temp
 , t
, t
t←0
Set all agents
For iteration iter = 0,iter_max do
do
Model objective function using Eq. (10)
Apply tolerance policy using Eq. (11)
Perform joint action using Eq. (14)
Compute reward using Eq. (16)
Repeat
Form relationship map
Update weights for all agents
Return gradients and loss
End
Listing 1: MRMMA-DRL model for stock price forecasting
IV. RESULTS AND DISCUSSIONS
MATLAB tool is used to evaluate the proposed MRMMA-DRL model on the collected multi-source data. The performance metrics namely accuracy, precision, recall, F1- score and execution time are used for evaluation. The proposed model is compared with algorithms namely SVM [7], ANN [6], ELM, MIL [20], TMA-DRL [21] and TFMA-DRL [22]. The comparison plots indicate that the proposed MRMMA-DRL has achieved best stock forecasting results.
Fig 2 shows the accuracy comparison for stock forecasting between the existing models and the proposed MRMMA-DRL. The comparison results justifies that the proposed MRMMA-DRL has higher accuracy than the existing models. MRMMA-DRL has accuracy of 96.667% which is 6.67%, 16.89%, 24.12%, 28.12%, 34.39% and 37.22% superior to TFMA-DRL, TMA-DRL, MIL, ELM, ANN and SVM models, respectively.
Fig.3 shows the precision comparison for stock forecasting between the existing models and the proposed MRMMA-DRL. Results proved that the MRMMA-DRL has high precision of 99.5% which is 0.6%, 19.4%, 21.5%, 25.1%, 30% and 32.2% superior to TFMA-DRL, TMA-DRL, MIL, ELM, ANN and SVM models, respectively.
Fig. 4 shows the recall comparison for stock forecasting between the existing models and the proposed MRMMA-DRL. The results show that the MRMMA-DRL has high recall than other models. It has recall of 96.67% and it is 6.67%, 16.07%, 23.97%, 26.48%, 33.87% and 36.13% superior to TFMA-DRL, TMA-DRL, MIL, ELM, ANN and SVM models, respectively.
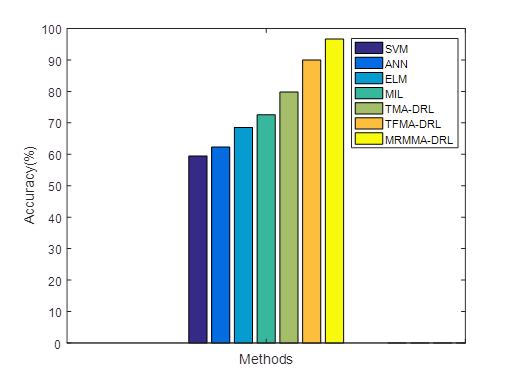
Fig.2. Accuracy Comparison
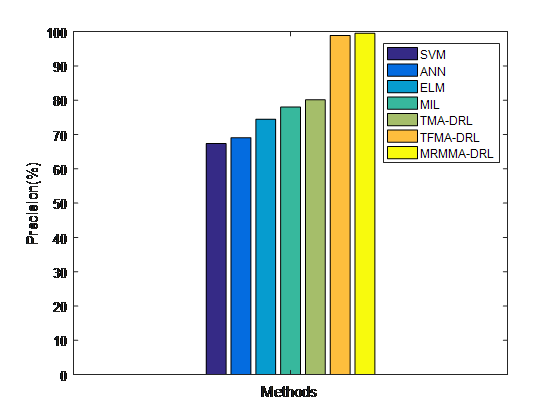
Fig.3. Precision Comparison
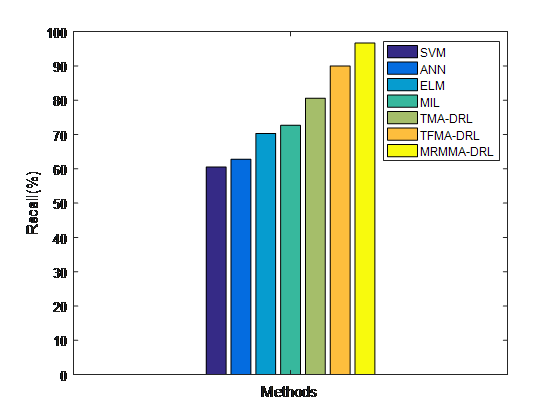
Fig.4. Recall Comparison
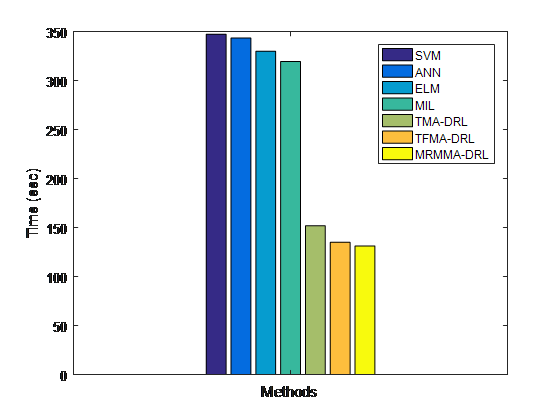
Fig. 5 illustrates the f1-score evaluation for stock forecasting between the existing models and the proposed MRMMA-DRL. The plot results show that the MRMMA-DRL has high f1-score than other stock forecasting models. It has f1-score of 98.305% which is 3.57%, 8.77%, 15.57%, 18.09%, 25.37% and 27.17% superior to TFMA-DRL, TMA-DRL, MIL, ELM, ANN and SVM models, respectively. Fig.6 illustrates the processing time evaluation for stock forecasting between the existing models and the proposed MRMMA-DRL. The proposed MRMMA-DRL is slightly complex due to the introduction three different policies in deep reinforcement learning while also employ DWELM and CDRBM models for stock indicators extraction. These complex models will greatly increase the time complexity for training but due to fast training of these models, the time consumption is greatly minimized.
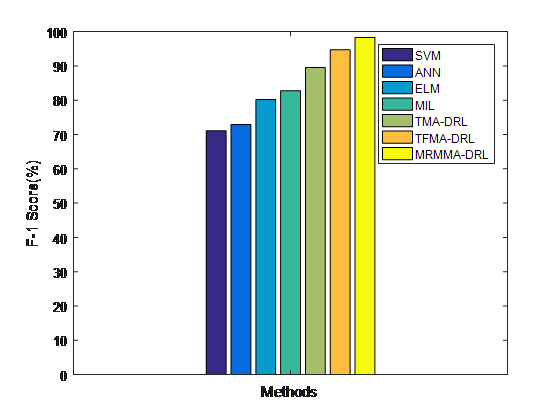
Fig.5. F-l Score Comparison
From the figure, it is proved that the time complexity of the MRMMA-DRL with 131.357 seconds which is very less among the compared models. The determined contribution for this efficiency is attributed to the use of superior design approach of MRMMA-DRL that minimizes the training time.
 ???????
Fig.6. Time Complexity Comparison
Conclusion
Predicting the future trends in the stock prices is an important aspect in the stock market agencies and investors. This paper analysed the multi-source data and extracted the sentiments and news events related to the stock price indicators using CDRBM and DWELM. Using these indicators, the deep learning model of MRMMA-DRL learns the maximum related patterns of stock prices and predicts the future stock volatilities. The integration of the cooperative policy to the general deep reinforcement learning has significantly enhanced the forecasting accuracy and reduced the training time. The performance evaluation results showed that the MRMMA-DRL has achieved 96.67% accuracy of forecasting with minimum time complexity. In future, the possibility of including more stock indicators from other social media and financial sources will be investigated.
References
[1] Schumaker R.P, Chen H, “Textual analysis of stock market prediction using breaking financial news: The AZFin text system”, ACM Transactions on Information Systems (TOIS), vol. 27. no. 2,pp. 1-19,2009. [2] ChristiansenC, Schmeling M, Schrimpf A, “A comprehensive look at financial volatility prediction by economic variables”,Journal of Applied Econometrics, vol. 27. no. 6,pp. 956-977, 2012. [3] Engle R F , Ghysels E, Sohn B, “ Stock market volatility and macroeconomic fundamentals”,Review of Economics and Statistics, vol. 95. no. 3,pp. 776-797,2013. [4] Liu L, Zhang T, “ Economic policy uncertainty and stock market volatility”, Finance Research Letters, vol. 15.no. 1, pp. 99-105, 2012. [5] Li X, Wang C, Dong J, Wang F, Deng X, Zhu S, “Improving stock market prediction by integrating both market news and stock prices”, In International Conference on Database and Expert Systems Applications. Springer. Berlin. Heidelberg, pp. 279-293,2011. [6] Guresen E, Kayakutlu G, Daim T. U. Using artificial neural network models in stock market index prediction. Expert Systems with Applications,vol. 38. no. 8,pp. 10389-10397,2011. [7] Lin Y, Guo H, Hu J, “An SVM-based approach for stock market trend prediction”, In 2013 International Joint Conference on Neural Networks (IJCNN). IEEE.2013, pp. 1-7. [8] Ou, P, Wang H, “Prediction of stock market index movement by ten data mining techniques” Modern Applied Science, vol. 3. no. 12,pp. 28-42,2009. [9] Chong E, Han C, Park F. C, “Deep learning networks for stock market analysis and prediction: Methodology, data representations, and case studies”, Expert Systems with Applications,vol. 83.no. 1, pp. 187-205,2017. [10] Long W, Lu Z, Cui L, “Deep learning-based feature engineering for stock price movement prediction.”, Knowledge-Based Systems, vol. 164. no. 1, pp. 163-173, 2019. [11] Selvamuthu D, Kumar V, Mishra A, “Indian stock market prediction using artificial neural networks on tick data”, Financial Innovation, vol. 5. no. 1,pp. 16-23, 2019. [12] Zhang X, Li Y, Wang S, Fang B, Philip S. Y, “Enhancing stock market prediction with extended coupled hidden Markov model over multi-sourced data”, Knowledge and Information Systems, vol. 61. no. 2, pp. 1071-1090, 2019. [13] Lee J, Kim R, Koh Y, Kang J, “Global stock market prediction based on stock chart images using deep Q-network, IEEE Access, vol. 7. no. 1,pp. 167260-167277, 2019. [14] Huang J, Zhang Y, Zhang J, Zhang X, “A tensor-based sub-mode coordinate algorithm for stock prediction”, In 2018 IEEE Third International Conference on Data Science in Cyberspace (DSC),pp. 716-721. [15] Liu F, Li X, Wang L, “Exploring Cluster Stocks based on deep learning for Stock Prediction, In 2019 12th International Symposium on Computational Intelligence and Design (ISCID), IEEE.2019, pp. 107-110. [16] Liang X., Ge Z., Sun L., He M., Chen H. LSTM with wavelet transform based data pre-processing for stock price prediction. Mathematical Problems in Engineering.2019. vol. 2019. no. 1. pp. 1-13. [17] Pang X, Zhou Y, Wang P, Lin W, Chang V, “An innovative neural network approach for stock market prediction”, The Journal of Supercomputing, vol. 76. no. 3, pp. 2098-2118, 2020. [18] Kesavan M, Karthiraman J, Adhithyan S, “Stock Market Prediction with Historical Time Series Data and Sentimental Analysis of Social Media Data”, In 2020 4th International Conference on Intelligent Computing and Control Systems (ICICCS), IEEE. 2020, pp. 477-482. [19] Zhang X, Qu S, Huang J, Fang B, Yu P, “Stock market prediction via multi-source multiple instance learning”, IEEE Access, vol. 6.no. 1, pp. 50720-50728, 2018. [20] Bhuvaneshwari C, Beena R, “Stock Market Forecasting from Multi-Source Data using Tolerance Based Multi-Agent Deep Reinforcement Learning”, International Journal of Engineering and Advanced Technology (IJEAT), vol. 9. no. 3, pp. 3492-3499, 2020. [21] Bhuvaneshwari C, Beena R, “Targeted Sentiments and Hierarchical Events based Learning Model for Stock Market Forecasting from Multi-Source Data”, International Journal of Innovative Technology and Exploring Engineering (IJITEE), vol. 9. no. 6, pp. 1763-1770, 2020. [22] Hu H, Gao L, Ma Q, “Deep restricted boltzmann networks”, arXiv preprint arXiv:1611.07917. 2016. [23] Wang T, Cao J, Lai X, Chen B, “Deep weighted extreme learning machine”, Cognitive Computation, vol. 10. no. 6,pp. 890-907, 2018. [24] Zhang C, Kuppannagari S R, Xiong C, Kannan R, Prasanna V K, “A cooperative multi-agent deep reinforcement learning framework for real-time residential load scheduling”, In Proceedings of the International Conference on Internet of Things Design and Implementation, pp. 59-69, 2019.
Copyright
Copyright © 2025 Dr. Bhuvaneshwari C. This is an open access article distributed under the Creative Commons Attribution License, which permits unrestricted use, distribution, and reproduction in any medium, provided the original work is properly cited.

Download Paper
Paper Id : IJRASET66712
Publish Date : 2025-01-28
ISSN : 2321-9653
Publisher Name : IJRASET
DOI Link : Click Here
 Submit Paper Online