Ijraset Journal For Research in Applied Science and Engineering Technology
- Home / Ijraset
- On This Page
- Introduction
- References
- Copyright
Environmental Impact Assessment on Noyyal River Basin Special Reference to Water Quality
Authors: Ravikumar P, Chandrasekar V, G Bhaskaran
DOI Link: https://doi.org/10.22214/ijraset.2024.58719
Certificate: View Certificate
Abstract
Introduction
I. INTRODUCTION
Our country is in the throes of rapid industrialization, which is often accompanied with massive environmental and social burdens, principally borne by communities living in the vicinity of project sites. Monitoring tools like Environment Impact Assessment (EIA), therefore, assume great significance in ensuring sound economic development without compromising on environmental and social costs. Environment Impact Assessment or EIA can be defined as the study to predict the effect of a proposed activity/project on the environment. A decision making tool, EIA compares various alternatives for a project and seeks to identify the one which represents the best combination of economic and environmental costs and benefits.
By considering the environmental effects of the project and their mitigation early in the project planning cycle, environmental assessment has many benefits, such as protection of environment, optimum utilization of resources and saving of time and cost of the project. Properly conducted EIA also lessens conflicts by promoting community participation, informing decision makers, and helping lay the base for environmentally sound projects. Benefits of integrating EIA have been observed in all stages of a project, from exploration and planning, through construction, operations, decommissioning, and beyond site closure.
A. Indian Scenario
India is the country has the mixed economy in its path along with Agriculture and Industry. But, the nation has witnessed rapid industrial growth during the post liberalization period. Unfortunately, this rapid growth has caused environmental stress in certain regions of the country. Acceleration of industrial exports, especially during this globalization period has further aggravated the environmental problems, which has imposed social costs on many local communities. During the last decade, governments have passed different laws to control the environmental pollution caused by developmental activities. The State Pollution Control Boards are the regulatory agencies, which have been entrusted with implementing these laws. But in many cases these agencies have not been able to implement pollution control measures to the full extent, especially in respect of unorganized small industries, which are located in clusters. India has comparative advantage in certain export industries, such as cotton textiles, leather, etc. due to availability of raw materials and cheap labour. Often they are also ‘water consuming’ industries since they require large quantities of water for processing. These industries discharge the untreated or partially treated effluents on land or water bodies, which end up polluting the environment. In the initial stages the pollution levels from these units might be low, since the effluent load would be more or less within the assimilative capacity of the surrounding environment. Hence, the local public did not consider these industries to be a problem. But, the gradual increase in the effluent load in proportion with increased output which over takes the assimilative capacity of the environment has begun to have serious environmental impacts. On the other hand, these industries provide regional socio-economic benefits in the form of income, employment and foreign exchange in the sustainable manner. Since small industries have historically been promoted as a matter of industrial policy, the government agencies face a dilemma, in regulating the acute pollution problems caused by the small-scale sector. Therefore, it is necessary to devise appropriate strategies for the sustainable development of these regions. As a part of existing regulatory programs, a number of environmental management measures have been undertaken. However, there are few studies, which have made an assessment of the impact of pollution caused by these industrial clusters on the surrounding environment, and on the other economic sectors such as agriculture, which have been affected, by pollution.
B. Tamil Nadu State Scenario
Tamilnadu has witnessed great industrial growth after the independence era especially in the globalization economy particularly Iron and steel industries, Chemical industries, Leather industries and Textile industries and others.
These industries created more employment opportunities and increased the GDP of the State. But on the other hand they exploited the nature for their cost. The wastes, which are cause and effect of these industries created more environment problems in their location region especially river basins like R. Cauvery, R. Palar and its tributaries. The effluents and wastes that are discharged into the river with high toxic chemicals polluted the river water and its basin. Consequently the whole environment gets effected and it reflects on the ground water, agriculture, animal husbandry and finally on public health.
II. STATE OF NOYYAL RIVER BASIN
The Noyyal river basin, Tamilnadu is an interesting case study for EIA. It has three different regions as agriculture dominating upper and lower basin while flourishing areas of spinning and weaving industries including the world famous “Baniyan City” Tiruppur in the middle basin.
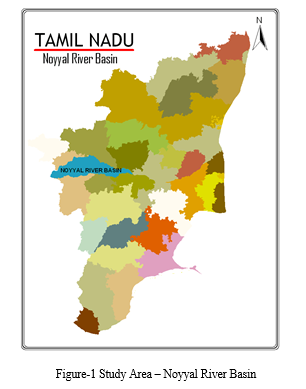
Noyyal River basin located in Mid-West region of Tamilnadu State and made boundary with Kerala state (Figure-1). The whole basin falls under Tamilnadu State administrative area comprising Coimbatore, Erode and Karur Districts. The Noyyal river basin extended from 11.20’ N to 11.00N and 77.00E to 77.56’E. Geographically this basin begins from Vellingiri hills, leeward side of Western Ghats and flows eastward and merges near Noyyal village with River Cauvari which also flows from the Western Ghats in the Madikere district, Karnataka and passes through Tamil Nadu and confluence with Bay of Bengal in Nagapattinam district of Tamil Nadu. It flows over a distance of 175 kilometers. The catchment area of the river is 3.49 lakh hectares.
The shape of the basin is like funnel, which is kept in horizontal position. The basin has large area in the northern side, it reduced gradually when moves towards the consequent river in the eastern direction(Figure-2 and 3). So the Noyyal river flows through eastern direction and confluences with river Cauvery at 11.04’N and 77.56’E. Both the south west and north east monsoon gives 400mm rainfall at moderate level at Noyyal river basin, because Tamilnadu is geographically located between Western and Eastern Ghats in either side. More than 100 villages are situated on both sides of the banks of River Noyyal throughout the course. Noyyal was the major source for irrigation, drinking water and domestic activities of the people living on both sides of the river and even for people living beyond 3 kms from the river.

The primary activities of people in the basin are agriculture and animal husbandry. The secondary activity is yarn and cloth processing, knitting and dying.
The secondary activity polluted its surrounding in the Noyyal basin by its chemical effluents. So the environments of the land, surface and ground water get affected and also a declining trend in the primary sector. Consequently these changes affect the natural environment and put this area as desertification. Soil, surface and underground water also getting polluted and it gives adverse effect to animal and human health also.
So there is an urgent need to analyze the impact of pollution on the environment and public health in the Noyyal river basin. It is proved by some regional studies in and around the Tiruppur region. The present study made an attempt to analysis the environmental impact on Noyyal river basin as whole by direct field survey in the basin.
III. METHODOLOGY
Using the Survey of India topographical maps (No. 43/4, 43/7, 43/8 and 44/1) and the Taluk map the study area have been used to demarcate the boundary of the basin, location of villages and industries and the digital database have been created. Special attention has been given to the growth and functioning of bleaching and dyeing activities in Tiruppur region since it is the source of the problem. This data was mainly collected from the Pollution control Board records and previous investigations.
A. Field Study
- Water quality
To determine the general quality of the water in the basin a total of 38 water samples were taken. The basin separated with grid system by using topographic map and every sample taken from well or bore well. The following quality parameters were assessed by research scholar based on instruments and other methods specified below.
Table -1 Water quality parameters and methods
|
No. |
Parameters |
Method |
|
1 |
PH |
PH meter |
|
2 |
EC |
Conductivity meter |
|
3 |
TDS |
Conductivity meter |
|
4 |
Na, K |
Flame photometer |
|
5 |
Sulphate |
UV Spectrometer |
|
6 |
DO |
Wrinkler Method |
|
7 |
Cyanide |
Titration method |
|
8 |
Chlorine |
Titration method |
|
9 |
Alkalinity |
Titration method |
|
10 |
Hardness |
Titration method |
2. Public Health
Since Noyyal River is seasonal in nature the ground water is the main source for the domestic and irrigation purpose in the villages, which are, located both side of the river. From the ground water analysis the result shows the water quality of the Noyyal river basin has been polluted in different scale in various locations. This pollution leads to the contamination of aquifer as well as water sources. So, the wells and bore well which are used by people for their domestic and agricultural purpose also supplies the same. Due to the usage of polluted water there is ill health to the public. Public health survey had been conducted in the field through a structured questionnaire to know the level of public health in the area. Face to face survey results are tabulated and analyzed through the statistical packages and also portrayed spatially. Based on the different level of pollution 4 Public Health centers were selected for the intense health survey. Here the diseases like Diarrhea; skin disease, asthma and fever are taken to count for study.
3. Agriculture
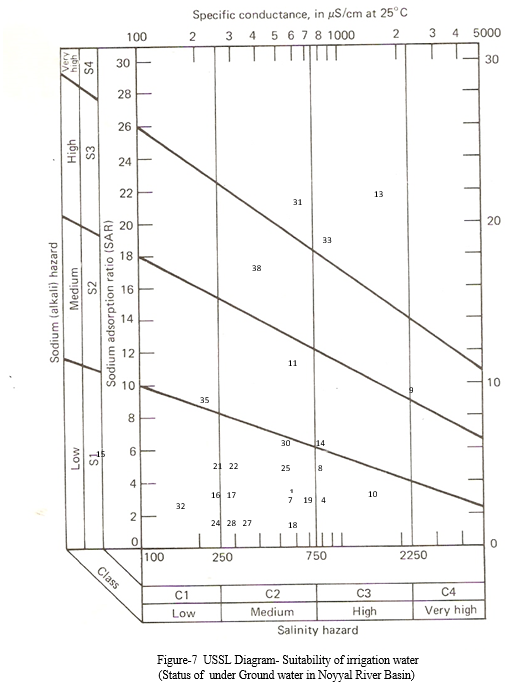
The quality of the irrigation water can be graded based on the method at U.S.S.L diagram. It gives the water quality gradation based on sodium absorption ratio and electrical conductivity. It gives gradation to the irrigation water suitability like highly suitable, moderately suitable and low suitable. Based on this result the damage in the agriculture is discussed. During the field visit land use pattern had been clearly observed and crop damages were recorded and documented.
4. Animal Husbandry
When the water is getting polluted it affects the animals which are grown in domestic, because animals also part of agricultural life and associated with environment. This impact had been assessed through the direct people survey in the affected areas. The veterinary doctors were also interviewed and discussed in the field.
IV. TIRUPPUR DYING INDUSTRIES – AN OVER VIEW
Tiruppur and its surrounding areas are climatically semi-arid regions. So it provides agriculture opportunities for their lively hood in only a part of the year. So during the remaining dry seasons people moves towards the other opportunities. The climate of Coimbatore is very suitable for the growing of cotton. After realizing the availability of labour and raw material , the textile related industries began their era in the Tiruppur regions.
A. Reasons for Industrial Growth in Tiruppur
The emergence of the hosiery industry in Tiruppur and its contribution in knitting segment including export is highly appreciable. The transformation of Tiruppur from a ‘village agrarian economy’ to ‘knitwear capital of India’ is within a very short period of 3 to 4 decades. There are number of reasons behind this quick transformation, which include (a) climate and water (b) availability of good quality raw materials and labour, (c) infrastructural facilities, (d) industrial structure and its functions, (e) export culture etc.
B. Industrial Growth
The growth of cotton textile and textile product units in Tiruppur from 1980s is estimated with the help of data gathered for different periods shown in the Table-2 and Figure-4.
From 1994 onwards the industrial growth-trend was very rapid and the number of units increased to 12,521 during 2003. That is the growth of units between 1994 and 2003 (10 years) was 5,440. In brief the analysis on the growth of industrial units reveals that rapid growth occurred during the liberalization period of the 1990s.

V. LOCATION OF INDUSTRY AND MODE OF EFFLUENT DISPOSAL
The physical location of the textile processing units in respect of effluent generation is important for the present study. Table-3 provides details regarding distribution of industry and effluent generation based on land use. From the data, it is evident that 77% of units are functioning in non-industrial area and they generate around 75% of the total effluents. Hence the possibility for contaminating the soils and ground water, in agricultural and residential area is very high. Since 239 units are located at a distance of less than 300 meters from the Noyyal riverbank, the potential for polluting the river is also high. The 424 units that have individual treatment plants discharge the effluent into Noyyal River, streams and irrigation land. Around 83% of the units are disposing their effluent in water bodies (18.27 MLD in Noyyal and 19.06 MLD in streams). 4.33 MLD effluent (9.05%) is discharged in industries on-land and 3.5 MLD (7.75%) is on irrigation land.
The above analysis on textile effluent during last two decades in Tiruppur clearly reveals the possibility of pollution accumulation and its impact at Tiruppur and downstream. This accumulation leads to environmental impact on the Noyyal river basin. This impact is the main purpose of this study.
Table – 3 Location of textile processing units and effluent generation
|
Sl. No. |
Land use |
No. of Units
|
Effluent Generation (KLD) |
||
|
Actual |
% |
Actual |
% |
||
|
1 |
Industry |
158 |
22.50 |
20,973 |
25.23 |
|
2 |
Agriculture |
179 |
25.50 |
19,610 |
23.58 |
|
3 |
Residence |
225 |
32.05 |
16,787 |
20.20 |
|
4 |
Public land |
140 |
19.95 |
25,769 |
30.99 |
|
|
Total |
702 |
100.00 |
83,139 |
100.00 |
Source: Computed from PCB Data, 2000
A. Treatment Programme and Effluent Quality
As explained earlier, the 702 functioning units in Tiruppur treat their effluents through IETPs (424 units) and CETPs (278 units). At present 424 units have established IETPs that treat 45.16 MLD of effluents. The quality of the treated effluent is compared with untreated effluent and the effluent standard for bleaching, dyeing and bleaching & dyeing units respectively. The Pollution Control Board from the samples tested by the Board at different points in time obtained the average values of quality of the treated and untreated effluent.
From the table it is evident that there is substantial reduction in the concentration of COD, BOD and Oil &Grease and the treated effluents meet the PCB standard. In the case of Sulphate it’s different. The untreated effluent itself meets the standard but the level does not decrease after treatment.
The TSS concentration in treated effluent shows a decrease for all 3 types units, but in most cases the effluent standard of 100 is not obtained. The TDS and Chloride levels remain unaffected after treatment, since there is no provision for removal of dissolved salt. Both TDS and Chloride level are far in excess of the respective effluent standard of 2100 and 1000 mg/l and are the primary cause of pollution in Noyyal River and its basin.
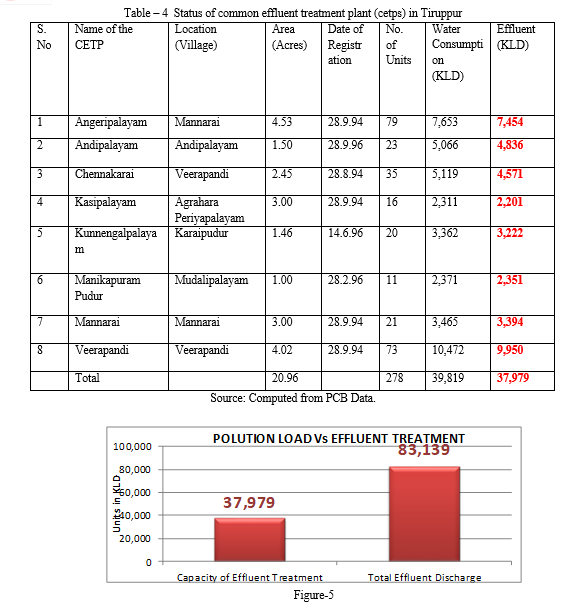
The details regarding the Common Effluent Treatment Plants, such as the location, area, registration date, number of units, water consumption, and effluent are given in Table-4.
From the above analysis the following conclusions to be drawn :
- The pollution load for all parameters increased over the period 1980-2000 due to the growth in the number of units and correspondingly high effluent generation and the low capacity of the effluent treatment plants leads to discharge of untreated effluents from the industries(Figure-5).
- The possibility of accumulated pollution impact is very substantial in the case of TDS, Chloride and Sulphate. In the case of these three pollutants the discharged load concentration was very high and showed only a marginal decline after the effluent treatment plants were set up.
- While TSS, COD, BOD and Oil & Grease load concentration increased over a period, they have reduced substantially after the introduction of treatment and also due to plant closure. However, the common effluent treatment plants do not seem to reduce the load significantly.
VI. ENVIRONMENTAL IMPACT ASSESSMENT (EIA)
A. Impact On Water Resources
1) Surface Water
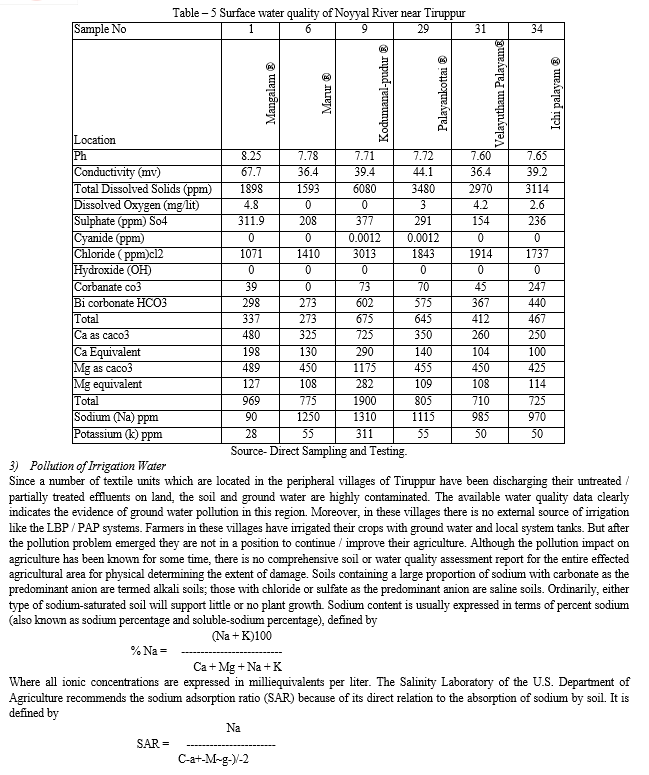
The Noyyal river water chemical composition tested by taking direct samples from it. The results tabulated below(Table-5).
The chemical composition of the Noyyal river water has drastic changes when moving from upstream to downstream. It can be identified easily by the colour comparision of the water samples(Plate.1). The table shows the middle stream has highest chemical composition compare with up and down stream. The upstream river has lowest level of pollution compare with the standard level on composition. This is shown by the table value of Mangalam and Marur samples. Moving to downstream, the pollution level of the river water increases geometrically. It shown by the hardness and alkaline values of the Kodumanal and Palayakottai samples. The chemical composition shows the river water influenced by the effluents which are untreated. This is evidenced by the composition of total dissolved solids, Sulphate, Cyanide and Chloride in the river water. In the down stream the composition of the same chemicals decreasing while the river moving away from Tiruppur region. This evidence proves that only the untreated effluents of the Tiruppur processing industries pollute the middle river stream.


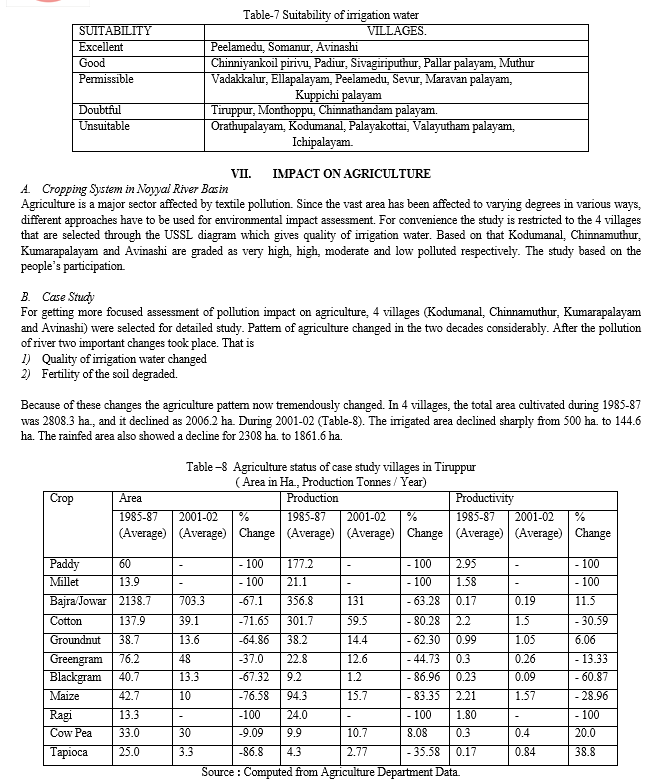
The summary of the discussion is provided below:
a. Before the emergence of textile pollution (1980) water quality in all local Systems tanks (all 4 villages have system tanks fed by the Noyyal River) were extremely good, hence it was a primary source of irrigation. Besides the ground water available in the villages was also of good quality and used for irrigation. But at present because of textile pollution both surface (tank) and ground water are unfit for irrigation. Hence the dependence of tank and wells has reduced substantially. Now the farmers are able to cultivate only rainfed crops in these villages.
b. Before the emergence of pollution, farmers in these villages cultivated crops like paddy, cotton, groundnut, banana etc. The water intensive crops have more or less disappeared from these villages, and farmers are cultivating rainfed crops like chollam, millets, jowar etc.
c. The soil quality was good in earlier years. But after irrigating with polluted water, soil quality deterioration has occurred. In earlier years, farmers used manure like cow dung, tree leaves etc. and very less amount of chemical fertiliser. Now the fertiliser consumption has increased substantially to compensate for the deteriorated soil quality. Still substantial improvement in production has not occurred.
d. After the emergence of textile pollution, area under cultivation, production and Productivity etc. have reduced considerably.
Thus, the impact of pollution is not much in evidence at the regional level but is very specific to the case study villages that are severely polluted. This is an indication that the impact of pollution varies substantially within the region. The focal groups discussion and opinion survey are also clearly substantiate the serious pollution impact on agriculture in the severely affected area.
VIII. IMPACT ON ANIMAL HUSBANDRY
A. Impact Assessment on Lives Stock
When the animal fodder cultivated through the polluted water, the pollutants and chemicals changes the quality of the fodder and some remnants are stored in the fodder also. In this fodder fed to the animals the health of animals severely effected. Sometimes the animals directly fed to the grasses which are grown in the river banks and dam outlet. The impact on animals assessed through the public interview and vetinary doctors in the selected locality. The farmers in the affected hamlets said that they had to decrease the number of animals. The reason for this was that it was not possible to grow enough feed for them and/or the farmers had to buy water or collect water far away from the farm. Some farmers also explained that they had to change animal species, e.g. cattle to goats. Some farmers still let the animals drink the contaminated water, which was sometimes mixed with good quality water, but in some cases the farmers complained that the animals often had Diarrhea. They also had a decrease in milk production or produced milk with a salty taste. Some farmers told us that a higher frequency of pregnant cows got still born calves. The appearance of the animals had also changed. The goats, for example, looked very unhealthy since they had started to lose their skin. The goats also gave birth to comparatively small kids and had colds more frequently than before the contamination. Some farmers also claimed that the animals would become sterile if they were to drink the water. Those farmers that still gave the contaminated water to the animals and had not yet seen any negative effects, as yet expressed their worries about what would happen to the animals in the near future.
B. Fisheries
Fisheries is another sector which is seriously affected by industrial pollution. Since the Orthapalayam reservoir is highly contaminated by the textile effluents from Tiruppur, the fisheries activities in the reservoir was affected and frequent fish mortality occurred.
C. Salient Findings from the Study
|
Before Pollution (Before 1997 app.) |
After Pollution (After 1997 app.) |
|
|
IX. PUBLIC HEALTH ASSESSMENT
The release of more or less untreated effluents from the textile industries in Tiruppur and the stagnation of the effluents in the Orathupalayam dam had resulted in a terrible situation for the people who lived close to the dam. Through the in-depth interviews, identified how people were affected, what help they had received and what they thought of the future for people in general and for different groups of people.
A. Quality of Drinking Water
Based on the analysis of ground water samples from Noyyal river basin the nature of ground water quality as shown below.
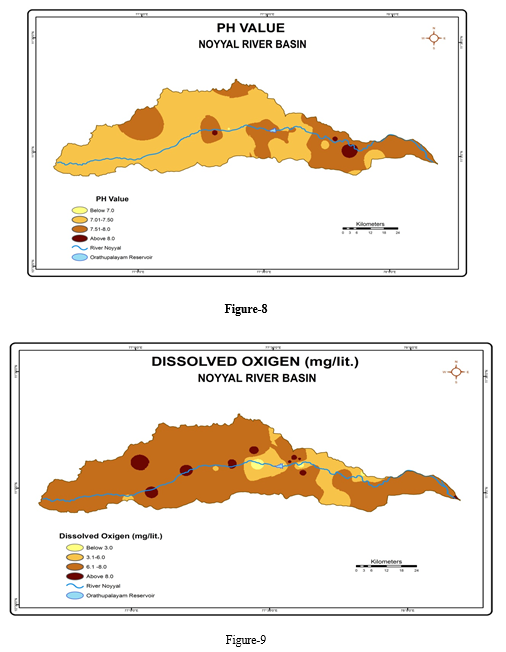
B. PH
The PH of the water is normally 7.3 in the upstream areas like Vadakalur and adjoining areas. It increases when moving towards middle stream in the Tiruppur and adjoining regions. It reaches maximum level of 8.14 in Mangalam area, which is the cluster of textile processing industries. The high level of PH 7.5 to and above is evidence that river water have highly affected by industrial effluents(Figure-8).
C. Total Dissolved Solids
The amount of solids dissolved in the water determines the chemical property of the water. The upstream area has less amount of TSS (775 ppm) in Vadakalur and it increases by moving towards middle stream (3700 ppm) in the Orathupalayam region. The maximum level of TSS is identified in Kodumanal areas, which is very near to the Orathupalayam dam. Again it reduces when moving to downstream, (Attupalayam – 616 ppm)(Figure-9).
D. Dissolved Oxygen
Dissolved Oxygen content is the important composition to decide the level of utilization of water. The O2 content is high in the upstream 8.2 mg / lit in the Ellapalayam area. But it reduces when moving towards middle stream because the intrusion of chemical effluents. The amount of O2 is empty in some places like Kodumanal and marur areas. Because in the middle stream area experiences highest level of effluent intrusion. In the down stream again it raises with the high of 8.1 mg/lit in Pudur region(Figure-10).
E. Sulphate and Chloride
Sulphate and chlorides are more important constituents to determine the quality of the water. The upstream Noyyal river basin has low level of sulphate and chloride (Vadakalur So4 28.6 ppm and Cl2 243 ppm). The level increases to maximum level moving towards the middle stream because of the high pollution due to textile effluents (Kodumanal SO4 270 ppm Cl2 2127 ppm). The down stream has low level of these constituents because it located far away from the Tiruppur region(Figure-11).
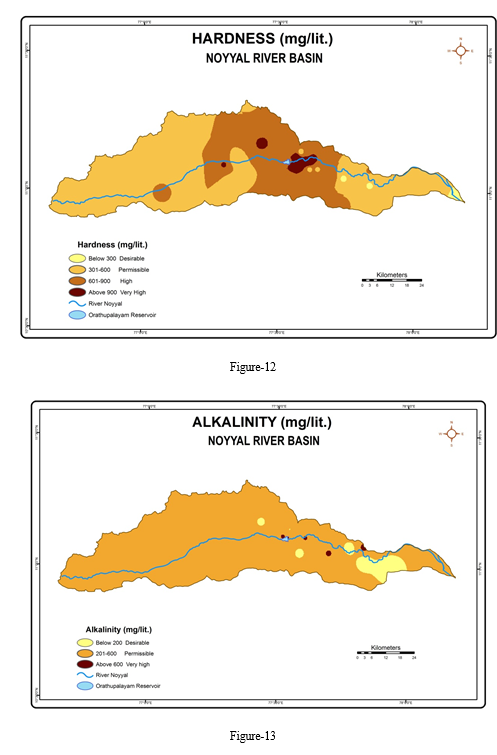
F. Alkalinity
The level of alkalinity is very low in the upstream areas for example Vadakalur has 330 ppm. But moving to down stream basin it increases maximum up to 602 in the Kodumanal region because of the chemicals intrusion from processing industries. Alkalinity consists of three components that are Hydroxide (OH), Carbonate (CO2) and Bi carbonate (HCO3). In these components Bi carbonate is the sole contribution and in some areas in the mid basin Carbonate contributes substantially and all the places Hydroxide is absent(Figure-12).
G. Hardness
Hardness is the very important property of the water to determine the nature of usability. Hardness also has the same level as that of Sulphate proceeds low, high and moderate in up stream, middle stream and down stream respectively. Lower level of 300 ppm found in Chinniyankoil koil pirivu and the highest 825-ppm in Kodumanal area. Here Ca and Mg both participate equally to determine the hardness of the Noyyal basin under ground water. This reveals that the effluents form the textile industries is the sole responsible for the highest level in middle region(Figure-13).
H. Sodium and Potassium
Sodium and potassium are also important elements to determine the quality of the under ground water. The level of these constituents has high fluctuations compare with other elements. Lowest level found in upstream region of Somanur (Na- 50 ppm and K- 0 ppm ), highest level of Sodium in Pudur (550 ppm) and Potassium in Montoppu (155 ppm ) .
The above discussion reviles that the chemical composition of the under ground water in increases from lowest to high level when moving from upstream to middle steam. But it again reduces considerably while moving to down stream. It evidences that the effluents released by the processing industries in the Tiruppur region affect the middle noyyal river basin.

I. Source of Drinking Water
The study area villages have their source of drinking water in different places based on the quality of the ground water in their native places. Change in different sources of drinking water for the study area have observed and documented through the field survey. The result discussed below.
- Tammareddipm: Affected hamlets either brought water from BW in Rengappanpm in case of scarcity which was the case at the time of the interviews. Before that they received water through a pipeline from BW close to the LBP canal in Maravapm. Some people also brought water from a BW in Sellappanpm.
- Maravapalayam: Some people in the affected hamlets bought water from Chennimalay. A couple ofyears ago they used to receive water from the BW 58. Many people had to buywater in this village, e.g. Semmankulipm., Karikadu and Kamachipuram.
- Kiranur: Affected hamlets bring water from wells with good water within Kiranur
- Ellaigramman: Affected people in the village bring water from wells with good water withinEllaigramman or receive water through a pipeline from Kumarapm as in Ramalingapuram hamlet.
- Orathupalayam: Some affected hamlets used to receive water through the pipeline from Kumarapmbut because of scarcity many people now brought water from the common BW in Pandiannagar or from Thippanpm. A new BW had been drilled in Onakaradu but the water was soon found to have a salty taste and could not be used for drinking.
- Kodumanal: New bore well established near Kuppanpalayam, probably 5 km from the village. People in many hamlets had to buy water and some people bought water for all purposes whereas most people could not afford buying water for washing and bathing. As always, the poorest people were the ones most severely affected. Women could be seen washing in the river water and even in the dam. There was no other way, they said, since they could not bring enough water from other places for all purposes and could not afford buying water. People complained that it was very difficult to wash clothes in the polluted water since the soap did not lather and dirt was not removed. Many new wells had been drilled in the upper regions to reach good water for the affected people but some wells did not supply sufficient amounts of water and others reached bad water, probably due to contamination from the dam. Many bore wells with good water in the upper regions were drying out in October 2003. Some people in the upper regions even had to fetch water from wells close to the dam for washing purposes e.g. in Ganapathy palayam they had a pipeline from Thangamman Kovilwhich carried high EC-water. For the people living in the affected areas around the Orathupalayam dam every day was a struggle for receiving fresh water.
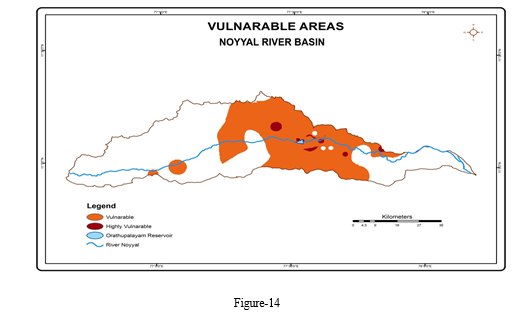
Based on the Geographical Information System Raster calculation the Vulnerable areas in the Noyyal River Basin has been identifies and mapped (Figure-14)
J. Effect on Farmers Health
Farmers were particularly affected by the pollution through irrigation with dam water or contaminated well water. The only constraint before the construction of the reservoir was the availability of water. The farmers could no longer exist on farming and could only grow rain-fed crops in fields where they had not used polluted water for irrigation. Many had been forced to change profession and started to commute to nearby cities to work in industries. We were told by many farmers who had walked in the fields while irrigating with polluted water that they had got skin irritations on their legs. One man also showed us the skin irritations he had. Many farmers had animals that were also affected by the contaminated water.
K. Public Health Impact Assessment
All people interviewed in the in-depth interviews said their skin was itching after taking bath in their well water (or in dam or river water) and that they got allergic diseases Their skin and hair got sticky and some people also said that had lost hair from washing in the polluted water. They stopped drinking the water as soon as they got Diarrhea. Everybody expressed their worries about the health effects of being in contact with the water. They had not received any information about the analyses made on the water in their area and knew nothing of the health effects other than what they had experienced themselves.
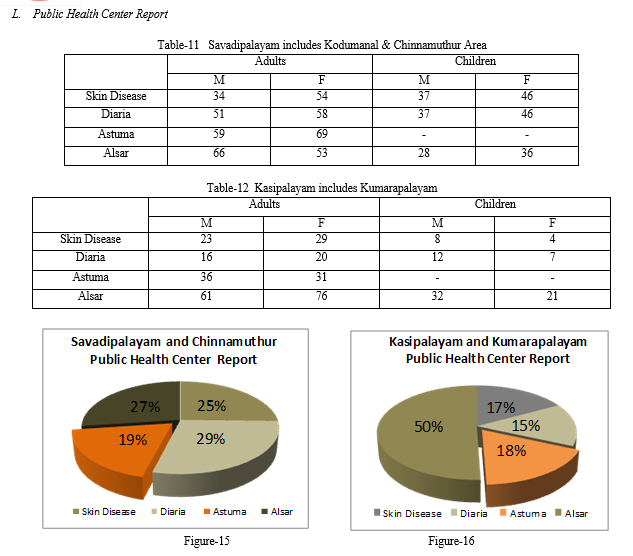
Based on the water quality 4 villages selected for the health survey (Table-9) and specific diseases which are frequently effects the people are observed by public interview (Table-10)
Table- 9 Sample villages and pollution level
|
Very High Polluted |
Kodumanal |
|
High Polluted |
Chinnamuthur |
|
Moderately Polluted |
Kumarapalayam
|
|
Low Polluted |
Avinasi |
Table-10 Diseases observed based on the public interview Specific diseases
|
Village Name |
No. of persons interviewed |
Specific diseases observed |
|
Kodumanal |
100 |
Skin allergy, Joint pain, Respiratory problem, Ulcer, Diarrhea |
|
Chinnamuthur |
100 |
Skin allergy, Joint pain, Respiratory problem, Ulcer, Diarrhea |
|
Kumarapalayam |
100 |
Skin allergy, Joint pain, Respiratory problem, Ulcer, Diarrhea |
|
Avinasi |
100 |
Respiratory problem, Fever |
The Kodumanal village that is very near the Tiruppur and Orathupalayam dam has diseases like Skin allergy, Joint pain, Respiratory problem, Ulcer and Diaria. These are cause and effect of the water pollution. The same result accured in Chinnamuthur village that is rated as highly polluted village. But in low polluted village Avinashi has only respiratory problem and fever that are common to all places. This reveals that villages near to the Tiruppur region highly effected by the polluted water. The highly effected villages again studied to find the level of impact on the public health. So the selected public health centers that are very near to highly effected villages surveyed. The survey gives the impact of pollution on the public health. The results tabulated in Table 11 and 12 and Figure 15 and 16. The analysis of the PHC’s data gives the conclusion that the villages located near to the river basin and Tiruppur have more impact on public health compare with upstream and downstream villages. The villages Kodumanal and Kumarapalayam which are located in the northern side of the basin and Chinnamuthur located southern side of the basin, are within the 5 km from the river. So these are highly effected by the water blended with effluent. But Avinashi located nearly 17 km away from the river has less effected.
X. RESULTS
This study on "Environmental impact assessment" is a preliminary attempt to address the key issue raised by the impact of industrial effluents in Noyyal river basin. The industrial effluents are derived from the Tiruppur region of Coimbatore, which is located on the Noyyal River. These effluents affected the every aspect of the environment in the Noyyal river basin. The result of the above analysis is given below.
A. Surface Water
The effluents directly discharged into river water. So river water is polluted from the place where the effluents are blending with river. The above analysis shows that the contamination of river water starts with the Tiruppur region and it increases towards the Orathupalayam dam and reduces gradually. It evidences that industrial effluents from the Tiruppur region is the source for the Noyyal river pollution. The polluted effects the environment where ever it drains. The Noyyal river is the main source for the usage of all the purpose in the basin area. So the major source of surface water polluted and its consequence it effects the soil, ground water, agriculture, animal husbandry and public health.
B. Ground Water
The main source for recharging the ground water is Noyyal river water, as it polluted the ground water also get polluted. It proved in the ground water sample analysis. The ground water pollution accelerating when moving towards Tiruppur region and it gradually reduces moving away from it. The damage is not confined to Tiruppur town and its immediate surroundings, but extends more than 30 Km downstream to the Orthapalayam Dam and beyond. The areas very near to the river basin after Tiruppur region is seviorly polluted. The pollution is high in the right hand side of the river compare to the left hand side of the river. This is because of the slope of the basin is towards the right handside of the river. So, all effluents easily percolated through aquifers in the right side.
Finally the aquifers, drinking and domestic supply source to the people in the Noyyal river basin supplies polluted water and leads to the animal husbandry and public health disorder.
C. Agriculture and Animal Husbandry
As discussed earlier, the agriculture and health of animal husbandry also changed enough through the last decade. The forms near the Orathupalayam dam and neighboring areas got significant changes in the pattern of crops cultivation, production and productivity. It is the consequence of pollution of underground water and the degradation of the cultivable land. The physical properties of the soils like fertility, texture, color and salt composition are changed significantly. So these effected areas the cultivation of crops also. In some other distance regions also have same problem, because of the river water pumped to the distant fields for irrigation. For people who did not own land but worked for farmers as labourers, the pollution had resulted in unemployment. On the farms where they used to work, not as many laborers were needed anymore since less land was cultivated and many fields had to be left as fellow or gave poor yields. The water scarcity due to rain failure during the recent years, and no water in the LBP canal, had further added to the difficult situation. The bore well in the village was affected by the contamination and could not be used for drinking. Instead the villagers had to bike kilometers away to fetch water. They used the bore well for washing and bathing but it was not sufficient and they therefore had to go to the river downstream of the dam to wash clothes.
It reveals that the people following agriculture having short of pure irrigation water. The lands will get proper agricultural conditionality, even if the polluted water stopped in the river and using of it , takes minimum of 5 to 7 yrs. Because ,the land environment polluted to that level which take long duration to make it neutral.
D. Public Health
The previous chapter identified that, the waterborne diseases are very prone near to the Noyyal river basin after the Tiruppur region. The previous chapters explains that the pollution of water in the river and the consequence of underground water pollution are the effluents delivered by the industries. The public health is very much effected near to the river basin compare to the far off places from the basin. The impact extended more distance in right hand side of the river compare to the left hand side. This is based on the terrain slope which will makes the high percolation of water in the right side, because of the slope always towards right, that is east and south. The river Bhavani located very near to the Noyyal basin in the north side. So that the water from the Bhavani river basin also percolates into the northern boundry of the Noyyal basin. These reasons explain the pollution level difference in the Noyyal river basin. And when moving towards east, the river enters to the drier part of the region. So, water scarcity increases towards the downstream. The domestic supply of water which supplied from the distance places is high cost. So the peoples are forced to use the comparatively less polluted waters near by places, resulting diseases spreads.
Any problem in the world is having the solution. The environmental impact on the Noyyal river basin is also has its own remedial measure.
XI. SUGGESTIONS TO REDUSE THE ENVIRONMENTAL IMPACT
The environmental impact can be reduced in two phases as follows:
A. Phase I : Strategies to be followed in Tiruppur region
- Increasing effluent treatment plants in Upper basin (Tiruppur region).
- Introduction of modern methods of cleaner technology to treat effluents.
- Implementing zero discharge technique.
- Imposing strict regulations on industries to treat effluents.
- Providing financial and technical assistants.
B. Phase II: Strategies to be followed in lower basin (after Orathupalayam Reservoir)
- Completely open the Orathupalayam dam till all the stored effluents get washed away.
- Create canals to bypass the Orathupalayam reservoir to avoid additional storage of effluents.
- Use the fresh water from River Bhavani by link canal to clean the dam.
- Lining of river to avoid the seepage of water into the soil till stored effluents washed away.
- Regular monitoring of water quality in the Orathupalayam Reservoir and downstream and educate public about the same.
- Giving awareness to the public not to use the water until it reaches permissible limit for both irrigation and domestic.
The government and financial institutions could aid the process by offering incentives to make the changes. Research institutions could provide technical support, as they have done in the case of effluent treatment. WTO rules in the future may also require that the hosiery industry produce goods for export that are produced in an environmentally sustainable manner. Since the hosiery industry is export oriented it may be under pressure to meet ISO 14000 or other international standards. Not controlling pollution adequately may not remain an option for very much longer. In any case, if the industry takes a long-term view, it would be better to make the investment in cleaner technologies as soon as possible.
References
[1] Azeez, P.A. (2001), “Environmental Implications of Untreated Effluents from Bleaching and Dyeing. In: Ecofriendly technology for waste Minimization in Textile Industry”. Centre for Environmental Education, Tirupur & Environment Cell Division, Public Works Department WRO, Coimbatore. pp: 5-11. [2] Ahmad Yususf et al (1992) \"Environmental Accounting for Sustainable Development\", World Bank. Pp. 6-9 [3] Appasamy Paul P et al (1997) \"Methodology of Damage Assessment: A Case Study of the Palar Basin\': Report (Unpublished) MIDS,- Chennai. [4] Blader W Derek (1992) \"Measuring Pollution with in the Framework of National Accounts\" in Yusuf Ahmad \'Environmental Accounting Cor Sustainable Development\'. pp .45-49 [5] Central Ground Water Board Rep0l1 (1993), \"Ground water Resources and Development Prospects in Coimbatore District, Tamilnadu\", CGWS Southern Region, Hydrabad.pp78-80 [6] Central Ground Water Board (1980), \"Inventory Data of Permanent Oberservation Wells in Noyyal River Basin\" Chennai pp 76-89 [7] Chandrasekaran, K. (2001). “Studies on Management of Sludge From Hoisery Knitwear Dyeing Wastewater Treatment Plants. In: Ecofriendly technology for waste Minimisation in Textile Industry.”, Centre for Envrionment Education, Tirupur Field Office, Tirupur & Environment Cell Division, Public Works Department WRO, Coimbatore. pp: 61-62. [8] Directorate of Town and Country Planning (1990) \"Master Plan for Tiruppur Local Planning Area\". pp 23-33 [9] Environmental Cell Division WRP (2000), “Environmental Impacts of dyeing and bleaching industrial effluents on abiotic and biotic components of the river Noyyal”. Paper in workshop on Impact of industrial effluents, sewage and agricultural practice on water quality, Organised by:, Public Works Department, Coimbatore.pp7-8 [10] Gupta, I.C. & Jain, B.L. (1992). “ Salinisation and alkalization of ground waters polluted due to textile hand processing industries in Pali. Curr.Agric.’, pp:59-62. [11] Gustavsson, Y., Jacks, G., Nilsson, L.Y. & Taranger, B.( 1970). “Water resources and water supply in Coimbatore district, Tamil Nadu, India”. Department of land improvement and drainage school of surveying, Royal Institute of Technology, Stockholm.pp 56-76 [12] Jacob Thomson (1998) \"Impact of Industries on the Ground Water Quality of Tiruppur and its Ethical Implications\" Ph.D. Thesis, Dept. of Zoology. University of Madras. Chennai. pp 16-23 [13] Janakarajan S (1994) \"Trading in Ground Water: A Source of Power and Accumulation\" Working Paper No.123, Madras Institute of Development Studies, Chennai. pp 56-65 [14] Morgan, J.J & Werner, S. (1970). “Aquatic Chemistry, An introduction Emphasizing Chemical Equlibriam in Natural Waters”. John Wiley & Sons, Inc, New York,pp 112-117 [15] MSE (Madras School of Economics). (2002). “Environmental impact of industrial effluents in Noyyal river basin”, Final report. Submitted to: Water Resources research fund institute for water studies, Chennai, India.pp45-56. [16] Madras Institute of Development Studies (1997) \"Tamilnadu\'s Urban Environmental Challenges: A Study of Eight Secondary Cities/Towns\", Chennai. pp 75-98 [17] Madras School of Economics (1998) \"Economic Analysis of Environmental Problems in Bleaching and Dyeing Units and Suggestions for Policy Action\", Chennai. pp 55-66 [18] Markandya Anil (1992) \"The Earthscan Reader in Environmental Economics\", Earthscan Publication Ltd. London. pp 3-7 [19] Markandya Anil (1992) \"The Value of the Environment: A State of Art Survey\" in Anil Markandya\'s \'The Earthscan Reader in Environmental Economics\') London. pp 121-147 [20] Markandya Anil (1997) \"Employment and Environmental Protection: The Tradeoffs in an Economy in Transitions\", Development Discussion Paper 595, Harvard University. Pp 152- 162 [21] Master Plan for Tiruppur Local Planning Area (2000), Prepared Town and country Planning Department, Tiruppur. Pp 57-100 [22] Madras Institute of Development Studies (1 997) \"The Knitwear Cluster of Tiruppur: A Potential industrial District?” Chennai. pp 102-111 [23] Nelliyat Prakash (1995) \"Environmental Aspects of Bleaching and Dyeing Industries in Tiruppur\", Seminar report on Environmental Aspects of Water Resources Management and Development, CWRDM, Calicut. pp 121-147 [24] Palanisamy K (1995)\"Rural and Urban Interaction: Water Market in Tiruppur\", Paper presented in Second Water Conference, Anna University, Chennai. pp 13-27 [25] Palanivel M and Raja Guru P (1999), \"The Present Status of The River Noyyal\" Proceedings of Workshop on environmental Status of Rivers in Tamilnadu, Bharathiyar University, Coimbatore. pp 53-74 [26] Senthilnathan S. & Azeez P.A. (1999). “Influence of dyeing and bleaching industries on ground water of Tirupur, Tamil Nadu, India”. Bull Environ Contam Toxicol,pp67-68. [27] School of Architecture and Planning (J 990) \"Development Plan for Tiruppur Town\", Anna University. Chennai . pp 89-90 [28] Schrmm Gunder (1989) \"Environmental Management and Economic Development\", World Bank . pp 96-112 [29] Serafyel Salash and Ernst Lutz (l 992) \"Environment and Resource Accounting\" in Yusuf Ahmad \'Environmental Accounting for Sustainable Development. pp 45-56 [30] Shanmugam (1995) \"Industrial Growth in Tiruppur\", Report on Sharing Water Resources: 1st Policy Advisory Committee Meeting\", SIDA Report, MIDS. pp 152-172 [31] Shuji Uchikawa (1998)\" Indian Textile Industry; State Policy, Libralisation and Growth\"Published by Ajay Kumar Jain; Replika Press Pvt. Ltd. [32] Vasanthi(2002), NODR folder, Noyyal Orathupalayam Dam Report, Perundurai and Kangayam Taluk, Periyar District, Folder translated from Tamil to English made by at WTC Prabakaran, J. & Thangavel, P. 2002.pp 56-90 [33] Water Resource Organisation (2000) ,“Colour removal from textile industrial effluents by bioremediation and reuse of treated effluents for agriculture”. Environmental Cell Divisioin., Department of Environmental Sciences, Tamil Nadu Agricultural University, Coimbatore.pp23-25 [34] Water used in Textile Processing and Treatment of Textile Processing Effluents ; Manivasakam (1995) Water Resource Organization (2000) ,\"Colour removal from textile industrial effluents by bioremediation and reuse of treated effluents for agriculture\". Environmental Cell Divisioin., Department of Environmental Sciences, Tamil Nadu Agricultural University, Coimbatore.pp23-25 [35] Yadav, B.R. & Khera MS. (1994). “Analysis of Irrigation Waters. In; Methods of Analysis of Soils, Plants, Waters and Fertilisers”.. Fertiliser Development and Consultation Organisation.pp12-14 [36] Environmental Awarness on Quality Management of Irrigation Water, Edited by Lakshmanaperumalsamy and Krishnaraj, Department of Environmental Sciences, Bharathiyar University, Coimbatore. pp 5-10 Internet Resources [1] http://agbiopubs.sdstate.edu/articles/FS903 .pdf. 2004-06-08 Earthdaynetwork. Water for Life, http://www.ealihday.netlgoals/waterlbackground.asp [2] http://www.tirupur.net/history.htm. 2004-02-10 KEMI, Kemikalieinspektionen. 2004. [3] http://prio.kemi.se/templates/PRIOEng page . 993.aspx. [4] http://hinduwebsite.com/health/water.htm, 2003-04 [5] http://www.who.intlwater_ sanitation_ healthldwq/enJ2edvoll c.pdf, WHO 2nd ed., Guidelines for Drinking Water Quality, 2 nd edition, Chemical aspects [6] http://www.who.int/docstore/water_sanitation health/GDWQ/Updatingldraftguid el/draftchapl0.htm ,WHO 3rd ed.,Guidelines fo Drinking water Quality, Third edition, 2003, Acceptabilityaspects [7] Principle of Environmental Impact Assessment Best Practice (Pd£). International Association for Impact Assessment (1999). [8] Wang, Alex (2007-02-05). Environmental protection in China: the role of law. [9] Gu, Lin (2005-09-29). China Improves Enforcement of Environmental Laws. China Features. [10] Watson, Michael (November 13- 15, 2003). Environmental Impact Assessment and European Community Law. XIV Intemational Conference \"Danube-River of Cooperation\" .
Copyright
Copyright © 2024 Ravikumar P, Chandrasekar V, G Bhaskaran. This is an open access article distributed under the Creative Commons Attribution License, which permits unrestricted use, distribution, and reproduction in any medium, provided the original work is properly cited.

Download Paper
Paper Id : IJRASET58719
Publish Date : 2024-03-01
ISSN : 2321-9653
Publisher Name : IJRASET
DOI Link : Click Here
 Submit Paper Online

