Ijraset Journal For Research in Applied Science and Engineering Technology
- Home / Ijraset
- On This Page
- Abstract
- Introduction
- Conclusion
- References
- Copyright
Optical Interferometers and Its Applications in the Field of Medicine
Authors: Muhammad Arif Bin Jalil
DOI Link: https://doi.org/10.22214/ijraset.2024.63323
Certificate: View Certificate
Abstract
A series of methods known as interferometry uses the phenomenon of interference which is typically caused by the superimposition of electromagnetic waves to gather information [1]. In the fields of astronomy, fibre optics, engineering metrology, optical metrology, oceanography, seismology, quantum mechanics, nuclear and particle physics, plasma physics, remote sensing, biomolecular interactions, surface profiling, microfluidics, mechanical stress/strain measurement, velocimetry, and optometry, interferometry is a valuable tool of investigation.[2]. Optical interferometry provides sensitive metrology capabilities for measuring biomolecules, subcellular components, cells, and tissues in biology and medicine.
Introduction
I. INTRODUCTION
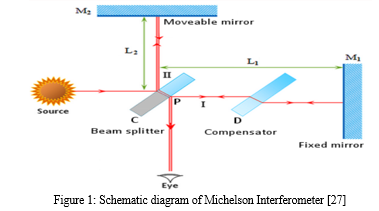
A phenomenon known as wave interference is exploited in the measurement method known as interferometry (of radio, light, or sound waves). Both the waves themselves and the materials they interact with can have certain properties measured. Furthermore, methods for studying displacement changes using light waves are referred to as interferometry. A popular method in precision machining for mechanical stage motion control and calibration is displacement measurement interferometry[1]. An interference pattern can be created when two light beams are used, usually by splitting one beam into two. These two beams can then overlap one another at that point. Due to the extremely small wavelength of visible light, even minute variations in the optical paths that is, the distances between the two beams can be identified since they will result in discernible shifts in the interference pattern. As a result, optical interferometry has been used for measurement purposes for more than a century. Later on, after lasers were invented, its accuracy was increased.[1]Albert A. Michelson created the first interferometer in the 1880s, which popularised the idea of light interference as a practical measuring tool. Interferometry still relies heavily on the fundamental ideas of the Michelson interferometer, despite advancements in technology and measurement precision over time.[1] A beamsplitter, also referred to as a half-silvered mirror, is added to two mirrors to create a Michelson interferometer. The partially reflecting half-silvered mirror/beam splitter divides light into two beams with distinct optical pathways; one beam is directed towards mirror 1 and the other towards mirror 2. These beams are reflected back at the mirrors before they reach the detector, where they recombine at the beam splitter. The interference fringe pattern is caused by the phase mismatch between the two trajectories that these two beams travel. Depending on which measurement the interferometer was being used for, the detector then assesses this pattern to ascertain the wave characteristics, material properties, or displacement of one of the mirrors.[1]
The XL-80 laser helps create a single, very stable wavelength source, which is necessary to produce an interference pattern with great precision in terms of distinct fringes.There are several possible arrangements for the interferometer based on Michelson's theory, but the linear form is the most straightforward.The retroreflectors, which are two mirrors in the Michelson interferometer of the XL-80 laser system, are a kind of prism that returns incoming light to its original path perpendicularly. One of them is fastened to the reference arm's beam splitter. When its distance from the beam splitter changes, the other retroreflector produces the variable length measurement arm. [1]The laser beam (1) leaves the XL-80 laser head and splits into a transmitted beam and a reflected beam at the polarising beam splitter. Before they reach the detector, these beams are recombined at the beam splitter after being reflected back from the two retroreflectors. When the beams from the reference and measurement arms recombine at the beam splitter, the employment of retroreflectors guarantees that the beams are parallel. The recombined beam exhibits constructive or destructive interference upon reaching the detector. The two beams are in phase during constructive interference, and their peaks reinforce one another to produce a brilliant fringe. The two beams are in phase during constructive interference, and their peaks reinforce one another to produce a brilliant fringe. Contrarily, destructive interference happens when the beams are out of phase, cancelling out each other's troughs and producing a dark fringe.[1]
It is possible to observe the interference between these two beams thanks to the detector's optical signal processing. The relative phases of the two beams are altered by the measurement arm shift. The intensity of the recombined light varies periodically as a result of this constructive and destructive interference cycle. Every time the measurement arm/retroreflector is moved by 316.5 nm, or half the laser wavelength, there is a single cycle of intensity variation from light to dark to light. This results in a 633 nm optical path change, which is the wavelength of the laser. As such, the movement is quantified by using the following formula to ascertain the number of cycles [1]: d = Nλ/2
where N is the number of crossing fringes, λ is the laser's wavelength (0.633 microns), and d is the displacement (measured in microns). Phase interpolation is used during these cycles to attain the enhanced resolution of 1 nm.
The stability and precision of the laser unit depend on how well the wavelength of the laser beam is understood; this has no bearing on the accuracy of the linear positional measurements. The refractive index of the air the laser beam travels through, which is influenced by the air's temperature, pressure, and relative humidity, determines the operating wavelength of the beam. For this reason, any changes in these parameters require the beam's wavelength to be modified, or corrected for.[1]
II. BASIC PRINCIPLES OF INTERFEROMETRY
By combining waves in a way that results in a combination that has a meaningful property that is diagnostic of the initial condition of the waves, interferometry makes use of the idea of superposition. This is effective because the phase difference between two waves that combine at the same frequency determines the final intensity pattern: waves that are in phase will interfere constructively, whereas waves that are out of phase will interfere destructively. An intermediate intensity pattern on waves that are neither fully in phase nor out of phase can be utilised to calculate the relative phase difference between them. Light or another type of electromagnetic wave is used by the majority of interferometers.[2].
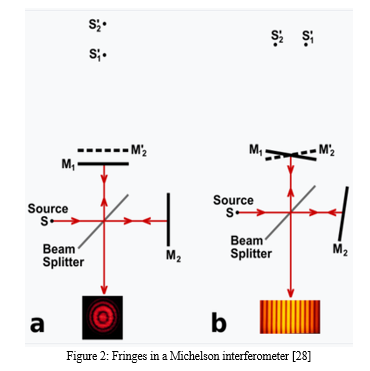
A beam splitter, which is essentially a partially reflecting mirror, divides an incoming coherent light beam into two identical beams in a Michelson interferometer. Before reaching a detector, each of these beams takes a distinct path that is merged again. A phase difference arises between each beam as a result of the route difference, or the variation in the distance travelled by each beam. The interference pattern that develops between the initially identical waves is the result of this imposed phase difference.[2].Any change in phase along the paths can be detected by the phase difference if a single beam has been split into two paths. This could be due to a shift in the refractive index along the way or a physical change in the length of the path itself [2]. The observer can see mirror M1 directly via the beam splitter and the reflected image M'2 of mirror M2, as shown in Figure 2a and 2b. The fringes can be explained as the outcome of light from the two virtual pictures of the original source S, S'1 and S'2, interfering with each other. The type of light source and the exact placement of the mirrors and beam splitter determine the interference pattern's properties. When the optical elements in Figure 2a are orientated to align S'1 and S'2 with the observer, an interference pattern with circles centred on the normal to M1 and M'2 is produced. The interference fringes will typically take the form of conic sections (hyperbolas) if M1 and M'2 are inclined relative to one another, as seen in Figure 2b. However, if M1 and M'2 overlap, the fringes along the axis will be parallel, straight, and evenly spaced. The fringes in Figure 2a must be viewed via a telescope with the focus set to infinity, but the fringes in Figure 2b will be localised on the mirrors if S is an extended source as opposed to a point source as shown[2]. If white light is used, a pattern of coloured fringes will appear.[2]. The amount of phase inversions that the two beams encounter as they move through the optical system determines whether the central fringe, which represents an equal path length, is light or dark[2].
III. INTERFEROMETRIC TECHNIQUES
Interference between two beams at the same wavelength or carrier frequency happens in homodyne detection. The intensity of the light on the detector varies according to the phase difference between the two beams. After these two beams are mixed, the light's final intensity is measured, or the interference fringe pattern can be seen or noted.[4] This includes the majority of the interferometers covered in this study.When using an active mixer, the heterodyne technique can be used to: (1) shift an input signal into a new frequency range; and (2) amp up a weak input signal. A local oscillator (LO) produces a strong reference frequency f2, which is combined with a weak input signal of frequency f1. The input signals undergo nonlinear combination to produce two new signals: one at the difference between the two frequencies, f1 − f2, and the other at the sum f1 + f2 of the two frequencies.We refer to these new frequencies as heterodynes. Usually, just one of the new frequencies is needed, and the other signal is removed by filtering it from the mixer's output. The product of the input signals' amplitudes will determine the intensity of the output signal [4].
Developed in 1918 by American inventor Edwin Howard Armstrong, the superheterodyne receiver is the most significant and extensively utilised implementation of the heterodyne technology. This circuit uses the heterodyne technique to convert the incoming radio frequency signal from the antenna to a lower fixed frequency signal known as the intermediate frequency (IF). The LO and incoming radio frequency signal are combined. Before being applied to a detector that separates the audio signal and sends it to the loudspeaker, this IF is amplified and filtered.[5] The heterodyne technology is extended to higher frequencies by optical heterodyne detection.[4] Although optical heterodyne interferometry is often carried out at a single spot, widefield operations are also feasible[6].The reference beam and sample beam follow different pathways in a double path interferometer. The Mach-Zehnder interferometer, the Twyman-Green interferometer, and the Michelson interferometer are some examples. The sample beam is disturbed by interaction with the sample being tested, and it is then recombined with the reference beam to produce an interpretable interference pattern.[2]. An interferometer belonging to the common path interferometer class is one in which the reference beam and sample beam follow the same path. The Sagnac interferometer, fibre optic gyroscope, point diffraction interferometer, and lateral shearing interferometer are all shown in Figure 3,Figure 4 and Figure 5. The Zernike phase contrast microscope, Fresnel's biprism, the zero-area Sagnac, and the scatterplate interferometer are more instances of common path interferometers [7].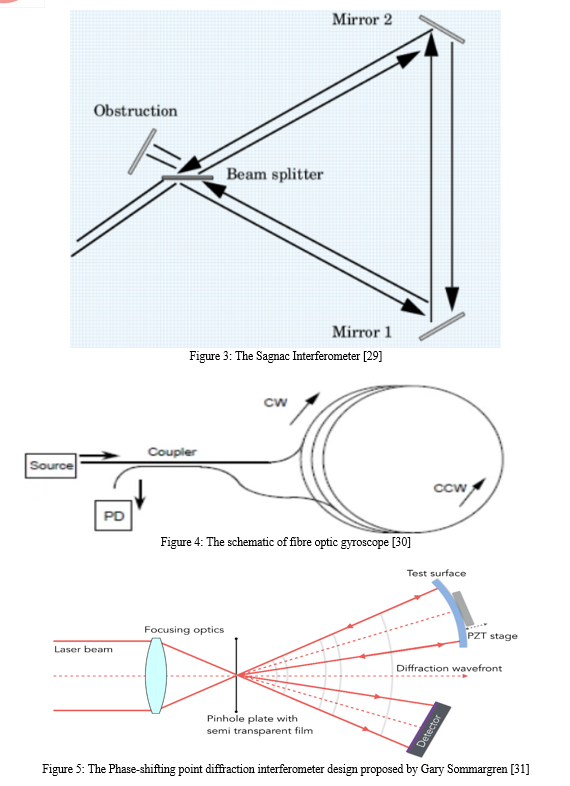
IV. TYPES OF INTERFEROMETERS
A wavefront splitting interferometer splits a spatially coherent light wavefront that emerges from a point or narrow slit, allowing the two components of the wavefront to follow separate trajectories before recombining.[8] Lloyd's mirror and Young's interference experiment are shown in Fig. 5. The Rayleigh interferometer, the Billet Bi-Lens, and the Fresnel biprism are other types of wavefront splitting interferometers.[9]Young's interference experiment in 1803, for example, significantly contributed to the wave theory of light's widespread adoption. When using white light in Young's experiment, the outcome is a symmetrical pattern of coloured fringes with decreasing intensity surrounding a white core band of constructive interference that corresponds to an identical route length from the two slits. Young's experiment has been carried out using continuous electromagnetic radiation as well as individual photons, electrons, and buckyball molecules big enough to be seen under an electron microscope.By combining light from a source's direct light which is the blue lines and light from the source's reflected image which is the red lines from a mirror held at grazing incidence, Lloyd's mirror creates interference fringes. The end effect is an uneven fringe pattern. Rather than being light, the band of equal path length that is closest to the mirror is dark. Humphrey Lloyd explained this effect in 1834 as evidence that a front-surface reflected beam has an inverted phase.[14][15] An amplitude splitting interferometer splits the input wave's amplitude into discrete beams that are then split and recombined using a partial reflector. The Fizeau, interferometer are shown in Figure 6. The Michelson, Twyman-Green, Laser Unequal Path, and Linnik interferometers are further types of amplitude splitting interferometers [16].
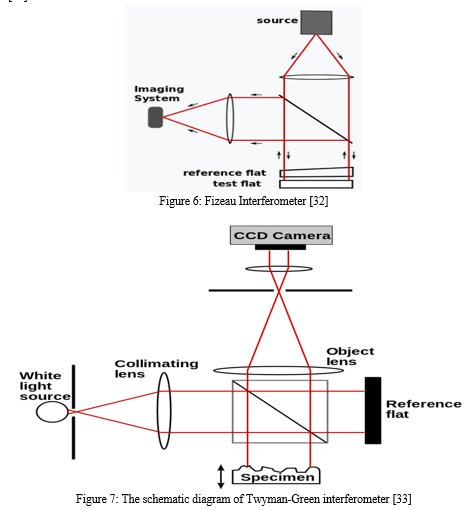
An example of how the Fizeau interferometer might be configured to test an optical flat is shown. On top of the flat under test is a precisely-figured reference flat, spaced apart by thin spacers. To avoid interference fringes on the flat's rear surface, the reference flat is very slightly beveled—just a little amount of beveling is required. It is possible to tilt the two flats in relation to one another by separating the test and reference flats. The tilt can be adjusted to regulate the direction and spacing of the fringes, resulting in a series of roughly parallel fringes that are easy to interpret rather than a complicated swirl of contour lines. The tilt adds a controlled phase gradient to the fringe pattern. But collimating the illuminating light is necessary to separate the plates. The two flats in Fig. 6 are illuminated by a collimated monochromatic light beam, and the fringes may be seen on-axis thanks to a beam splitter.[17][18] Compared to the Michelson interferometer, the Mach–Zehnder interferometer is a more flexible device. The fringes can be positioned to be localised in any desired plane, and each of the well-separated light streams is only crossed once.[2]. In order to take pictures of the fringes and the test object together, they are usually adjusted to lie in the same plane. If it is determined to create fringes in white light, then extreme caution must be used to equalise the optical paths in order to prevent fringes from being apparent because white light has a restricted coherence length on the order of micrometres. To match the test cell, a compensating cell would be positioned in the reference beam's path. Additionally take note of the beam splitters' exact alignment. The test and reference beams would travel through an identical amount of glass if the beam splitters' reflecting surfaces were angled in that manner. The test and reference beams encounter two front-surface reflections apiece in this configuration, leading to an equal number of phase inversions. As a result, a white light fringe of constructive interference is produced by light travelling the same optical path length in the test and reference beams.[19][20]
A pair of partially silvered glass optical flats with their silvered surfaces facing each other and positioned several millimetres to centimetres apart form the core of the Fabry-Pérot interferometer. Alternatively, a transparent plate with two parallel reflecting surfaces is used in a Fabry–Pérot etalon.[2].
The flats are faintly bevelled, just like the Fizeau interferometer. Typically, a diffuse source positioned at the collimating lens's focal plane provides light for the system. If the paired flats were absent, all light generated from point A going through the optical system would be focused at point A', which is what an inverted image of the source would look like when a focusing lens is utilised.Figure 6 shows the trail of a single ray that originates at point A on the source. The focusing lens gathers the many transmitted rays that are produced as the ray travels through the paired flats and brings them to point A' on the screen. When seen in its entirety, the interference pattern resembles a collection of concentric rings. The reflectivity of the flats determines how crisp the rings are. A set of thin, bright rings against a dark background is produced by monochromatic light if the reflectivity is high, which leads to a high Q factor which is high finesse [21]. The low-finesse image in Figure 6 corresponds to unsilvered surfaces with a reflectivity of 0.04, while the high-finesse image has a reflectance of 0.95.
Only when setting up their apparatus in the beginning, Michelson and Morley (1887)[22] and other early experimentalists utilising interferometric techniques to measure the properties of the luminiferous aether utilised monochromatic light; for the actual measurements, they always switched to white light.
The rationale is that visual records of the measurements were made. A fringe pattern that is uniform would be produced by monochromatic light. Even though the interferometer might be set up in a basement, experimentalists suffered with constant fringe drift since they lacked current techniques of controlling the surrounding temperature. Sometimes distant thunderstorms or passing horse traffic would cause the fringes to disappear, making it easy for an observer to "get lost" when the fringes became visible again. White light's limited coherence length made it difficult to position the equipment, but its benefits ,a unique coloured fringe pattern is far surpassed the challenges[23].
V. APPLICATIONS IN BIOLOGY AND MEDICINE
When used in biology and medicine, optical interferometry offers sensitive metrology capabilities for measuring biomolecules, subcellular elements, cells, and tissues.[10] Since local molecular polarizability and electromagnetic fields interact directly, label-free biosensors often use interferometry instead of fluorescent tags or nanoparticle markers. Cellular interferometry is similar to phase-contrast microscopy in certain ways, but it encompasses a far wider range of phase-sensitive optical setups that rely on optical interference caused by diffraction and refraction among cellular elements.
Phase-sensitive gating (optical coherence tomography) and phase-sensitive fluctuation spectroscopy can be used to image subtle structural and dynamical properties at the tissue scale due to partially-coherent forward-scattered light propagation through the micro aberrations and heterogeneity of tissue structure.
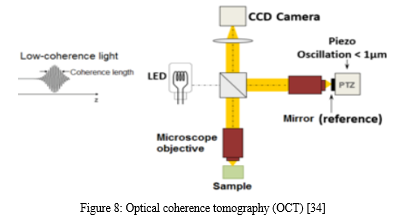
Low-coherence interferometry is used in optical coherence tomography (OCT), a medical imaging modality that allows tomographic visualisation of interior tissue microstructures. A Michelson interferometer is the central component of a conventional OCT system. The tissue sample is the focus of one interferometer arm, which scans it in an X-Y longitudinal raster pattern. A reference mirror is used to reflect light off the opposite interferometer arm. The reference's and the tissue sample's reflected light are mixed together.Only a limited depth of sample is visible with an interferometric signal due to the low coherence of the light source. As a result, X-Y scanning captures the sample one thin optical slice at a time. A complete three-dimensional reconstruction of the tissue image can be achieved by carrying out numerous scans and shifting the reference mirror in between.[18][19] The goal of recent developments has been to bring together the range ability of low-coherence interferometry and the nanoscale phase retrieval of coherent interferometry [26].
In biology and medicine, phase contrast and differential interference contrast (DIC) microscopy are crucial instruments. Under basic bright field light, the internal organelles of the majority of mammalian cells and single-celled organisms are nearly undetectable. Staining the specimens can reveal these structures, but the process takes a long time and destroys the cells. Phase contrast and DIC microscopes make it possible to study living, unstained cells.[20] DIC is also useful in non-biological fields, such as planar silicon semiconductor processing analysis. Scattering light is used in angle-resolved low-coherence interferometry (a/LCI) to determine the sizes of subcellular objects, such as cell nuclei. This makes it possible to combine density data with interferometry depth measurements. Numerous associations have been discovered between the measures of subcellular objects and the condition of tissue health. For instance, it has been discovered that the average size of cell nuclei increases when tissue transforms from healthy to malignant [21][22].
Phase-contrast X-ray imaging encompasses a range of methods that examine soft tissues by utilising the phase information of a coherent X-ray beam. (For an introduction to phase-contrast x-ray imaging, see an elementary discussion). Please refer to Phase-contrast X-ray imaging for a more thorough overview. It is now a widely used technique in many biological and medical research to visualise cellular and histological features. For x-ray phase-contrast imaging, a number of technologies are employed. These technologies work on the basis of various concepts to transform phase variations in the x-rays that emerge from an object into intensity variations.[23–24] These consist of x-ray interferometry, moiré-based far-field interferometry, talbot interferometry, propagation-based phase contrast, refraction-enhanced imaging, and moiré-based far-field interferometry.[25] Compared to standard absorption-contrast x-ray imaging, these techniques offer better contrast, which enables the visualisation of finer details. One drawback of these techniques is that they need more advanced equipment, including high resolution x-ray detectors, x-ray optics, or synchrotron or microfocus x-ray sources.
Conclusion
As a conclusion , interferometry, which makes use of the interference phenomena, which is usually brought on by the superimposition of electromagnetic waves.[1] Interferometry is a useful investigative tool in the following fields: astronomy, fibre optics, engineering metrology, optical metrology, oceanography, seismology, quantum mechanics, nuclear and particle physics, plasma physics, remote sensing, biomolecular interactions, surface profiling, microfluidics, mechanical stress/strain measurement, velocimetry, and optometry.[2]. When used in biology and medicine, optical interferometry offers sensitive metrology capabilities for measuring biomolecules, subcellular elements, cells, and tissues.
References
[1] https://www.renishaw.com/en/interferometry-explained--7854 [2] Hariharan, P. (2007). Basics of Interferometry. Elsevier Inc.. ISBN 0-12-373589-0. [3] Patel, R.; Achamfuo-Yeboah, S.; Light R.; Clark M. (2014). \"Widefield two laser interferometry\". Optics Express 22 (22): 27094-27101. [4] Paschotta, Rüdiger. \"Optical Heterodyne Detection\". RP Photonics Consulting GmbH. Retrieved 1 April 2012. [5] Poole, Ian. \"The superhet or superheterodyne radio receiver\". Radio-Electronics.com. Retrieved 22 June 2012. [6] Patel, R.; Achamfuo-Yeboah, S.; Light R.; Clark M. (2011). \"Widefield heterodyne interferometry using a custom CMOS modulated light camera\". Optics Express 19 (24): 24546-24556. [7] Mallick, S.; Malacara, D. (2007). \"Common-Path Interferometers\". Optical Shop Testing. pp. 97. doi:10.1002/9780470135976.ch3. ISBN 9780470135976. [8] Verma, R.K. (2008). Wave Optics. Discovery Publishing House. pp. 97–110. ISBN 81-8356-114-4. [9] \"Interferential Devices – Introduction\". OPI – Optique pour l\'Ingénieur. Retrieved 1 April 2012. [10] Nolte, David D. (2012). Optical Interferometry for Biology and Medicine. Springer. pp. 17–26. ISBN 1-4614-0889-X. [11] Guideline for Use of Fizeau Interferometer in Optical Testing\". NASA. Retrieved 8 April 2012. [12] Interferential devices – Fizeau Interferometer\". Optique pour l\'Ingénieur.. Retrieved 8 April 2012. [13] Zetie, K.P.; Adams, S.F.. \"How does a Mach–Zehnder interferometer work?\". Physics Department, Westminster School, London. Retrieved 8 April 2012. [14] Betzler, Klaus. \"Fabry-Perot Interferometer\". Fachbereich Physik, Universität Osnabrück. Retrieved 8 April 2012. [15] Michelson, A.A.; Morley, E.W. (1887). \"On the Relative Motion of the Earth and the Luminiferous Ether\". American Journal of Science 34 (203): 333–345. doi:10.2475/ajs.s3-34.203.333. [16] Miller, Dayton C. (1933). \"The Ether-Drift Experiment and the Determination of the Absolute Motion of the Earth\". Reviews of Modern Physics 5 (3): 203–242. doi:10.1103/RevModPhys.5.203. Bibcode: 1933RvMP....5..203M. \"White light fringes were chosen for the observations because they consist of a small group of fringes having a central, sharply defined black fringe which forms a permanent zero reference mark for all readings.\". [17] Nolte, David D. (2012). Optical Interferometry for Biology and Medicine. Springer. ISBN 1-4614-0889-X. [18] Huang, D.; Swanson, E.A.; Lin, C.P.; Schuman, J.S.; Stinson, W.G.; Chang, W.; Hee, M.R.; Flotte, T. et al. (1991). \"Optical Coherence Tomography\". Science 254 (5035): 1178–81. doi:10.1126/science.1957169. PMID 1957169. PMC 4638169. Bibcode: 1991Sci...254.1178H. Retrieved 10 April 2012. [19] Fercher, A.F. (1996). \"Optical Coherence Tomography\". Journal of Biomedical Optics 1 (2): 157–173. doi:10.1117/12.231361. Bibcode: 1996JBO.....1..157F. Retrieved 10 April 2012. [20] Lang, Walter. \"Nomarski Differential Interference-Contrast Microscopy\". Carl Zeiss, Oberkochen. Retrieved 10 April 2012. [21] Wax, A.; Pyhtila, J. W.; Graf, R. N.; Nines, R.; Boone, C. W.; Dasari, R. R.; Feld, M. S.; Steele, V. E. et al. (2005). \"Prospective grading of neoplastic change in rat esophagus epithelium using angle-resolved low-coherence interferometry\". Journal of Biomedical Optics 10 (5): 051604. doi:10.1117/1.2102767. PMID 16292952. Bibcode: 2005JBO....10e1604W. [22] Pyhtila, J. W.; Chalut, K. J.; Boyer, J. D.; Keener, J.; d\'Amico, T.; Gottfried, M.; Gress, F.; Wax, A. (2007). \"In situ detection of nuclear atypia in Barrett\'s esophagus by using angle-resolved low-coherence interferometry\". Gastrointestinal Endoscopy 65 (3): 487–491. doi:10.1016/j.gie.2006.10.016. PMID 17321252. [23] Fitzgerald, Richard (2000). \"Phase-sensitive x-ray imaging\". Physics Today 53 (7): 23. doi:10.1063/1.1292471. Bibcode: 2000PhT....53g..23F. [24] David, C; Nohammer, B; Solak, H H; Ziegler E (2002). \"Differential x-ray phase contrast imaging using a shearing interferometer\". Applied Physics Letters 81 (17): 3287–3289. doi:10.1063/1.1516611. Bibcode: 2002ApPhL..81.3287D. [25] Momose, A; Takeda, T; Itai, Y; Hirano, K (1996). \"Phase-contrast X-ray computed tomography for observing biological soft tissues\". Nature Medicine 2 (4): 473–475. doi:10.1038/nm0496-473. PMID 8597962. [26] Olszak, A.G.; Schmit, J.. \"Interferometry: Technology and Applications\". Bruker. Retrieved 1 April 2012. [27] http://physical-optics.blogspot.com/2011/06/michelsons-interferometer.html [28] https://handwiki.org/wiki/Astronomy:Interferometry [29] https://doc.comsol.com/6.0/doc/com.comsol.help.models.roptics.sagnac_interferometer/sagnac_interferometer.html [30] https://www.rfwireless-world.com/Terminology/Advantages-and-Disadvantages-of-Fiber-Optic-Gyroscope.html [31] Otaki, Katsura; Bonneau, Florian; Ichihara, Yutaka (1999-01-01). \"Absolute measurement of a spherical surface using a point diffraction interferometer\". Optical Engineering for Sensing and Nanotechnology (ICOSN \'99). 3740: 602–605. Bibcode:1999SPIE.3740..602O. doi:10.1117/12.347755. S2CID 119631152 [32] https://en.wikipedia.org/wiki/Fizeau_interferometer [33] https://en.m.wikipedia.org/wiki/File:Twyman-Green_interferometer_set_up_as_white_light_scanner.svg [34] https://en.wikipedia.org/wiki/Optical_coherence_tomography
Copyright
Copyright © 2024 Muhammad Arif Bin Jalil. This is an open access article distributed under the Creative Commons Attribution License, which permits unrestricted use, distribution, and reproduction in any medium, provided the original work is properly cited.

Download Paper
Paper Id : IJRASET63323
Publish Date : 2024-06-16
ISSN : 2321-9653
Publisher Name : IJRASET
DOI Link : Click Here
 Submit Paper Online

