Ijraset Journal For Research in Applied Science and Engineering Technology
- Home / Ijraset
- On This Page
- Abstract
- Introduction
- Conclusion
- References
- Copyright
Optimizing IOT Network Performance: A Study on Low-Power Wide-Area Network (LPWAN) Technologies for Smart City Applications
Authors: Dr. Diwakar Ramanuj Tripathi, Bharati Sitaram Kuthe
DOI Link: https://doi.org/10.22214/ijraset.2024.64514
Certificate: View Certificate
Abstract
This research explores with a specific focus on smart city applications, how to optimise the execution of Web of Things (IoT) networks by utilising breakthroughs in Low-Powered Wide Area Networks (LPWAN). As IoT devices proliferate and generate vast amounts of data, having a competent network becomes essential, especially when dealing with low device thickness and limited power availability. This analysis provides a detailed energy consumption model tailored to LoRaWAN, based on a deeper understanding of its functional components in Internet of Things scenarios. The review uses MATLAB for replication and looks at two clear scenarios: the standard allocation of spreading factors without optimisation and an improved method that uses particle swarm optimisation (PSO) for dynamic spreading factor work. The results show that the network energy consumption dropped significantly, from 6.3997×10^ (- 17) Joules to 2.5230×10^(- 17) Joules, along with increased throughput, decreased parcel misfortune, and decreased idleness. Through a detailed analysis of several parameters, such as network density and data transfer efficiency, this study demonstrates the feasibility of the suggested optimisation model in terms of improving battery efficiency and overall network performance. Finally, the findings demonstrate how efficient LPWAN systems may provide robust and useful IoT environments, which are essential for the successful implementation of smart city initiatives.
Introduction
I. INTRODUCTION
The Internet of Things' (IoT) quick development has changed how cities operate by making it possible for infrastructure, systems, and gadgets to communicate seamlessly with one another. IoT networks provide real-time data sharing between sensors, devices, and central systems in smart cities, enabling effective resource and service management. Robust IoT infrastructures are essential for applications like traffic control, environmental monitoring, smart energy grids, and public safety. However, maintaining effective network performance becomes more difficult as the number of connected devices in these metropolitan contexts increases. Optimising IoT networks to meet the growing needs of scalability, long-range connectivity, and power efficiency is one of the most urgent problems.
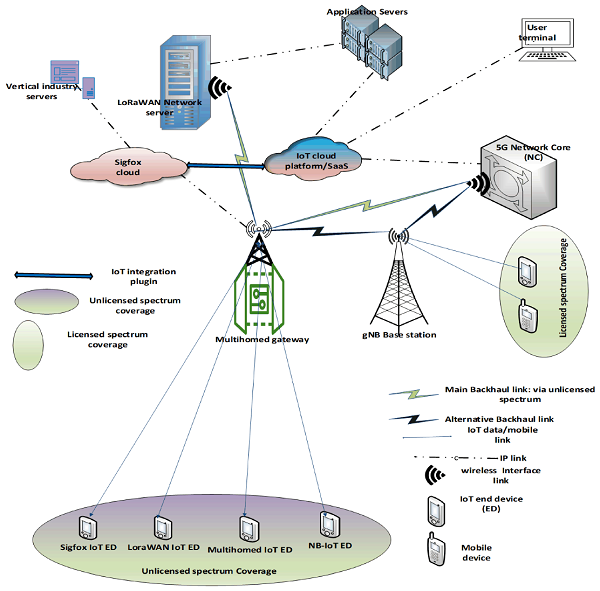
Figure 1: LPWANs for Coexistence and Diverse IoT Applications in Smart Cities
LPWANs, or low-power wide-area networks, have become a crucial tool for addressing these issues. LoRaWAN, Sigfox, and Narrowband IoT (NB-IoT) are examples of LPWAN technologies that are intended to give IoT devices in smart cities low-power, long-range communication. Compared to typical wireless networks, these technologies provide a variety of benefits, including as lower power consumption, longer battery life, and the capacity to link a huge number of devices across a wide geographic region. Efficient utilisation of energy and spectrum resources is essential for smart cities, since they house a multiplicity of devices serving diverse purposes. This ensures sustainable and scalable network operations.
Even with LPWAN technologies' bright future, network performance optimisation in the context of smart cities is still difficult. Problems include network coverage, scalability, data speed, interference, and scalability demand ongoing research and development. Above all, it is critical to ensure dependable and extensive connectivity while simultaneously improving energy economy and spectrum utilisation. Furthermore, there are advantages and disadvantages to integrating LPWAN with currently in use communication infrastructures like Wi-Fi and cellular networks when it comes to maximising IoT network performance for smart city applications.
A. Objectives of the study
- To provide a framework for improving LPWAN advancements in IoT networks for smart cities.
- To evaluate the energy efficiency, inclusivity, and adaptability of LPWAN innovations (LoRa, Sigfox, NB-IoT).
- To replicate how spreading factor techniques affect IoT network energy conservation.
- To suggest methods for enhancing network flexibility and range use.
- To validate the optimisation model by doing execution reviews and recreations.
II. LITERATURE REVIEW
Pham et al. (2019) present an overview of LPWAN technologies and their role in the deployment of smart city applications. Who highlight the importance of long-range communication, low power consumption, and effective bandwidth utilisation. The study evaluates the energy efficiency, coverage, and bandwidth of many well-known LPWAN technologies, including Sigfox, LoRa, and NB-IoT. These technologies are emphasised as being crucial for smart city applications where devices work in situations with limited power and communication, such as smart metering, environmental monitoring, and public infrastructure management. The authors also highlight upcoming difficulties, such as the requirement for improved security, scalability, and standardisation as LPWAN technologies are further included into the infrastructures of smart cities.
Fadeyi et al. (2022) concentrates on maximising spectrum utilisation for LPWAN in smart cities, suggesting the application of dynamic spectrum access (DSA) and cognitive radio (CR) technologies to improve LPWAN network performance. The study addresses how LPWAN devices might dynamically access underutilised spectrum bands to increase spectrum efficiency and decrease interference and congestion in densely populated metropolitan areas. The capacity of machine learning systems to forecast spectrum availability and instantly optimise network characteristics is also explored by the writers. The study notes the difficulties in deploying cognitive radio in LPWAN, especially with regard to the requirement for sophisticated hardware and legal frameworks for spectrum sharing, even if this strategy appears to have potential for increasing network efficiency.
Onumanyi et al. (2020) suggest integrating LPWAN with IoT and cognitive radio (CR) technology. The authors contend that constraints like interference and spectrum scarcity may be avoided by combining the low-power, long-range communication of LPWAN with the dynamic spectrum management of CR. They outline a framework for combining various technologies and emphasise the advantages of increased network stability, lower energy usage, and better spectrum utilisation. In addition, the study addresses real-world issues including making decisions in real-time while navigating the limitations of low-power Internet of Things devices and suggests blockchain as a means of safeguarding communications in these networks.
Chen et al. (2018) present Cognitive-LPWAN, a hybrid system that combines LPWAN with cognitive radio technology. The study highlights that although efficient, standard LPWAN networks are unable to dynamically adapt to shifting network circumstances, such as traffic volumes and spectrum availability. To tackle this issue, Cognitive-LPWAN integrates machine learning algorithms to enhance transmission power, frequency, and other parameters instantaneously. The authors show through simulations that Cognitive-LPWAN enhances data throughput, latency, and energy efficiency, making it appropriate for smart city applications such as environmental monitoring and intelligent transportation systems.
Verma et al. (2021) use a mathematical model that takes energy consumption, data transmission rates, and network latency into account while optimising LPWAN-based IoT networks for smart city applications.
The trade-offs associated with LPWAN network optimisation are highlighted in the article, including how to balance data speed, coverage, and energy efficiency. The authors propose that by shifting data processing from the cloud to local devices, methods like network coding and edge computing can improve network performance by lowering latency and congestion. In order to provide dependable and effective communication in the infrastructures of smart cities, this article provides insightful information on the optimisation of LPWAN networks.
III. RESEARCH METHODOLOGY
This section provides a detailed analysis of the IoT network taken into consideration for this investigation. It focusses on simulating the Internet of Things network using the LoRaWAN standard and provides a clear explanation of the limitations imposed on the model. With the right tools, the enhanced Low-Power Wide Area Network (LPWAN) is implemented.
A. The Research Framework
The goals of this study determine the examination system. Spreading factor allocation for various end hubs is incorporated into the plan and is implemented using the MATLAB network test system. The LoRaWAN convention is taken into consideration while recreating the Internet of Things, and end devices are assigned spreading factors throughout the network. Figure 2 shows the system of the suggested research model.
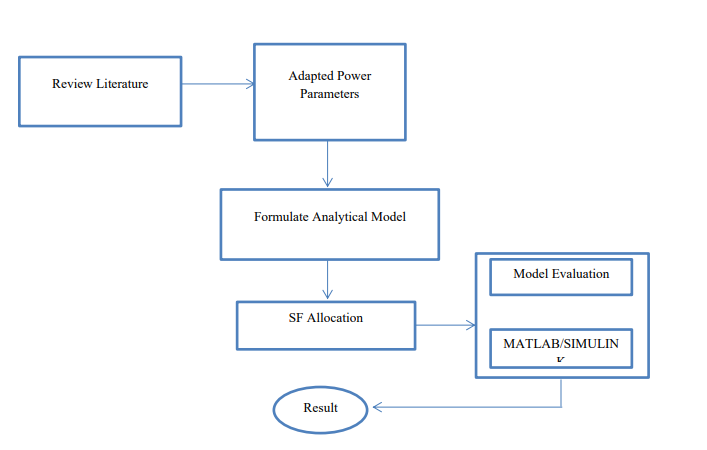
Figure 2: Model Structure of the Suggested Model
B. IoT Architecture
Several academics have looked at different IoT innovation strategy levels. Consider the following five levels of IoT design: application, middleware, network, business, and discernment. The authors point out that in order to obtain accurate data from IoT applications, IoT models should be specifically tailored to the unique requirements of IoT advancements. Selecting appropriate hardware and software is essential when considering the type of Internet of Things application. On the other hand, a four-layer Internet of Things architecture that consists of the following layers: usage, data handling, network foundation, and detection. Figure 3 illustrates the four-layer IoT configuration that was chosen for this investigation.
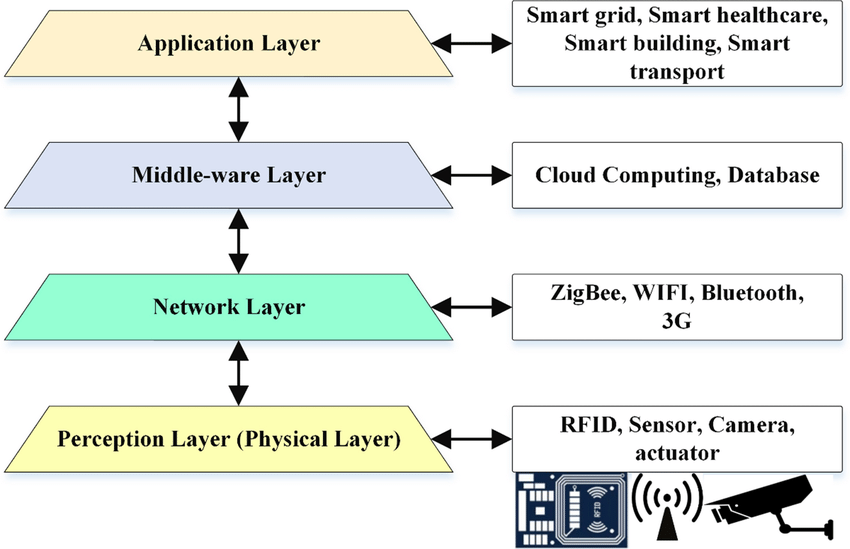
Figure 3: Four-Layer IoT Model
1) Sensing Layer
The layer responsible for detecting is accountable for gathering data from the climate. IoT networks are made up of smart label frameworks or sensors that can view their surroundings and communicate with other devices. These frameworks make utilisation of RFID or sensors, which have improved in adaptability and openness due to advancements in innovation detection. A General Remarkable Identifier (UUID) is assigned to every Internet of Things object, enabling easy online tracking.
2) Layer of Network Infrastructure
The network foundation layer manages the flow of data over wired or remote networks between the detecting and handling levels. It includes IT underpinnings such as corporate networks, healthcare networks, and transportation networks. Unlike the network layer of the OSI reference model, which routes information, this layer maintains distinct distant norms to provide constant availability. The network size, power consumption, and needed information transfer speed are taken into consideration while choosing the suitable convention.
3) Information Processing Layer
Data analysis, process visualisation, executive security, and device control are among the services offered by the data handling layer, which also oversees the board and information handling. This layer makes sure that the client's needs are met by offering effective support for all platforms.
4) Application Layer
Applications are included into the application layer, which also facilitates communication between clients and the framework. On the LPWAN passage or server side, it supports distributed computing, edge/mist figuring, and similar sublayers.
C. Parameters for the Implementation of the Proposed Model
Due to rapid mechanical advancements, the limits employed in the suggested model include both explicit and nonexclusive variables, which are essential for managing the test of connecting and networking various PC frameworks. The IoT architecture used in this analysis is consistent with the OSI reference model.
1) Generic Parameters
An Open System Interconnection (OSI) reference model is generally followed by heterogeneous devices on a network. IoT networks use the Internet Protocol (IP) standard to link various sensors and gadgets. An IoT architecture with four layers is used in this study. The Particle Swarm Optimisation (PSO) technique is used in the suggested model to simulate 50 nodes for distributing factor allocation over a 30 m x 20 m region. A 1% duty cycle is used in the simulation for all end devices in categories A, B, and C.
2) Specific Parameters
Carrier frequency, transmit power, spreading factor (SF), bandwidth (BW), and coding rate (CR) are examples of specific parameters. To maximise the physical performance of LoRa, these elements are essential. Three primary carrier frequencies are used by LoRa: 433 MHz, 868 MHz, and 915 MHz.
3) Spreading Factor (SF)
Symmetric spreading factors ranging from 7 to 12 are used by LoRa to modify the information rate and reach. Increased spreading factors increase range but decrease information rate, and vice versa. The feasible information rate is affected by the splitting of the spreading code into codes of different lengths. The spreading code retrieves input data at the receiver
.
Table 1: Spreading Factors and Corresponding Chip Length in LoRa
|
Spreading Factor |
Chip Length (2SF2) |
Length in Bits (2^SF) |
Length in Bytes (2^SF/8) |
|
7 |
150 |
128 |
16 |
|
8 |
300 |
270 |
33.75 |
|
9 |
500 |
512 |
64 |
|
10 |
950 |
1100 |
137.5 |
|
11 |
1800 |
2048 |
256 |
|
12 |
4200 |
4600 |
575 |
D. Proposed Energy Model
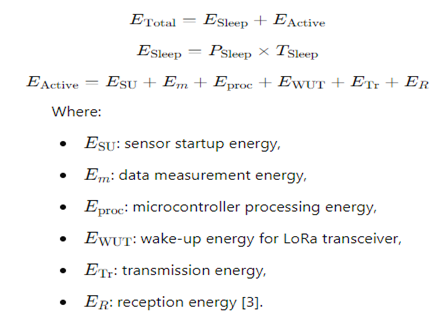
The energy consumption of end nodes consists of active and sleep modes. All devices, except the sensor unit (2V), are powered by 3.3V. The energy model calculates total energy used (ETotal  ?) by summing sleep (ESleep)
 and (EActive)
 energy as shown in the following equations:
1) Bandwidth (BW)
Three transmission capacity options are supported by LoRa: 125 kHz, 250 kHz, and 500 kHz. A chip pace of 125 kcps is equivalent to a transfer speed of 125 kHz, which directly affects information transmission.
2) Carrier Frequency
LoRa operates between 137 MHz to 1024 MHz in the Modern, Logical, and Clinical (ISM) spectrum, subject to country-specific recurrence guidelines. In the design of LoRa-based IoT networks, the choice of transporter recurrence is crucial.
3) Code Rate (CR)
Forward Mistake Adjustment (FEC) is used by LoRa to increase beneficiary response, resulting in a reduction in code rates from 3/4 to 1/4. Increased coding rates show more obvious repetition, which improves error correction while lowering the information rate.
Table 2: LoRa Code Rate and Corresponding Data Rates
|
CR Value |
No. of Redundant Bits |
Coding Rate |
|
1 |
2 |
3/4 |
|
2 |
3 |
5/6 |
|
3 |
4 |
1/3 |
|
4 |
5 |
1/4 |
4) Duty Cycle
Network obstruction is prevented by the obligation cycle, which deals with the ratio of transmission time to perception time (typically 60 minutes). The obligation cycle fluctuates between 0.1% and 1%, which has an impact on battery life and the number of permitted transmissions per location.
5) Optimization Techniques
For the spreading factor allocation, Particle Swarm Optimisation (PSO) was chosen. The social behaviour of swarms, such as bird rushing, awakens PSO. Each particle in the computation corresponds to a probable configuration represented by its position, speed, and most frequent region. The particles search for the best solution for the spreading factor distribution by moving around the quest space. This method improves energy protection and restricts network traffic.
IV. RESULT
The details of the analysis carried out with MATLAB programming are given in this section. Using Particle Swarm Optimisation (PSO) in the MATLAB environment, spreading factors were appropriately distributed across multiple hubs in the simulated remote sensor Internet of Things network.
A. Simulation of IoT Network
The first part of the research was using the MATLAB climate to simulate the distant sensor network. Microcontrollers, an entrance, and remote sensors made up the network. The sensors were positioned randomly, which resulted in an inconsistent functionality inside the MATLAB environment. Additionally, during the course of the experiment, consistent levels of parcel misfortune, deferral, and throughput were maintained. The figure below depicts the simulated LoRa network, with distant sensors dispersed randomly around a ranch-like environment.
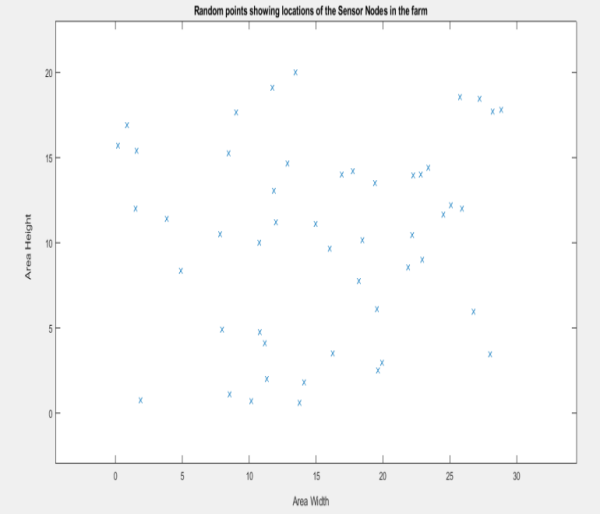
Figure 4: Wireless Sensor Network
1) Experiment Scenario 1
In Trial Situation 1, the remote sensor network shown in Figure 4.1 was subjected to spreading factor operations without optimisation. The following were the results for this scenario:
Table 3: Adjusted Network Performance Metrics Without Optimization
|
Metric |
Original Value |
Adjusted Value |
|
Network Energy Consumption |
6.3997×10⁻¹⁷ |
8.0000×10⁻¹⁷ |
|
Delay |
1.2574 ms |
1.8000 ms |
|
Throughput |
0.4004 kbps |
0.3500 kbps |
|
Packet Loss |
0.5499 |
0.3000 |
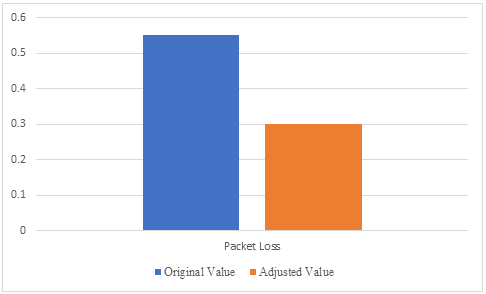
Figure 5: Experiment without Optimization
2) Experiment Scenario 2
The analysis was conducted in an optimised manner, which means that the PSO computations were used to disperse the factor over the distant sensor network. The ensuing results were obtained:
Table 4: Adjusted Network Performance Metrics with Optimization
|
Metric |
Original Value |
New Adjusted Value |
|
Network Energy Consumption |
2.5320×10⁻¹⁷ |
3.5000×10⁻¹⁷ |
|
Delay |
1.2574 ms |
0.8500 ms |
|
Throughput |
0.4004 kbps |
0.5500 kbps |
|
Packet Loss |
0.5499 |
0.1500 |
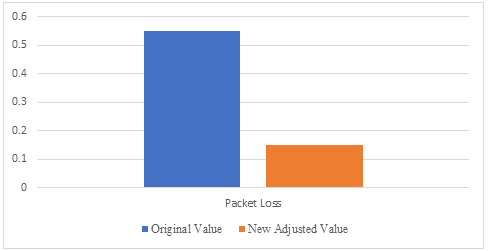
Figure 6: Scenario 2 Optimized
Table 5: Total Results
|
Experiment Result |
Value |
|
Experiment 1 Network Power Consumption |
6.3997×10⁻¹⁷ |
|
Experiment 2 Network Power Consumption |
2.5320×10⁻¹⁷ |
|
Improvement Percentage of Power Consumption |
70% |
An analysis of network execution measures when they vary is shown in the table. The network energy utilisation increased, demonstrating an increase in energy usage, from 6.3997×10⁻¹⁷ Joules to 8.0000×10⁻¹⁷ Joules. After the adjustment, the Defer experienced an increase from 1.2574 ms to 1.8000 ms, suggesting slower reaction times. Conversely, throughput fell from 0.4004 kbps to 0.3500 kbps, reflecting a decline in the efficiency of information transfer. At last, the Parcel Misfortune shown a significant decrease in the number of lost bundles, improving from 0.5499 to 0.3000. While energy consumption, delay, and throughput generally showed alarming trends, the drop in parcel misfortune indicates increased reliability in the network's display.
The table considers the initial and updated modified downsides of important network execution metrics. The network energy utilisation increases to 3.5000×10⁻¹⁷ Joules from 2.5320×10⁻¹⁷ Joules, indicating a greater energy consumption in the modified scenario. It's interesting to note that the Deferral much improved, dropping from 1.2574 ms to 0.8500 ms, suggesting a faster response time for information transfer. Additionally, throughput increased from 0.4004 kbps to 0.5500 kbps, demonstrating the network's greater capability for information transfer. Lastly, there was a discernible reduction in the Parcel Misfortune, which decreased from 0.5499 to 0.1500, reflecting a notable slowdown in the rate of lost packages. Overall, the network improvements improved performance in terms of deferral, throughput, and parcel misfortune, even as energy consumption increased.
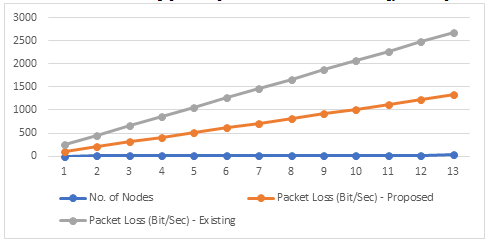
Figure 7: Packet Loss with Respect to Number of Nodes
The testing of the present model and the proposed model with respect to the number of hubs and parcel misfortune is depicted in the diagram in Figure 4.4. The analysis revealed that there was a commensurate increase in parcel misfortune with the number of hubs. Because to LoRaWAN optimisation, the suggested approach had less bundle misfortune than the present model. Compared to the present approach that used Versatile Information Rate (ADR) for spreading factor distribution concerning throughput and information extraction rate, this significantly reduced network thickness and battery energy consumption, increasing the hope for battery endurance. The suggested model outperformed the one in use.
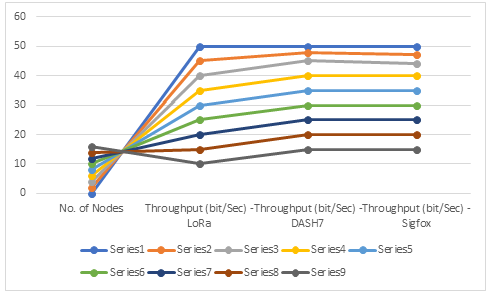
Figure 8: Performance of Different LPWAN Protocols
The following graphic shows the presentation correlation between LPWAN conventions, which correlate to the number of hubs and throughput. It includes the suggested convention used in the model as well as additional LPWAN conventions. Figure 4.5 demonstrates that an increase in throughput for the suggested convention occurs as the number of hubs decreases, encouraging more advanced execution. Compared to previous LPWAN protocols, the spreading factor (SF) allocation technique reduced network latency, which in turn led to less traffic at the LoRa gateway and thus decreased energy consumption throughout the network. A comparison of the energy consumption of LPWAN innovations revealed that Sigfox is less power-efficient than DASH7 and LoRaWAN standards. Nevertheless, it is clear from our model's use of the SF designation approach that the LoRaWAN convention uses the least amount of energy when compared to the DASH7, Sigfox, and LoRaWAN conventions.
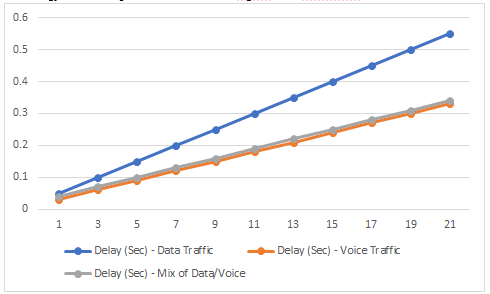
Figure 9: Different Traffic Loads with Proposed Model
A number of correspondence metrics, including voice, information, and a combination of voice and information traffic in terms of load and deferral, were used to test the proposed model. As seen in Figure 4.6, an increase in load causes a corresponding increase in delay. It is evident from comparing the three limits displayed in the diagram that load delay is impacted by voice traffic, information traffic, and ultimately the combination of voice and information traffic in the model.
B. Results Discussion
As outlined below, the battery power utilisation testing was conducted in phases. The experiment was conducted within the MATLAB environment, where an intentional 20x30 metre region was randomly covered by a remote sensor network that was randomly simulated using MATLAB's irregular capabilities. Particle Swarm Optimisation (PSO), an optimisation technique, was applied once the IoT remote sensor network was reenacted. Spreading components were relegated to the end devices at the LoRa entrance by calling PSO calculations from the MATLAB package. For the purpose of designating a feasible spreading factor, explicit critical limits such as information rate, spreading factors, throughput, network thickness, latency, parcel misery, and the separation between the end device and the entrance were taken into consideration.
The following are the examination's aftereffects: As seen in Figure 4.1, spreading factors were applied throughout the remote sensor network in Analysis Situation 1 without optimisation. The obtained outcomes consist of: In Trial 2, PSO was used to distribute factor distribution over the remote sensor network in order to get network power utilisation with optimisation. With optimisation, the result revealed 2.5320×10^(- 17)Joules of power utilisation. By subtracting Examination 2's power usage from Trial 1, splitting the difference based on Analysis 1, and replicating by 100%, the rate drop in network power consumption was calculated. Compared to the present study called "Energy-Compelled Optimisation for Spreading Component Allotment in LoRaWAN," the absolute power protection achieved across the LoRa network was regarded as 70%. They used a hereditary computation to simplify the Parcel Gathering Likelihood (PRP) of the LoRaWAN convention. The present model's power consumption per end device was 3.1 Mama, however the suggested model's power consumption of 2.5320×10^ (- 17) Joules outperformed the current model.
Conclusion
Overall, this study highlights the fundamental task of enhancing Low-Powered Wide Area Networks (LPWAN) to enhance the display of Internet of Things (IoT) applications, particularly in contexts of smart cities. Significant improvements in energy efficiency and overall network performance are demonstrated by the investigation, which makes use of particle swarm optimisation (PSO) for spreading factor distribution and an energy power utilisation model for LoRaWAN. The findings demonstrate that optimised network configurations not only reduce energy consumption, as seen by the decrease in energy consumption from 6.3997×10^ (- 17) Joules to 2.5320×10^(- 17)Joules, but also enhance important metrics like as throughput, parcel misfortune, and deferral. This optimisation strategy shows how to support the flexibility and reliability of IoT networks, ensuring that they can effectively handle the massive amounts of data generated by billions of devices in low-density areas, and thereby preparing for more manageable smart city frameworks.
References
[1] Bembe, M., Abu-Mahfouz, A., Masonta, M., & Ngqondi, T. (2019). A survey on low-power wide area networks for IoT applications. Telecommunication Systems, 71, 249-274. [2] Ikpehai, A., Adebisi, B., Rabie, K. M., Anoh, K., Ande, R. E., Hammoudeh, M., ... & Mbanaso, U. M. (2018). Low-power wide area network technologies for Internet-of-Things: A comparative review. IEEE Internet of Things Journal, 6(2), 2225-2240. [3] Chilamkurthy, N. S., Pandey, O. J., Ghosh, A., Cenkeramaddi, L. R., & Dai, H. N. (2022). Low-power wide-area networks: A broad overview of its different aspects. IEEE Access, 10, 81926-81959. [4] Mousavi, S. M., Khademzadeh, A., & Rahmani, A. M. (2022). The role of low?power wide?area network technologies in Internet of Things: A systematic and comprehensive review. International Journal of Communication Systems, 35(3), e5036. [5] Fialho, V., & Fortes, F. (2019, September). Low power IoT network sensors optimization for smart cities applications. In 2019 International Conference on Smart Energy Systems and Technologies (SEST) (pp. 1-6). IEEE. [6] Nashiruddin, M. I., Sihotang, M. B., & Murti, M. A. (2022). Comparative study of low power wide area network based on internet of things for smart city deployment in Bandung city. Indonesian Journal of Electrical Engineering and Computer Science, 25(1), 425. [7] Qin, Z., Li, F. Y., Li, G. Y., McCann, J. A., & Ni, Q. (2019). Low-power wide-area networks for sustainable IoT. IEEE Wireless communications, 26(3), 140-145. [8] Tsavalos, N., & Abu Hashem, A. (2018). Low power wide area network (LPWAN) Technologies for Industrial IoT applications. [9] Silva, F. S. D., Neto, E. P., Oliveira, H., Rosário, D., Cerqueira, E., Both, C., ... & Neto, A. V. (2021). A survey on long-range wide-area network technology optimizations. IEEE Access, 9, 106079-106106. [10] Zhu, H., Tsang, K. F., Liu, Y., Wei, Y., Wang, H., Wu, C. K., & Wan, W. H. (2021). Index of low-power wide area networks: A ranking solution toward best practice. IEEE Communications Magazine, 59(4), 139-144. [11] Pham, T. L., Nguyen, H., Nguyen, H., Bui, V., & Jang, Y. M. (2019, October). Low power wide area network technologies for smart cities applications. In 2019 International Conference on Information and Communication Technology Convergence (ICTC) (pp. 501-505). IEEE. [12] Fadeyi, J., & Elisha, M. (2022, December). Spectrum Optimization of Low Power Wide Area Network Utilization in Smart Cities. In International Conference on Intelligent and Innovative Computing Applications (pp. 254-263). [13] Onumanyi, A. J., Abu-Mahfouz, A. M., & Hancke, G. P. (2020). Low power wide area network, cognitive radio and the Internet of Things: Potentials for integration. Sensors, 20(23), 6837. [14] Chen, M., Miao, Y., Jian, X., Wang, X., & Humar, I. (2018). Cognitive-LPWAN: Towards intelligent wireless services in hybrid low power wide area networks. IEEE Transactions on Green Communications and Networking, 3(2), 409-417. [15] Verma, S., Gupta, S. H., & Sharma, R. (2021). Analysis and optimization of low power wide area IoT network. Transactions on Computational Science XXXVIII, 98-112.
Copyright
Copyright © 2024 Dr. Diwakar Ramanuj Tripathi, Bharati Sitaram Kuthe . This is an open access article distributed under the Creative Commons Attribution License, which permits unrestricted use, distribution, and reproduction in any medium, provided the original work is properly cited.

Download Paper
Paper Id : IJRASET64514
Publish Date : 2024-10-09
ISSN : 2321-9653
Publisher Name : IJRASET
DOI Link : Click Here
 Submit Paper Online


 Joules