Ijraset Journal For Research in Applied Science and Engineering Technology
- Home / Ijraset
- On This Page
- Abstract
- Introduction
- References
- Copyright
Orifice Pulse Tube Refrigerator
Authors: Aaditya Bandgar, Pratik Barge, Abhishek Bhamare, Somesh Bhamre, Giridhar Bhande, Ganesh Korwar
DOI Link: https://doi.org/10.22214/ijraset.2024.65543
Certificate: View Certificate
Abstract
Pulse Tube Refrigerators (PTRs) have emerged as a promising cryogenic cooling technology due to their simplicity and reliability, devoid of moving parts at low temperatures. This study investigates the operational principles, design enhancements, and performance optimization of PTRs. Utilizing helium as the working gas, the system integrates critical components such as a pressure wave generator, regenerator, and heat exchangers to achieve effective cooling. Building on the foundational work by Gifford and Longsworth (1963) and subsequent modifications by Mikulin et al. (1984) and Radebaugh et al., the research focuses on optimizing phase angles and minimizing regenerator losses to enhance efficiency. Experimental trials were conducted by varying key parameters, including regenerator and pulse tube dimensions, orifice valve openings, and receiver tank volumes. Observed temperature reductions ranged from 7.6°C to 16.2°C, demonstrating the significant influence of design variables on cooling performance. The findings highlight the critical interplay between phase angle adjustments and regenerator effectiveness in achieving superior thermal performance. This study contributes to the advancement of PTR design, offering insights for applications in cryogenic systems and low-temperature engineering.
Introduction
I. INTRODUCTION
The first pulse tube was built in 1963 by Gifford and Longsworth. Its basic components include a pulse tube, a regenerator, a pressure wave generator, and two heat exchangers. The pulse tube is a simple tube with one open end and one closed end. The closed end is the hot end and is capped with a heat exchanger that cools it to the ambient temperature. The open end is the cold end. It is connected to the regenerator and a cold stage by a second heat exchanger. The regenerator is a periodic flow heat exchanger. It absorbs heat from gas pumped into the pulse tube pre-cooling it, and stores the heat for half a cycle then transfers it back to outgoing cold gas in the second half of the cycle cooling the regenerator. The interior of the regenerator tube is filled with either stacked fine mesh screens or packed spheres to increase its heat capacity. A piston, compressor or similar pressure wave generator is attached to the warm end of the regenerator and provides the pressure oscillations that drive the refrigeration. Helium is used as the working gas due to its monotonic ideal gas properties and low condensation temperature. In systems with a base temperature below 2K the He3 isotope is used.
II. LITERATURE REVIEW
The pulse tube works by transporting heat against a temperature gradient in a process called surface heat pumping. Surface heat pumping is expected to occur in many systems subjected to pressure oscillations .The piston compresses the working gas, and every gas particle moves towards the closed end of the pulse tube. At the same time the temperature of the gas particles rises as they undergo adiabatic compression. The pressure experienced by a gas molecule in the pulse tube is determined by when it entered the pulse tube as shown in Fig. 2.
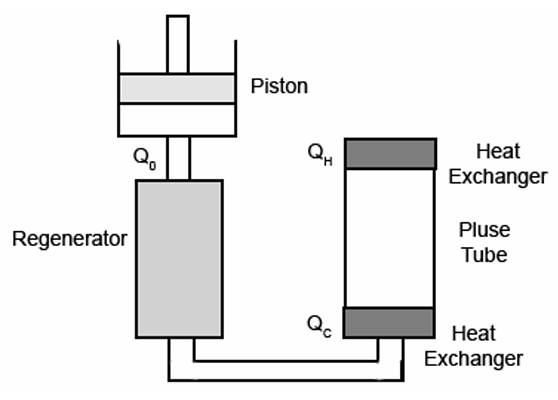
Fig.1 Basic pulse tube refrigerator
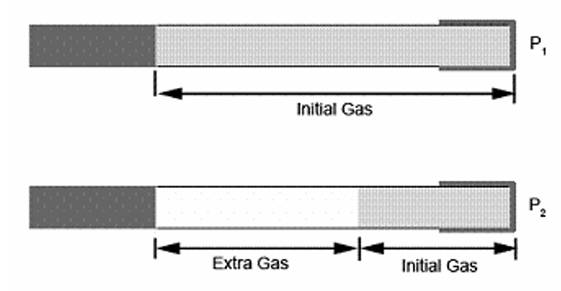
Fig.2 Initial and compressed gas in the pulse tube
All the gas that was initially in the tube will be compressed to the hot end. The extra gas that flows in from the regenerator has a pressure gradient. The pressure is highest closest to the hot end and decreases to zero at the bottom of the pulse tube. Gas at the bottom entered the tube just as equilibrium was established. The pressure gradient directly results in a temperature gradient. At the hot end of the pulse tube the gas conducts its heat to the heat exchanger and the gas temperature falls. The piston then retracts and the gas undergoes adiabatic expansion, cooling it even more. As the expanding gas passes from the pulse tube into the regenerator it absorbs heat from the regenerator and the pulse tube walls cool them. The next cycle starts by compressing the gas back through the pre-cooled regenerator. The gas begins at a lower temperature and it therefore reaches an even lower temperature after finishing its compression expansion cycle. The net result of the cycle is that each element of the gas transports heat against the temperature gradient toward the closed hot end of the pulse tube where it is absorbed by the heat exchanger.
Record low temperatures achieved with this basic pulse tube design are 124K with a single stage and 79K using two stages[4]. Two stages describes two pulse tube coolers in series powered by the same compressor. The hot end of the second pulse tube is thermally anchored to the cold end of the first pulse tube cooler. There is a valve at the cold end of the first regenerator that allows compressed gas to flow into both the second regenerator and the pulse tube of the first cooler.
The basic pulse tube refrigerator and more generally the surface heat pumping technique is clearly of limited use for reaching very cold temperatures, and in 1984 Mikulin et. al improved the design by adding an orifice near the warm end of the pulse tube. An orifice is just a throttle valve or needle valve to regulate flow. Their new design had a base temperature of 105K [5]. Radebaugh et. al further improved the design, reaching a low temperature of 60K, by placing the orifice outside the heat exchanger and adding a reservoir closing the orifice [4]. The design of the Orifice Pulse Tube Refrigerator (OPTR) is shown in Fig. 3.
Fig.3 Orifice pulse tube refrigerator
Most losses in pulse tube refrigerators occur in the regenerator. Significant losses also occur inside the pulse tube component if secondary flows, such as turbulence, acoustic streaming, and DC flows are not eliminated or minimized. The function of the regenerator is to transmit a given acoustic or PV power from the compressor to the cold end with a minimum of losses. These losses include thermal ineffectiveness, lost power associated with pressure drop, and axial thermal conduction. The first two scale directly with the amplitude of mass or volume flow through the regenerator. The time-averaged acoustic power transmitted through the regenerator is given by (1)

where the bold symbols represent time-varying or phasor variables, such as pressure, volume flow rate, and mass flow rate. The phase angle θ is the phase between pressure and flow. The other symbols are: ρ0 is the average density, R is the gas constant per unit mass, T0 is the average temperature, and P0 is the average pressure.
Fig.4 Sections of gas in the pulse tube. The regenerator is on the left side of region III the orifice is at point 0 which leads into a reservoir.
From equation (1) we see that the acoustic power flow is proportional to the component of the mass flow in phase with the pressure. Thus, minimizing the ratio of the regenerator losses to the acoustic power flow entails minimizing θ, the phase between flow and pressure. Because of the gas volume in the regenerator the conservation of mass requires that the flow at the warm end will necessarily lead the flow at the cold end. In that case the optimum phase relationship is that in which θ = 0 at approximately the midpoint of the regenerator. Typically the flow at the cold end will lag the pressure by about 30°, whereas at the warm end the flow will lead the pressure by about 30°. Such a phase relationship is easily achieved in a Stirling refrigerator by selecting the appropriate displacer swept volume and phase.
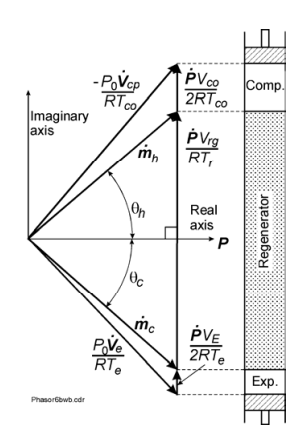
Fig.5 Phasor diagram of mass conservation in a Stirling refrigerator
Figure 5 shows a phasor representation of mass conservation in a Stirling refrigerator that shows the optimum phase relationship of θ = 0 at approximately the regenerator midpoint. In a pulse tube refrigerator with only an orifice or other resistive flow element for setting the phase, the flow will be in phase (θ = 0) at the orifice, but not at the regenerator midpoint. Figure 6 shows the phasor representation of the orifice pulse tube refrigerator (OPTR). In that case θ may be approximately 30°at the cold end, 50° or more at the midpoint, and as much as 70° at the warm end. With such a large phase angle the amplitude of mass flow required at the warm end of the regenerator for a given acoustic power flow will be more than twice that in which θ = 0 at the midpoint of the regenerator. Such a high mass flow leads to a large regenerator ineffectiveness and pressure drop.
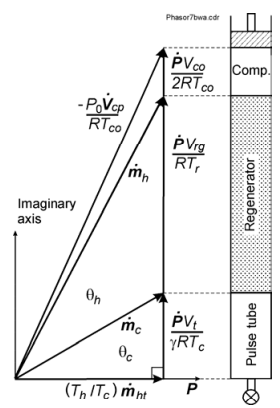
Fig.6 Phasor diagram for an orifice pulse tube refrigerator
Figure 7 shows how regenerator losses vary with the phase angle between the flow and the pressure for a given entropy flow at the warm end of the regenerator. Fixing the entropy flow there is similar to fixing the acoustic power flow at the warm end.
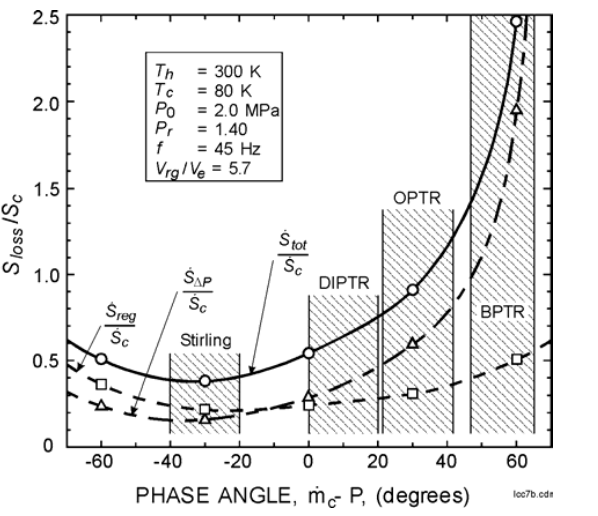
Fig.7 Regenerator losses associated with ineffectiveness and pressure drop for various phase angles by which flow leads pressure. Results from calculations with REGEN3.2
This figure shows that the minimum regenerator loss occurs with the flow lagging the pressure at the cold end by about 30°, which typically is achieved with a Stirling refrigerator. With an OPTR the phase angle is about +30° (flow leading pressure) at the cold end. As this figure shows, the sum of the ineffectiveness loss reg S & and the pressure drop loss SΛP & for the OPTR is about twice that for the optimum phase of about-30° at the cold end.
III. METHODOLOGY
A. Compressor
Compression ratio :
V2V1 = Volume of Receiver tank Volume of Receiver tank + swept volume =1.4
P2P1 =(V1V2)γ=1.6 …..(Adiabatic Compression)
Temperature ratio :
T2T1 =(P1P1)γ-1γ=1.14 …..(Adiabatic Compression)
Heat Required to extract in each cycle : Heat extraction required would be equivalent to the work done by the compressor
W = P2 V2 - P1 V1 γ-1=2.95 J
???????B. Heat Sink
Compressor :
B=25mm (Bore)
L=50mm (stroke)
v1=volume befor?? compression (volume of complete assembly)
v2=(v1-π4B2L)
Rconv1=1hhAtotal
Rcond1=12πkLlnRoRi
Rconv2=1hcAsurface
Atotal=zπDhL
Asurface=2πRoL
z=Did2
Rconv1=1hhAtotal=1hhzπDhL
Rcond1=12πkLlnRoRi
Rconv2=1hcAsurface=1hc2πRoL
Req=Rconv1+Rcond1+Rconv2
=1hhzπDhL+12πkL+1hc2πRoL
=1πL1hhzDh+12k+1hcDo
=2hcDok+hhhczDhDo+2khhzDh2πkLhhhczDhDo
replace Dh=d (hole diameter)
Req=2hcDok+hhhczdDo+2khhzd2πkLhhhczdDo
Re=f(hh,hc,k,Do,d,z,L)
Flow resistance hf=FLv22gD ,if Re<2000
f=64Re ,if Re>2000 , f from moody's chart
ΔP=FLv2ρ2d=FLQ2ρg12.1d5
hf=FLv22gd=FLQ212.1d
hf=g(F,L,v,d)
Hence, hf=g(F,L,v,d)
Where , hh is coefficient of heat transfer inside heat sink holes,
hc is coefficient of heat transfer outside heat sink surface ,
k is thermal conductivity of air ,
Do inner diameter of heat sink,
d hole diameter,
z is number of holes,
L is length of heat sink
IV. TRIALS
A. For Receiver Tank
Pulse Tube Length = 25 Cm
Regenerator Length = 10 Cm
Compressor Speed = 6 Hz
Valve Opening = 100%
Table I
|
Trail No. |
Decrease in Temp |
Time (min) |
Vol. of Receiver Tank (CC) |
|
1 |
12.2 |
7 |
4000 |
|
2 |
13.1 |
7 |
3000 |
|
3 |
15.3 |
18 |
3000 |
|
4 |
13.8 |
6 |
2500 |
|
5 |
15.9 |
15 |
2500 |
|
6 |
12.9 |
4 |
2000 |
|
7 |
16.2 |
11 |
2000 |
|
8 |
13.4 |
8 |
1500 |
|
9 |
13.2 |
9 |
1000 |
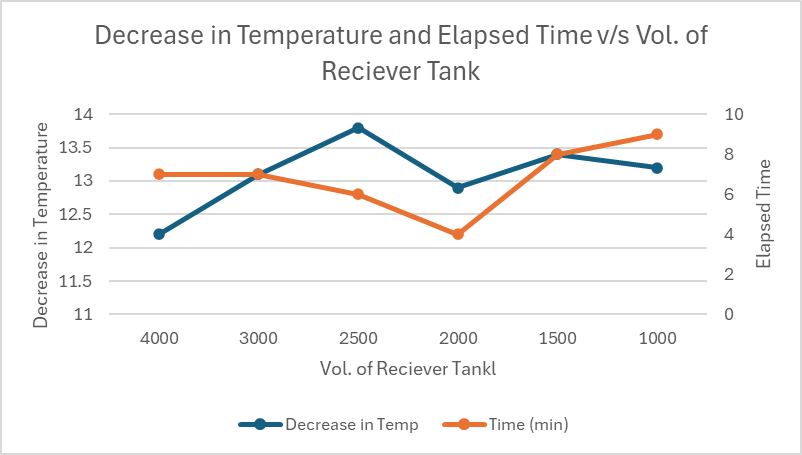
Fig.8 Decrease in Temperature and Elapsed Time v/s Volume of Receiver Tank
As can be seen in Table I, few trials were repeated again for more duration of time which are represented in Fig.9,
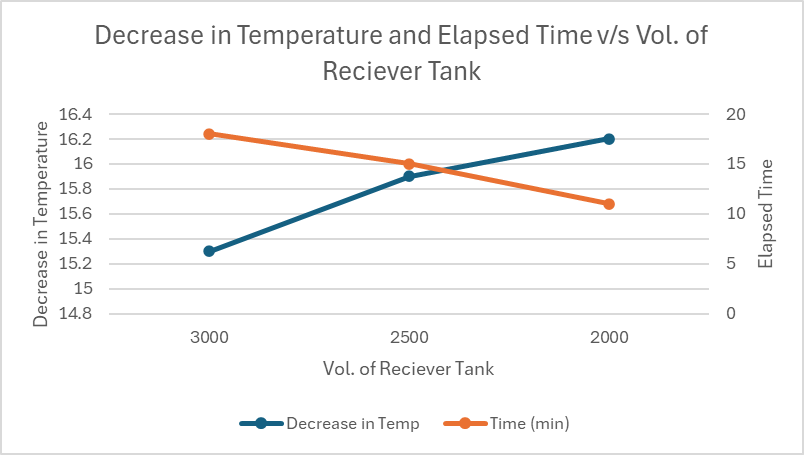
Fig.9 Decrease in Temperature and Elapsed Time v/s Volume of Receiver Tank repeated for more duration of time
B. For Pulse Tube Setup
Valve Opening = 100%
Receiver Tank = 2000 cc
Compressor Speed = 6 Hz
We here took trials changing the lengths of the regenerator and pulse tube.
Table II
|
Trial No. |
Regenerator Length(cm) |
Pulse Tube Length (cm) |
Time (min) |
Ambient Temp |
Final Temp |
Decrease in Temp |
|
1 |
10 |
7 |
4 |
31.2 |
20.4 |
10.8 |
|
2 |
7.5 |
15 |
2 |
33.4 |
25.8 |
7.6 |
|
3 |
7.5 |
12.5 |
3 |
31.9 |
20.2 |
11.7 |
|
4 |
7.5 |
10 |
3 |
30.2 |
17.2 |
13 |
|
5 |
4.5 |
6.5 |
2 |
30.6 |
17.8 |
12.8 |
|
6 |
4.5 |
6.5 |
3 |
30.6 |
16.4 |
14.2 |
|
7 |
3 |
10 |
2 |
30.2 |
16.9 |
13.3 |
|
8 |
3 |
10 |
3 |
30.2 |
15.8 |
14.4 |
|
9 |
3 |
12.5 |
2 |
31.1 |
18.3 |
12.8 |
|
10 |
3 |
12.5 |
3 |
31.1 |
17.2 |
13.9 |
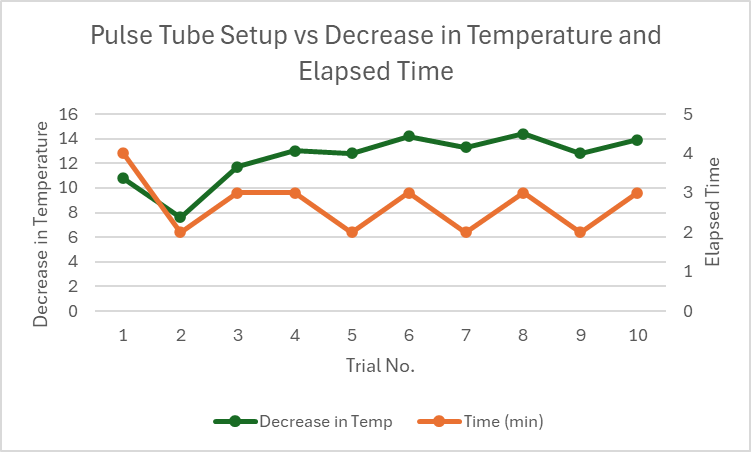
Fig.10 Pulse Tube Setup vs Decrease in Temperature and Elapsed Time
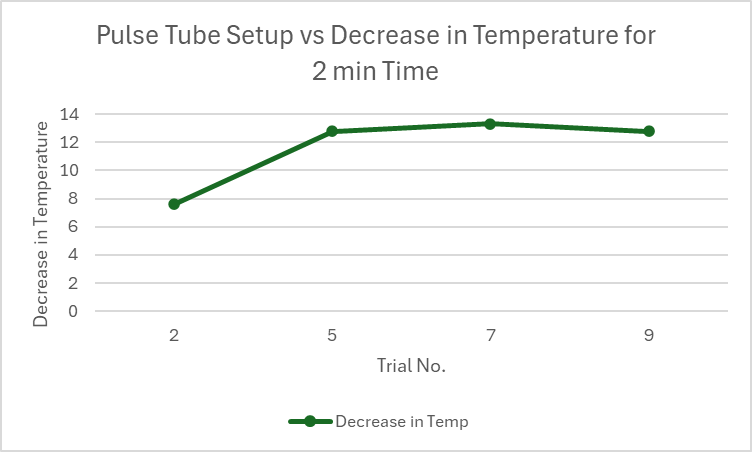
Fig.11 Pulse Tube Setup vs Decrease in Temperature for 2 min Time
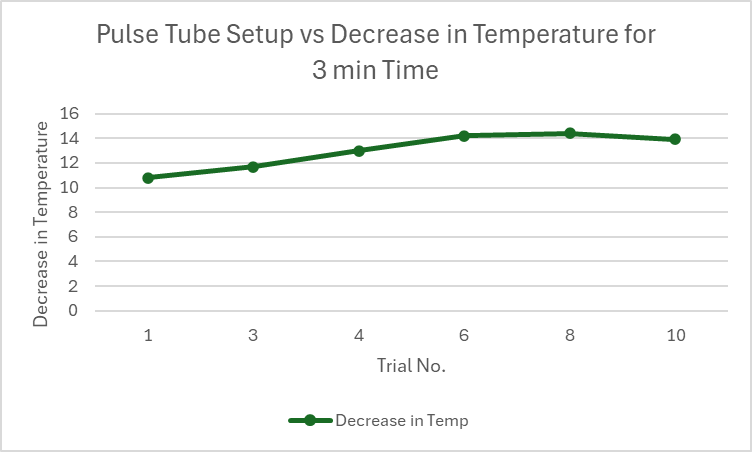
Fig.12 Pulse Tube Setup vs Decrease in Temperature for 3 min Time
C. For Valve Opening
Receiver Tank = 2000 cc
Compressor Speed = 6 Hz
Pulse Tube Length = 10 cm
Regenerator Length = 3 cm
Table III
|
Trial No. |
Valve Opening (%) |
Ambient Temp |
Temp at 30 Sec |
Temp at 1 min |
Temp at 2 min |
Temp at 3 min |
Decrease in Temp |
|
1 |
11 |
30.2 |
25.8 |
22.4 |
20.1 |
17.8 |
12.4 |
|
2 |
22 |
30.6 |
24.5 |
20.8 |
18.1 |
17.7 |
12.9 |
|
3 |
33 |
30.5 |
23.2 |
18.5 |
14.5 |
13.5 |
17 |
|
4 |
44 |
30.8 |
21.9 |
17.3 |
13.3 |
11.6 |
19.2 |
|
5 |
55 |
30.2 |
21.7 |
17.5 |
13.9 |
12.1 |
18.1 |
|
6 |
66 |
30.6 |
22.1 |
17.8 |
14.3 |
12.6 |
18 |
|
7 |
77 |
30.3 |
21.7 |
17.6 |
16.6 |
14.8 |
15.5 |
|
8 |
88 |
30.5 |
21.8 |
17.9 |
16.7 |
15.1 |
15.4 |
|
9 |
100 |
30.3 |
21.7 |
18 |
17.3 |
15.5 |
14.8 |
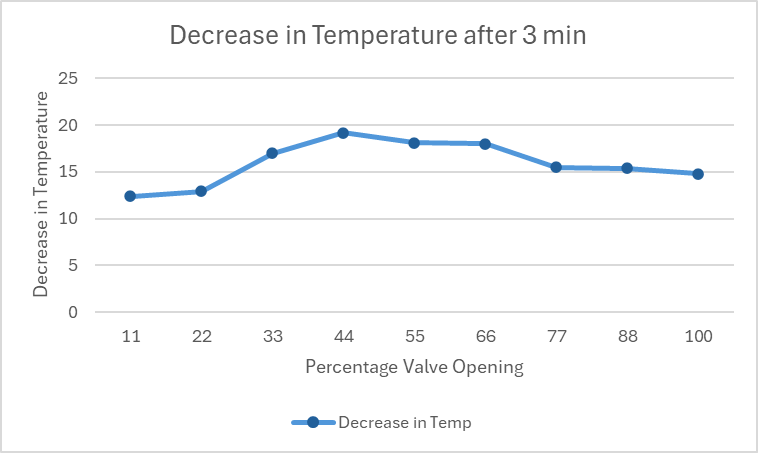
Fig.13 Decrease in Temperature after 3 min
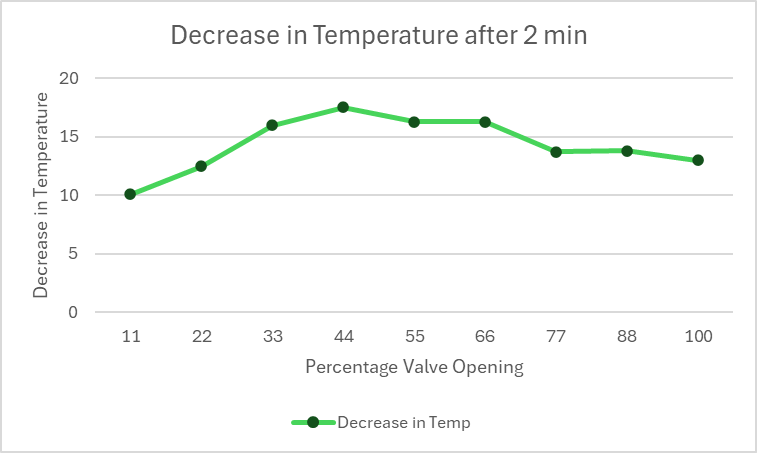
Fig.14 Decrease in Temperature after 2 min
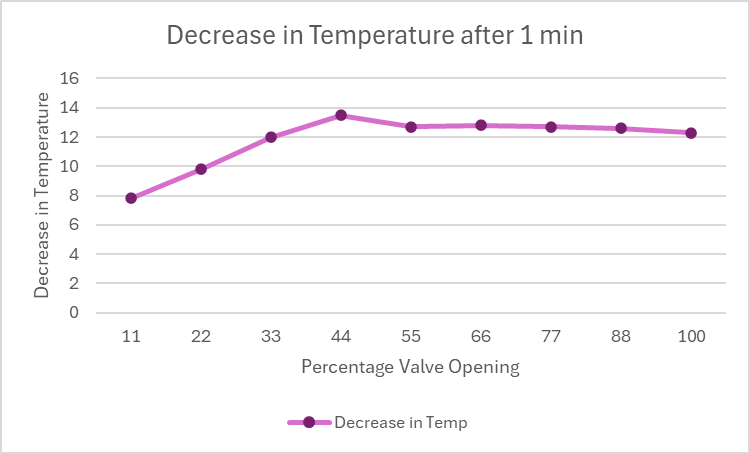
Fig.15 Decrease in Temperature after 1 min
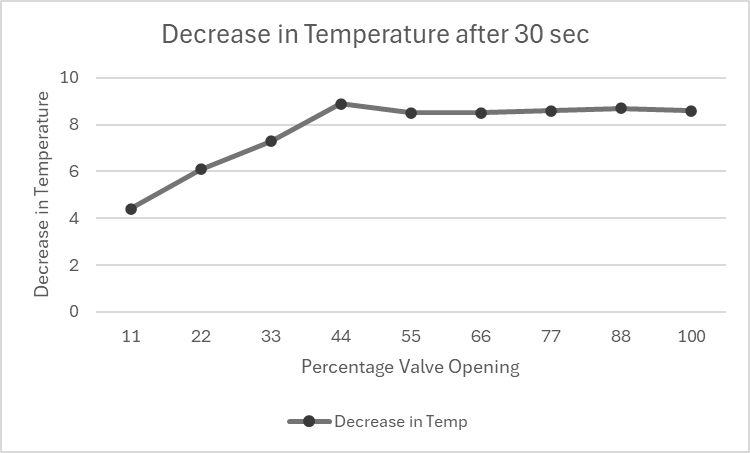
Fig.16 Decrease in Temperature after 30 sec
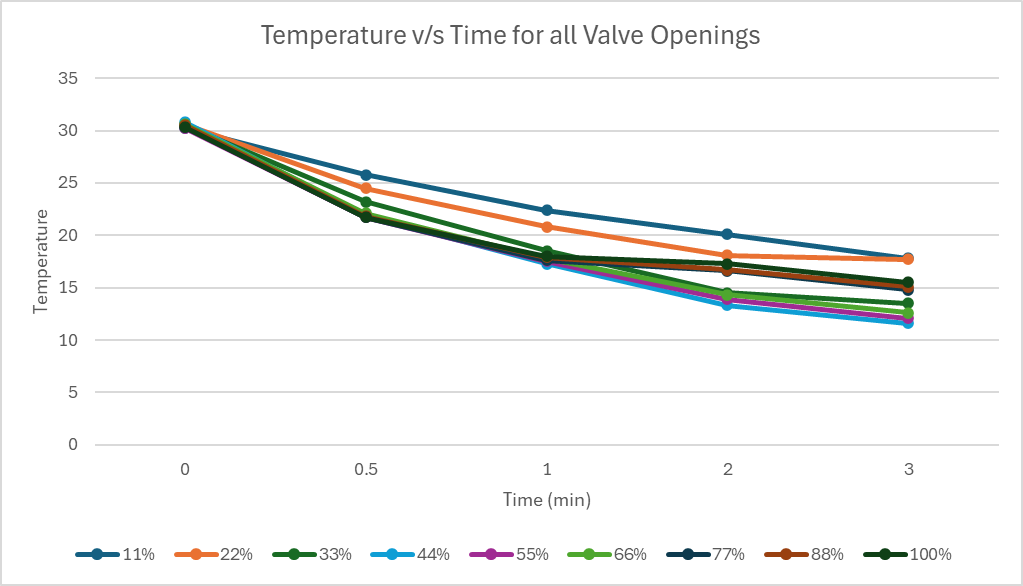
Fig.17 Temperature v/s Time for all Valve Openings
V. RESULTS AND DISCUSSION
From all the trials performed, following setup is finalized:
Pulse Tube Length = 10 cm
Regenerator Length = 3 cm
Receiver Tank = 2000 cc
Valve Opening = 44-45%
For this setup, the final temperature vs time plot is measured and shown in fig.18
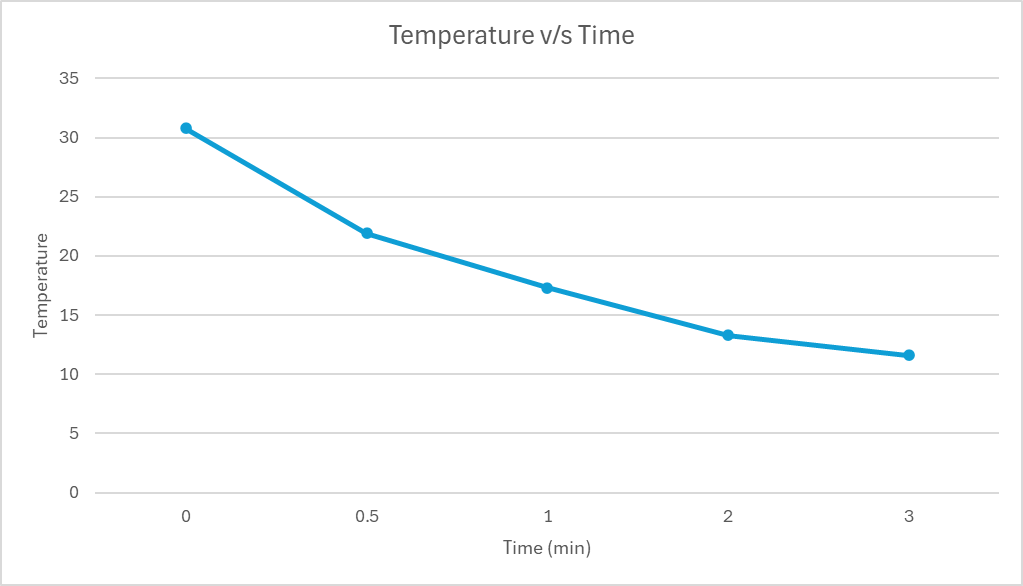 ???????
Fig.18 Temperature v/s Time
References
[1] Radebaugh, Ray, Michael Lewis, E. Luo, John M. Pfotenhauer, G. F. Nellis, and L. A. Schunk. \"Inertance tube optimization for pulse tube refrigerators.\" In AIP conference proceedings, vol. 823, no. 1, pp. 59-67. American Institute of Physics, 2006. [2] Kakaç, Sadik, M. R. Avelino, and Henry F. Smirnov, eds. Low temperature and cryogenic refrigeration. Vol. 99. Springer Science & Business Media, 2012. [3] Jiang, N., U. Lindemann, F. Giebeler, and G. Thummes. \"A 3He pulse tube cooler operating down to 1.3 K.\" Cryogenics 44, no. 11 (2004): 809-816. [4] Radebaugh, Ray, James Zimmerman, David R. Smith, and Beverly Louie. \"A comparison of three types of pulse tube refrigerators: new methods for reaching 60K.\" Advances in Cryogenic Engineering: Volume 31 (1986): 779-789. [5] Gifford, William E., and R. C. Longsworth. \"Pulse-tube refrigeration.\" (1964): 264-268.
Copyright
Copyright © 2024 Aaditya Bandgar, Pratik Barge, Abhishek Bhamare, Somesh Bhamre, Giridhar Bhande, Ganesh Korwar. This is an open access article distributed under the Creative Commons Attribution License, which permits unrestricted use, distribution, and reproduction in any medium, provided the original work is properly cited.

Download Paper
Paper Id : IJRASET65543
Publish Date : 2024-11-26
ISSN : 2321-9653
Publisher Name : IJRASET
DOI Link : Click Here
 Submit Paper Online

