Ijraset Journal For Research in Applied Science and Engineering Technology
- Home / Ijraset
- On This Page
- Abstract
- Introduction
- Conclusion
- References
- Copyright
Experimental Study of a PMDC Motor by dynamic response testing
Authors: Anay Maheshwari, Parag Kshirsagar, Shruti Kulat, Bhargav Kulkarni, Vedant Kulkarni, Prof. Dr. D. B. Hulwan
DOI Link: https://doi.org/10.22214/ijraset.2024.65171
Certificate: View Certificate
Abstract
This paper studies and investigates of the performance of permanent magnet D.C motors (PMDC motor) as well as determining the parameters of this type of motors at steady state. The study was carried out in two stages. The first stage involved the practical experimental to determine the parameters and characteristics of PMDC motor at steady state while the second stage centered on the simulation of mathematical modeling of this system using Simulink environment in MATLAB. The best significant results show that the computer simulations provide results closely to values of experimental measurements, therefore it can be used to investigate the performance of PMDC motors and their characteristics. In addition, the efficiency of PMDC motor is higher than Electromagnetic D.C motors, also the damping coefficient has a negative effect on characteristics of motor especially at no-load steady state in spite of smallness value. The paper includes the development of a lithium-ion battery pack and a static setup for simulating variable load cases on a PMDC motor.
Introduction
I. INTRODUCTION
In the realm of electromechanical systems, the integration of lithium-ion battery technology with Permanent Magnet DC (PMDC) motors has emerged as a cornerstone for innovation in various industrial applications. This paper delves into the intricate domain of designing and implementing custom cylindrical lithium-ion battery packs specifically tailored to power PMDC motors for experimental testing. Furthermore, it elucidates the development of a comprehensive test bench essential for rigorously evaluating the performance and efficacy of these motors under varied operating conditions.
The impetus behind the creation of custom cylindrical lithium-ion battery packs lies in the necessity for a power source that not only meets the unique requirements of PMDC motors but also offers enhanced efficiency, reliability, and longevity. Unlike off-the-shelf battery solutions, custom packs can be meticulously engineered to accommodate the specific power demands and spatial constraints of PMDC motor systems. This customization ensures optimal performance, prolonged lifespan, and seamless integration within diverse experimental setups. Designing a bespoke battery pack entails a multifaceted process that begins with a comprehensive analysis of the PMDC motor's operational parameters, including rated current, rated voltage, and rated power. These specifications serve as pivotal benchmarks for determining the energy storage capacity and discharge characteristics required to sustain optimal motor performance across various operating conditions. Through advanced computer-aided design (CAD) simulations and prototyping iterations, the battery pack architecture is fine-tuned to maximize energy density, minimize weight and volume, and ensure robust mechanical integrity. Moreover, the development of a dedicated test bench for PMDC motor experimentation is indispensable for elucidating its performance characteristics across a spectrum of operating conditions. This entails the integration of precise instrumentation for monitoring key parameters such as torque, speed, efficiency, and temperature. By subjecting the motor to diverse load profiles, speed regimes, and environmental conditions, researchers can glean invaluable insights into its dynamic behaviour, efficiency, and reliability. Such comprehensive testing facilitates iterative refinement of motor design, control algorithms, and system integration strategies, thereby accelerating the pace of technological innovation and optimization.
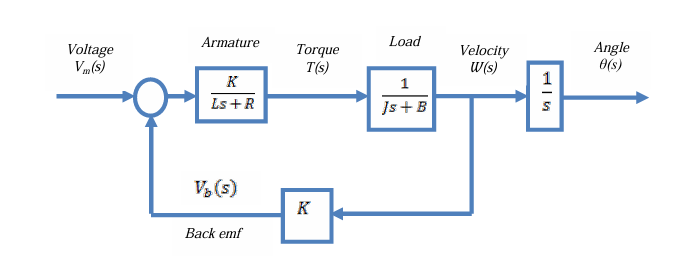
Figure 1. Flowchart on working of a PMDC motor
II. METHODOLOGY
A. Development of a Battery Pack
The stages of battery pack development are broadly classified into the preparation stage, Assembly stage, and Test stage. The Design objective for the battery pack is to make it as energy dense as possible by reducing weight, selecting high energy density cells and maximizing packaging efficiency ensuring adequate power storage. The battery pack has the capability to provide high discharge, providing instantaneous torque as per the requirements.
The process begins with deciding the appropriate chemistry for the cells of the accumulator according to the energy density.
Since NMC and LFP chemistries proved to be the among the top of the overall performers and aligns with the goals of the battery pack cells of these chemistries are further shortlisted. Further based on the availability and cost to performance ratio cells were procured.
From the data of the decision matrix, we finalised and procured cylindrical lithium-ion 18650 cells (i) Nominal voltage – 3.65, (ii) Energy – 2600mAh (iii) Power – 9.49Wh (iv) Peak Discharge Capacity – 3C
The Maximum voltage and current limits required by the motor calculated according to the model for the endurance event were 24V and 7A max current. The power thus required by the motor came out to be, 168W.
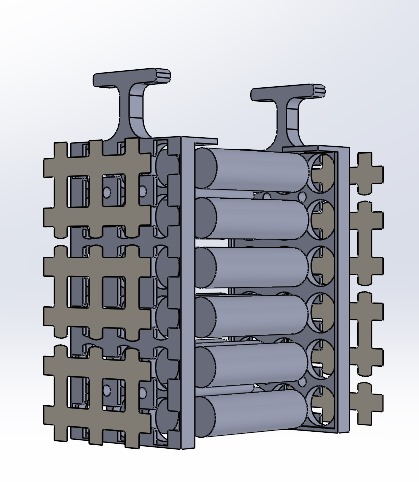
Figure 2 Exploded View of Battery Segment
Testing was done to calculate practical values of internal resistance, specific heat capacity and efficiency of the cell. From the data collected, the temperature rise above the ambiance for different parallel configurations is recorded. Since the 3p-6s configuration showed the proper balance between the weight and reduction in heat generated, it was finalized. The current configuration of the battery pack i.e. 3p-6s for which energy at upper cutoff voltage is 170Whr. The peak discharge capability of the battery pack is 7.8 amps and peak voltage is 25.2 volts.
Prioritizing safety by incorporating various fire-retardant materials. Our approach involved an iterative design process, guided by Computational Fluid Dynamics (CFD) analysis to optimize cooling efficiency under full load conditions. The spacing between cells was meticulously determined based on these results. To streamline manufacturing while maintaining cost-effectiveness, we utilized rapid prototyping techniques for the casing, employing FR-ABS as the material of choice.
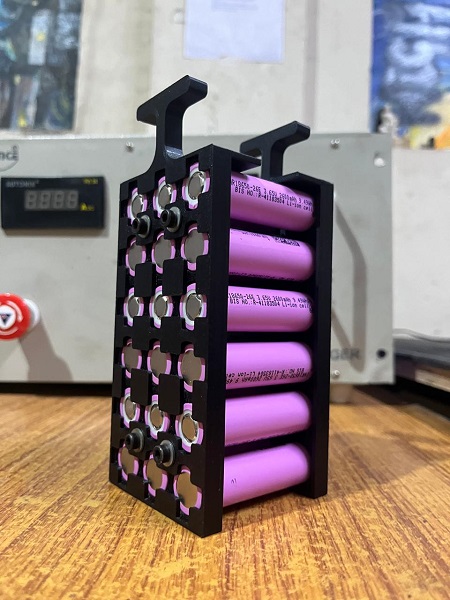
Figure 3 Assembled Segment
For electrical conductivity and current management, 0.15mm nickel busbars were strategically selected, their thickness carefully calculated to handle maximum current. The busbars a designed in a manner that they cover maximum surface area around the positive and negative cell tabs for effective heat dissipation. These busbars were precisely placed within 3D printed notches provided for each busbar. To ensure structural integrity and support for all cells, step supports were incorporated on both sides of the endplate, secured together using multiple studs. Spot welding nickel busbars involves joining two or more nickel busbars together using a spot-welding process. This process involves applying pressure and electrical current to the junction point of the busbars, which causes them to heat up and fuse together at the desired spot. Nickel busbars are commonly used in electrical applications due to their high conductivity and corrosion resistance.
B. Design and manufacturing of Motor Test Bench
The experimental setup for this study comprises several key components meticulously designed and constructed to ensure accuracy and reliability in the measurement of the PMDC motor's performance. These components include the Permanent Magnet DC (PMDC) motor, a robust structural framework, a pulley system, a coupling mechanism, and a dynamometer, all modelled with real dimensions using Fusion 360 software. The design of the test setup was put together to seamlessly accommodate these parts, as illustrated in the figure, ensuring precise and consistent measurements. To construct the framework, T-slot aluminum extrusion profiles measuring 40mm x 40mm were employed, providing a sturdy and adaptable structure capable of withstanding the forces involved in the experiment. The pulley is intricately coupled to the motor, with its opposite end supported by a bearing block to ensure stability and smooth operation. The dynamometer is securely attached to the setup using a 6mm diameter aluminum rod, enabling precise measurement of the applied force. A rope is looped around the pulley, with one end securely fastened to the dynamometer's hook, while the other end supports a suspended weight. This comprehensive setup is meticulously designed to accurately measure the motor's performance under various conditions, providing valuable insights into its efficiency and functionality.
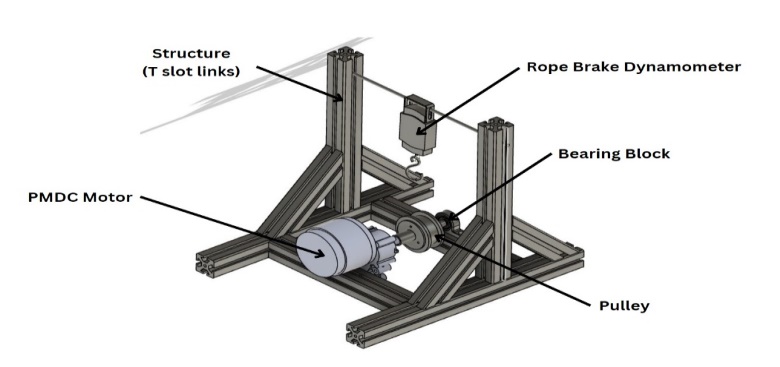
Figure 4 CAD Model of Motor Test Bench
C. Component Description
- PMDC Motor: The PMDC motor used in this setup is rated at 24V with a power output of 2500 watts. It has a rated speed of 1500 rpm and a rated current of 13.4A, making it suitable for the intended experimental application. Its specifications ensure efficient and reliable performance during testing.
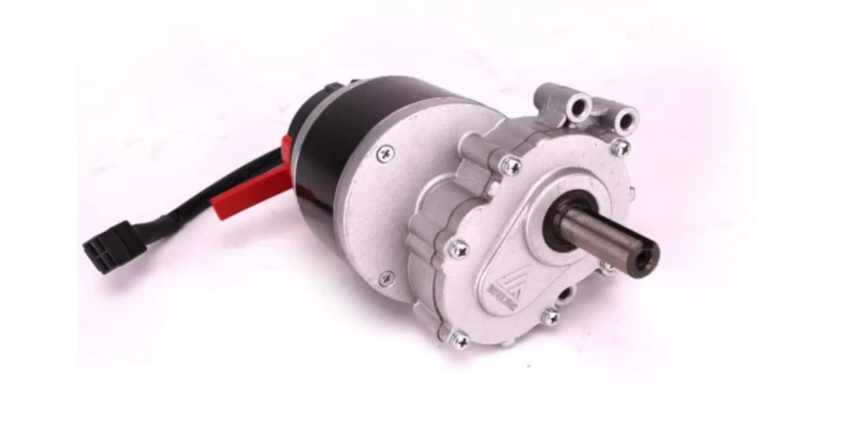
Figure 5 PMDC Motor
- Structural Framework: The structural framework is constructed using 40mmx40mm casted L brackets to join the extrusion profiles. This design provides a sturdy and stable foundation for the entire setup, capable of withstanding the forces and vibrations generated during operation. The use of casted L brackets ensures strong and durable connections, enhancing the overall structural integrity of the framework.
- Pulley System: The pulley system features a 75mm diameter pulley made of aluminium, with a height of 32mm. This pulley is designed to efficiently transfer mechanical power from the motor to the load.
- Coupling Mechanism: The coupling is made of aluminium and has a height of 30mm, with a 60mm flange diameter and a hub ID of 17mm. This coupling is designed to securely connect the motor shaft to the pulley, ensuring smooth and efficient power transmission. Its dimensions are selected to match the motor and pulley specifications, providing a reliable connection that minimizes power loss and mechanical wear.
- Dynamometer: The dynamometer (maximum load 50 kg) is used to measure the force or torque applied by the motor during operation, providing valuable data for performance analysis. The dynamometer is calibrated to ensure accurate and reliable measurements, allowing for precise evaluation of the motor's efficiency and performance under various conditions.
D. Experimental Testing
Experimental testing typically involves setting up the motor in a controlled environment, applying varying loads and speeds, and measuring parameters such as current drawn, torque, and output power using appropriate instrumentation such as dynamometer, load cell, and data acquisition systems. These experiments help in characterizing the motor's performance characteristics and validating theoretical models and design assumptions. Additionally, they provide valuable data for optimizing motor control strategies and improving overall system efficiency in real-world applications. Testing was carried out for various cases to observe the following:
1) Case 1: Current Measurement Under Variable Load
Assess how the motor's current draw changes with different loads, providing insight into its load-current relationship and operational efficiency.
2) Case 2: Torque Output Measurement at Constant Load Across RPM Range
Study how the motor's torque output varies across a range of RPM while maintaining a constant load. This analysis helps understand the motor's torque-speed characteristics, crucial for selecting the right motor for specific applications.
3) Case 3: Efficiency Observation with Increasing RPM
To determine the motor's efficiency by progressively increasing RPM while measuring input and output power. This allows for a deeper understanding of how the motor's efficiency changes with speed variations, aiding in optimizing performance and energy consumption.
4) Case 4: Output Power Calculation Based on Experimental Data
Calculate the motor's output power using torque and angular speed data obtained from experimental tests. This calculation provides a quantitative measure of the motor's mechanical power delivery, essential for evaluating its overall performance and suitability for various applications.
III. RESULTS
This part deals with measurement procedures which aim to achieve the requirements of the current search through the practical side. The PMDC was unloaded and fed to 25.2 volts and the rotational velocity was measured using non – contacting tachometer.
Using a rope dynamometer setup such as a small practical pulley coupled to the rotational motor shaft. The torque load was gradually increased to the point where stall occurs. The measuring reading of Output Torque, Power, Efficiency, Current drawn and speed were taken at different load positions and recorded.
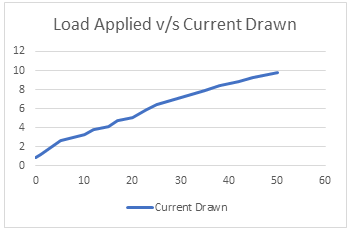
Graph 1 Load v/s Current
The experimental testing revealed a direct relationship between the load applied to the PMDC motor and the current drawn from the power supply. As the load increased, the current drawn by the motor also increased proportionally. This observation aligns with the motor's characteristics and the fundamental principles of electromechanical systems.
Key Inference:
- As the load on the motor increased, the current drawn from the power supply showed a corresponding rise.
- The relationship between load and current drawn demonstrated linearity within the tested range of loads.
- At lighter loads, the current drawn remained relatively low, indicating minimal power consumption by the motor.
- As the load approached the motor's maximum torque capacity, the current drawn increased significantly, reflecting higher power requirements to sustain operation under heavier loads
|
Load Applied |
Current Drawn |
|
0 |
0.88 |
|
1 |
1.2 |
|
5 |
2.6 |
|
10 |
3.3 |
|
12 |
3.8 |
|
15 |
4.1 |
|
17 |
4.7 |
|
20 |
5.08 |
|
23 |
5.9 |
|
25 |
6.4 |
|
30 |
7.2 |
|
35 |
7.9 |
|
38 |
8.4 |
|
42 |
8.8 |
|
45 |
9.3 |
|
50 |
9.8 |
Table 1Load Applied and Current Drawn
Initially, as the RPM of the motor increases, the power output also increases. This relationship is observed to be linear, meaning that there is a proportional increase in power output with each incremental increase in RPM. This linear relationship suggests that the motor is efficiently converting electrical energy into mechanical power, with higher RPMs resulting in higher mechanical output.
However, the experimental testing revealed an interesting phenomenon beyond a certain RPM threshold, specifically around 700 RPM. Beyond this point, the rate at which the power output increases with increasing RPM begins to slow down. This suggests that the motor is reaching a point where its efficiency in converting electrical energy to mechanical power starts to plateau.
Moreover, in the higher RPM range, typically between 1300 to 1500 RPM, the power output was observed to become slightly constant. This means that despite further increases in RPM beyond 700, the power output does not increase significantly. This could indicate that the motor is reaching its maximum capacity or encountering limitations that prevent it from delivering higher mechanical power beyond this range.
Key Inference:
- The power output of the PMDC motor exhibited a direct correlation with its RPM, demonstrating an increase in power as RPM increased.
- At lower RPMs, the power output was relatively low, indicating lower mechanical output from the motor.
- As the motor's RPM increased, the power output rose steadily, reaching peak levels at higher rotational speeds.
- The relationship between RPM and power output demonstrated the motor's capability to deliver varying levels of mechanical power based on rotational speed.
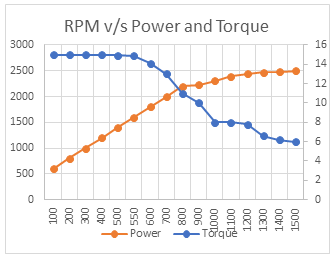
Graph 2 RPM v/s Power & Torque
The experimental testing unveiled a significant correlation between the rotational speed (RPM) and torque output of the PMDC motor, highlighting its ability to deliver varying levels of torque at different speeds. Notably, the torque remained constant up to 500 RPM before gradually decreasing with further increases in RPM. This observation underscores the motor's versatility, as it exhibited relatively high torque at lower speeds, making it suitable for applications requiring substantial force at startup or low speeds. However, as RPM increased beyond a certain point, the torque output began to decline gradually, reflecting the motor's mechanical limitations. Nevertheless, the motor's capability to adjust mechanical force based on rotational speed offers valuable flexibility for applications demanding precise control over torque and speed, emphasizing its relevance across a spectrum of industrial and engineering contexts.
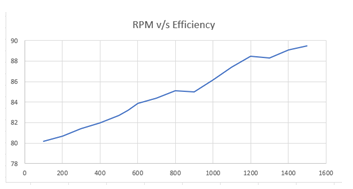
Graph 3 RPM V/s Efficiency
Key Inference:
- The torque output of the PMDC motor displayed a direct correlation with its RPM, indicating changes in torque output as rotational speed varied.
- At lower RPMs, the torque output was relatively high, suggesting that the motor could generate substantial torque even at lower rotational speeds.
- As the motor's RPM increased, the torque output decreased gradually, reflecting the motor's mechanical characteristics and torque-speed profile.
In general, PMDC motors exhibit a direct relationship between RPM and efficiency. As RPM increases, efficiency tends to decrease slightly due to factors such as friction and winding losses. However, modern advancements in motor design and control systems have minimized this trade-off, allowing for high efficiency even at elevated RPMs.
|
Load Position |
N (rpm) |
w |
Mechanical Load |
Output Power |
Efficiency (%) |
|
0 |
1500 |
157.00 |
50 |
2500 |
89.5 |
|
1 |
1400 |
146.53 |
45 |
2484 |
89.1 |
|
2 |
1300 |
136.06 |
42 |
2470 |
88.3 |
|
3 |
1200 |
125.60 |
38 |
2440 |
88.5 |
|
4 |
1100 |
115.13 |
35 |
2390 |
87.4 |
|
5 |
1000 |
104.67 |
30 |
2310 |
86.2 |
|
6 |
900 |
94.20 |
25 |
2230 |
85 |
|
7 |
800 |
83.73 |
23 |
2200 |
85.1 |
|
8 |
700 |
73.26 |
20 |
2000 |
84.4 |
|
9 |
600 |
62.80 |
17 |
1800 |
83.9 |
|
10 |
550 |
57.56 |
15 |
1600 |
83.2 |
|
11 |
500 |
52.33 |
12 |
1400 |
82.7 |
|
12 |
400 |
41.87 |
10 |
1200 |
82.0 |
|
13 |
300 |
31.40 |
5 |
1000 |
81.4 |
|
14 |
200 |
20.93 |
2 |
800 |
80.7 |
|
15 |
100 |
10.47 |
1 |
600 |
80.2 |
|
16 |
50 |
5.23 |
0 |
350 |
80.2 |
In our analysis of RPM versus Efficiency in Permanent Magnet DC (PMDC) motors, a compelling trend emerges from the data. Beginning at 100 RPM with an efficiency of 80.2%, we observe a consistent uptick in efficiency as RPM increases. This progression continues with remarkable stability, showcasing efficiency gains through the range of tested RPM values. Notably, beyond 600 RPM, we witness a significant enhancement in efficiency, reaching a peak of 89.5% at 1500 RPM. Although there are minor fluctuations, such as the slight dip at 1300 RPM, the overall correlation between RPM and efficiency remains notably positive. These findings underscore the critical relationship between motor speed and energy utilization, guiding us towards informed decisions in selecting PMDC motors for various applications.
Conclusion
In conclusion, the experimental study of a PMDC motor through dynamic response testing has provided crucial insights into its performance. By analyzing charge/discharge properties, motor efficiency, and speed/torque output, researchers have gained valuable knowledge applicable across industries. Understanding charge/discharge properties enhances energy management systems, crucial for applications like electric vehicles. Assessing motor efficiency aids in reducing energy consumption and optimizing performance. Characterizing speed and torque output enables precise control in applications such as robotics and industrial automation. Overall, this research deepens our understanding of PMDC motors and offers avenues for improving efficiency and performance in various fields, driving technological innovation and sustainability efforts.
References
[1] M.G. Say, E.O. Tylor, “Direct Current Machines”Pitman Press, Great Britain, 1982 [2] S.A. Nasar, “Hand Book of Electric Machines”Mc Graw-Hill,Inc.USA, 1987 [3] D.O. Anderson, “Modeling DC Electric Motors”Louisiana Tech. University, USA. [4] Staff of Festo Didactic “Electricity and New EnergyPermanent Magnet DC Motor Courseware Sample’’Online. Accessed on 6th July, 2016 [5] Online electrical engineering study site, “Permanent Magnet DC Motor or PMDC Motor | Working Principle Construction”. Online Available: http://www.electrical4u.com/permanent-magnetdc-motor-or-pmdc-motor/ Accessed on 5th July, 2016 [6] Chen JX, Guo YG, Zhou JG, Jin JX, “Performance Analysis of a Surface Mounted Permanent Magnet Brushless DC Motor using an Improved Phase Variable Model”, Record of the 2007 IEEE IndustryApplication Conference, pp. 2169 – 2174. [7] Kim CG, Lee JH, Kim HW, Youn MJ, “Study on Maximum Torque Generation for Sensorless Controlled Brushless DC Motor with Trapezoidal Back EMF”, IEE Proceedings Electric Power Applications, Vol 152, No 2, March 2005, pp. 277 – 291.
Copyright
Copyright © 2024 Anay Maheshwari, Parag Kshirsagar, Shruti Kulat, Bhargav Kulkarni, Vedant Kulkarni, Prof. Dr. D. B. Hulwan. This is an open access article distributed under the Creative Commons Attribution License, which permits unrestricted use, distribution, and reproduction in any medium, provided the original work is properly cited.

Download Paper
Paper Id : IJRASET65171
Publish Date : 2024-11-12
ISSN : 2321-9653
Publisher Name : IJRASET
DOI Link : Click Here
 Submit Paper Online

