Ijraset Journal For Research in Applied Science and Engineering Technology
- Home / Ijraset
- On This Page
- Abstract
- Introduction
- Conclusion
- References
- Copyright
Portfolio Optimization Strategies for the Common Investor
Authors: Harshitha S, Dr. R. Muthu Meenakshi
DOI Link: https://doi.org/10.22214/ijraset.2024.63621
Certificate: View Certificate
Abstract
Financial Analytics is a key field to making investment decisions and has been developed only recently. It involves analytical thinking, computational knowledge and creative thinking about investment strategies. There are many ways to invest money. Some people invest them in Gold, some in real estate, some create a fixed deposit, some in the stock market. Some people diversify their money into different sectors of the market and invest to get an optimal profit by understanding the market. This kind of investment is called portfolio management. Unlike gambling, understanding of the portfolio and its management can actively minimize the risks associated with investment. In the proposed research we tried to study the different strategies of investing in the different sectors and building a portfolio, with the express aim of creating optimal diversified portfolios. Our methods include optimizing the weights of different investment instruments in different sectors, with implementations carried out in Python and using time-series Python libraries. We have focussed on three different investment strategies in particular: (1) Genetic algorithms help us to divide the portfolio (chromosome) into the genes (sectors) and understand it in a better way. Exploiting the existing algorithms for optimizing fitness functions in genetic algorithms, we have implemented one strategy for optimizing portfolios; (2) Efficient frontier analysis from Markowitz theory helps in investing and creating our own portfolio. We developed some of the strategies that help in displaying portfolio allocation and efficient frontier graphs; (3) We have also implemented a new criterion in vogue in the financial markets today, the “Kelly Criterion” preferred by many investors all over the world. We used real time financial stock data to validate and test our functions. All the strategies developed are modular and we also show a proof-of-concept web interface for one of the developed strategies. It is hoped that our work enables investors in making better decisions about where to park their money and converting their wealth into high-yield portfolios.
Introduction
I. INTRODUCTION
As one of the quotes in finance says higher the risk greater the reward. Stock market majorly deals with risk and reward. To maintain both in equilibrium many theories and mathematical operations are developed. To invest, people choose many other fields than portfolio management as they feel that it is so risky. Proper analysis and readiness check over the sectors in the portfolio should be done before investing in it. Good analysis and research give a good portfolio, hence giving good reward with less risk. As said, there are many ways to value a portfolio.
One can use financial ratios to know the trends of the sectors in the portfolio, simple Balance sheet analysis can give good insight over a portfolio, trend of the market, tips from the stockbrokers.
Recent day’s data science also plays a key role in analysing the portfolio. There are many machine learning models that are used to validate the portfolio weights and calculate trends. Auto regression model and ARIMA Model are some of the machine learning models that help in constructing a mathematical model over time series data of a portfolio. CNN, Logistic regression, Neural networks are also used to back test the data. Therefore, with the whole discussion we can conclude that the stock market (portfolio) needs analysis and that is optimal portfolio strategies under Financial Analytics.
A while ago investment in the stocks and portfolio maintenance was done through stockbrokers. People used to invest in the stock market by using tips given by big shots of the market. Later, Finance evolved as a subject with greater research and potentiality and creativity. Nowadays, data science extended its roots to analyse time series data which is, Stock market data. With the knowledge of python and testing Machine learning models over this time series data gave good insights. Financial tech companies used this as a major turning point and established their own financial ideas. As a matter of confidentiality their research won't be able to get to the public. Therefore, people want these big financial companies to build their portfolios and maintain it. As we are growing rapidly in terms of the computational methods as well.
The portfolios can also be optimized by the computational methods of finding the financial ratios as well as the weights to be optimized. This motivates us to find some strategies to optimize the weights that can be invested by the investor to get the optimal portfolio allocations according to investor preferences or We can also create an opportunity for the investor to choose the optimal allocation from the experts as well by formulating some criteria.
There are many financial concepts that should be considered to understand the portfolio and its management. Some of the statistical techniques are also used in finance to validate a stock as well as a portfolio. Techniques like regression, correlation has its own place in financial analytics. As all we know correlation helps in knowing how the data points behave with respect to each other, dealing them with time series data can give some good insights. Basic techniques like Standard deviation which we call in finance as volatility and Mean are also used. Volatility calculates the risk by considering the log standard deviation of close. Expected Returns also plays an important role in the analysis of a stock or a portfolio which can be a good or bad one. These concepts can be taken into consideration for the analysis of the portfolio and can be used in further.
There are many financial ratios and portfolios that are in existence. In the world of finance, portfolio can be defined as a basket of investments made by the user. User has a freedom to create his own financial concept and financial ratio according to their portfolios. With the observations and research people create their own financial strategy to invest in the market. In the same efficient frontier is generally calculated by using Sharpe ratio for optimal allocation for a portfolio. But as finance provides freedom, people can use any of the advanced ratios and if they find that good returns are expected through the method, they can follow the method which can yield some good profit according to their portfolios.
Sharpe and Sortino ratios have their own place in the creation of an optimal portfolio, as they indicate the performance of a fund or stock. In this research, we used various measures to determine the optimal portfolio for different investment strategies, which can be applied in real-life scenarios since we utilized real-time data to calculate the optimum profit. Essentially, this research focused primarily on the weight allocation of the funds within the portfolio and its weighted permutations based on user preferences.
II. METHODOLOGY
The main objective of this research is to study and automate various financial models of strategies, algorithms and functions that help in trading and investing wisely with their portfolios, with a view to the market returns and to Obtain an overview of the world of finance to be better poised to develop the next-generation analytics toolkit with some advanced computation which is user friendly.
With this as our main objective and to create useful strategies which will help the user and the investor to know the optimal portfolio among the given weights which are allocated to the portfolio as we know for integrative financial analytics which helps the user to analyse the stock and the portfolio weights which he can invest. Functions that are developed are seen to be modular and maximum of the functions has their inputs as ticker value of that company or organization, start date and end date for a strategy and the allocated weights as its inputs for a strategy as well. Our main AIM is to back test these strategies with the real time financial data so that it comes in handy for the people in real time investments.
Glimpse of objectives
- Given a certain risk appetite, what Portfolio selection / allocation will yield maximum returns from a given set of permutations.
- Calculating the returns of the investment according to the weights and optimizing the portfolio allocation.
- Efficient frontier analysis with Sharpe ratio, risk and the returns of the weights
- Analysis of the weights and its permutations with the help of genetic algorithms and optimizing the weights based on the fitness value.
- Implementation of the most diverse set of sector allocations which would help in optimizing with genetic algorithm, Markowitz portfolio theory, Kelly Criterion
- Development of a user web interface to show the optimized weighted portfolio to invest using Gradio.
A. Literature Survey
There are many packages that are available in python. But there are very few packages that contribute towards finance and its analysis and the understanding of the known and unknown terms of the finance which would help in the optimization part of a portfolio. List of packages that are available and functions in them that contribute towards financial analysis are listed below. Note: Not every package and function are listed here:
TABLE I
Package
|
Package Name |
Functions Available |
|
Numpy |
Pmt, ipmt, ppmt, rate, mirr, Irr |
|
SciPy |
This package helps Numpy package with some of its statistical functions |
|
Pandas |
Helps in handling financial data |
|
Yahoo Finance |
Download the data. No need for any API key. An open source. |
|
Pyfolio |
Gives simple and complete tear sheets |
|
Pygad |
Genetic algorithm package used to find the optimal value with the help of the fitness value generated with the inputs. |
|
Matplot lib |
This package helps us to draw the graphs and its representation types helps us to interpret the data as well. |
|
itertools |
This is a library used to find the permutations of a given set of values of a list. |
|
Gradio |
This is a package used to draw a simple user interface for a machine learning algorithm with the help of python. |
|
Statsmodels |
This package is used for the statistical purpose of the finance where we can find some values of a fund. |
|
matplotlib |
To plot the graphs and scatter plots |
|
plotly |
used in dash to represent the scatter plots in web interface |
|
Numpy |
Pmt,ipmt,ppmt,rate,mirr,Irr |
|
Scipy |
This package helps Numpy package with some of its statistical functions |
|
Pandas |
Helps in handling financial data |
B. Proposed System and Architecture
The proposed system and architecture for this research paper involves a comprehensive approach to financial analysis and portfolio optimization. The process begins with the collection of time series data for stock market movements, which is downloaded from sources such as Yahoo Finance. If required, the downloaded data is pre-processed to ensure it is in a suitable format for further analysis.
The researchers utilize Python packages, such as pandas, to work with the financial data. The underlying mathematical formulas for the financial concepts under study are investigated and understood, forming the foundation for the analysis. The code is designed in a modular fashion, with each financial concept implemented in a separate function, ensuring a structured and maintainable approach.
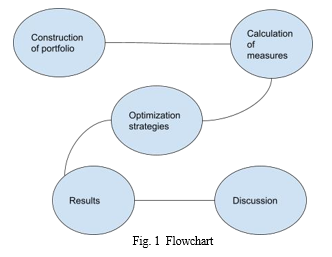
The system automates the process of generating tear sheets for financial strategies, allowing for efficient and consistent reporting. Plots are generated, if required, to visualize the financial data and analysis, providing valuable insights to the researchers.
The researchers enumerate various financial portfolios and ratios from different sources and implement them in the system. The portfolio construction process considers the weights allocated to different sectors and the sectors included in the portfolio, ensuring a well-diversified approach. The calculation of financial measures is performed using statistical methods or Python libraries, providing a robust and reliable analysis. Three optimization strategies are implemented: Genetic Algorithm, Markowitz Portfolio Theory, and Kelly Criterion, each offering a unique perspective on portfolio optimization.
Finally, the portfolio is visualized using the Matplotlib library, and the graphs are interpreted to draw conclusions. This comprehensive approach, leveraging the power of Python and its robust financial data analysis capabilities, aims to provide a robust and automated system for financial analysis and portfolio optimization.
C. Dataset Description
Stock market data is a time series data. It gets updated with time frequently. This data consists of 6 columns such as High, Low, Open, Close, Adjusted Close and Volume. Rows in this data completely depend on the user as it completely depends upon the date and time we chose. We can download daily, monthly, quarterly and yearly data depending upon the user interest and analysis he/she wishes to perform over. The data is completely numerical. There are many ways to download real time stock data. Some of the packages like yahoo finance, Quandl, Google finance API helps to download the data. Or else we can download the data from the web manually. To provide ease with downloading the data with time we used yahoo finance. Data is downloaded using yahoo finance as it is open source, and no special API Key is needed. Yahoo finance provides stock price data of many companies using ticker values of that company/organization. The data_download functions help the user to download the data by just entering the ticker value of that company/organization, start date and end date. Users can download the most recent data and historical data too with this function. Here is a screenshot of the stock market time series data.
TABLE III
Sample Data Set MPT
|
Date |
Open |
High |
Low |
Close* |
Adj. close** |
Volume |
|
14-Jun-2021 |
15,7940 |
15,791.90 |
15,60650 |
15744.80 |
15,744.80 |
- |
|
11-Jun-2021 |
15,796.45 |
15,835.55 |
15,749.80 |
15,799.35 |
15,799.35 |
3,63,000 |
|
10-Jun-2021 |
15,692.10 |
15,751.25 |
15,648.50 |
15,737.75 |
15,737.75 |
2,98,300 |
|
09-Jun-2021 |
15,766.30 |
15,800.45 |
15,566.90 |
15,635.35 |
15,635.35 |
4,57,900 |
|
08-Jun-2021 |
15,773.90 |
15,778.80 |
15,680.00 |
15,740.10 |
15,740.10 |
3,78,200 |
|
07-Jun-2021 |
15,725.10 |
15,773.45 |
15,678.10 |
15,751.65 |
15,751.65 |
3,94,000 |
|
04-Jun-2021 |
15,712.50 |
15,733.60 |
15,622.35 |
15,670.25 |
15,670.25 |
4,14,200 |
|
25-May-2021 |
15,291.75 |
15,293.85 |
15,163.40 |
15,208.45 |
15,208.45 |
4,41,500 |
D. Dataset used for genetic Algorithm
As we know that genetic algorithm is an optimization algorithm which is mainly used for the optimization purposes for nonlinear data. We have the data which is non-linear as the data used for the genetic algorithm is that of an array of weights considered in different sectors of the market considered as the weighted allocation of a portfolio. The permutations of those weights are taken as an input for the genetic algorithm.
TABLE IIIII
Sample Data Set for GA
|
stock 1 |
stock 2 |
stock 3 |
stock 4 |
stock 5 |
|
0.16 |
0.17 |
0.18 |
0.19 |
0.30 |
|
0.16 |
0.17 |
0.18 |
0.3 |
0.19 |
|
0.3 |
0.16 |
0.17 |
0.19 |
0.18 |
|
0.16 |
0.18 |
0.19 |
0.17 |
0.3 |
E. Financial Ratios
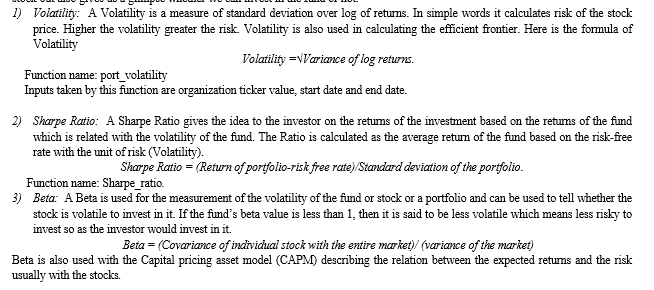
Financial Ratios play a very important role in analysing the stock of a company. There are many financial ratios that are theoretically discovered. Financial ratios that are developed are listed below. These ratios not only give the report of the fund or the stock but also gives us a glimpse whether we can invest in the fund or not.
F. Genetic Algorithm
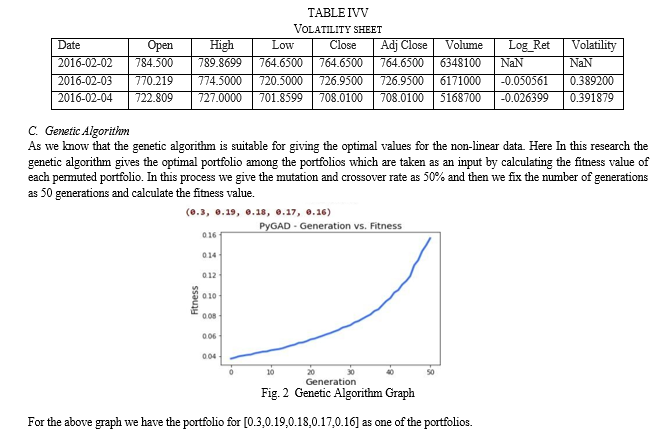
Genetic algorithm is one of the prominent algorithms used in the machine learning concepts for optimization solutions which are intended to give the optimal solutions for the non-linear data.
Genetic Algorithm (GA) is a nature-inspired algorithm that has extensively been used to solve optimization problems. It belongs to the branch of approximation algorithms because it does not guarantee to always find the exact optimal solution; however, it may find a near-optimal solution in a limited time. In this lesson, we will learn the basics of GA in terms of its source of inspiration, general structure, working, and implementation.
Optimization is the process of finding the best solution to a problem. For example, finding the shortest route to the destination, scheduling the hospital staff in the most efficient manner possible, or planning the day's activities to best utilize the available time. To solve the real-world optimization problems, the problems are formulated as mathematical functions and optimization deals with minimizing/maximizing the output of that function to find the best solution. Once the problem is formulated mathematically, an optimization algorithm such as GA is used to find the best solution (optimal solution) to that problem. The optimization process using GA is depicted in the following diagram.
GA involves many kinds of calculations which are needed to optimize the required non-linear data which is our data for the selection of the optimal solution for the portfolio selection. The ratios or functions involved in the optimization process is that there are:

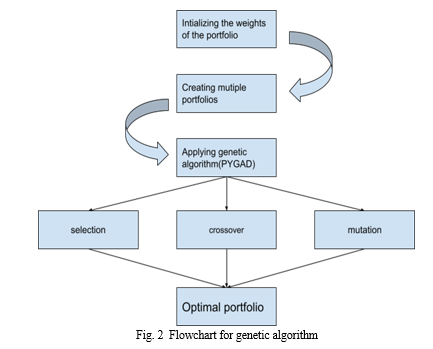
3) Crossover/mutation: Crossover and mutation are the two main steps for the genetic algorithm which intends to reproduce the offsprings and use for the calculation of the fitness and then giving the best-off springs as the optimal result for the further process. In this work, as we are working with the package PYGAD for the genetic algorithm we are choosing the single point crossover type and random mutation type with a fixed number of generations.
G. Modern Portfolio theory
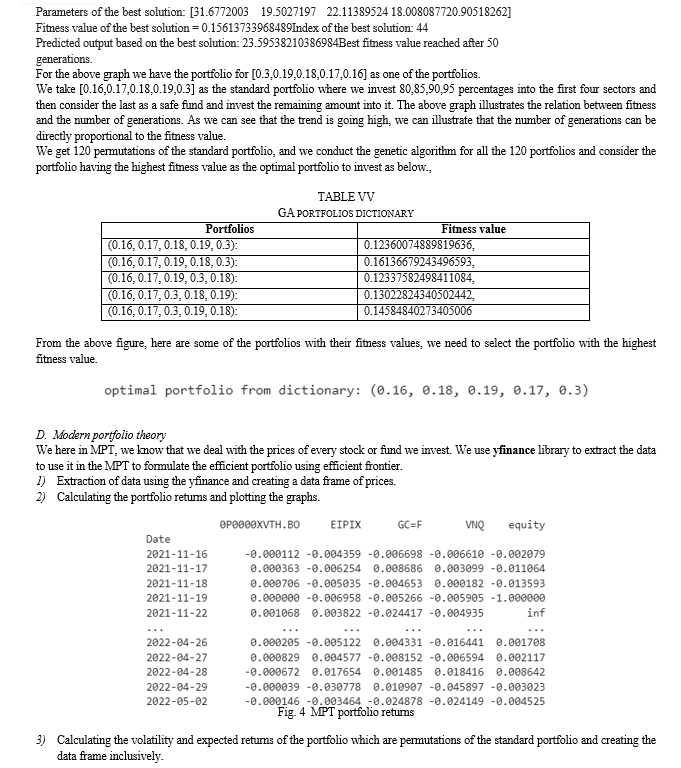
This modern portfolio theory is used basically for the investors to choose the investments by accepting the level of risk involved within it to get the maximum profit within a given period. As we all know that each asset has their own risk and reward, some with high risk and low reward and some with low risk and high reward and vice versa.
In this process we can achieve a point where we can attain the optimal value of a fund where we invest the optimal amount to get the optimal profit in a best way possible.
Mainly, This MPT is used to diversify our funds into various sectors according to the optimum level to get the risk lowered and gain the profit. It also states that the risk of a single fund or stock affects the whole portfolio returns as well. As we know a single investment makes a huge change in the portfolio as well. We need to take care of the investment with minimal risk only. MPT involves statistic measures into act such as correlation and variance of the fund or portfolio.

As an investor, everyone wants low risk. We need to follow some tips from great investors, and we can achieve that feat with a serious analysis and with experience where we require enough knowledge about the funds we invest. Every investor needs to invest their money in a diversified manner where we split the money we invest into different sectors and we look forward to the negative correlated funds which are., Govt. ETF (exchange traded funds).
There are risks that we cannot avoid in the meantime of investment but there is a risk which we can avoid which is known as the unsystematic risk. This risk will also get diversified as the investor diversifies the assets in his portfolio.
H. Efficient Frontier
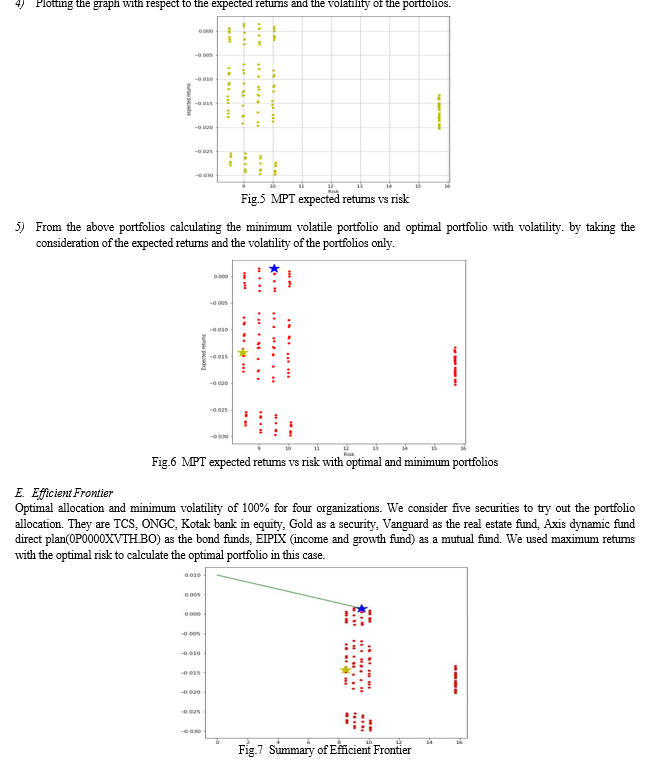
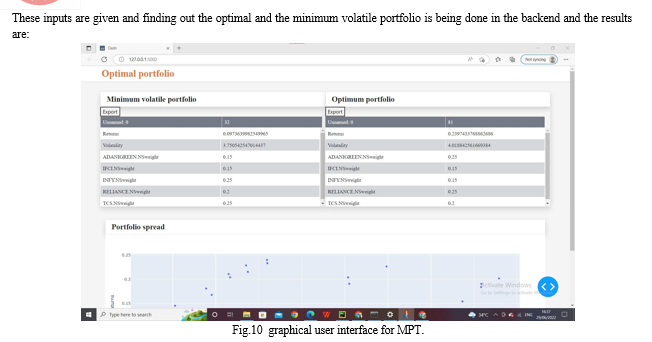
The Portfolio is one of the tools that is used to invest in the stock market. Generally, investment without maintaining a portfolio increases risk for the user. Portfolios are used for diversification. Here, investment is done by a set of good companies. For suppose the amount to be invested is 100. We diversify it by investing it in different companies with some ratio rather than investing all of them in one company(funds). With this risk profile of the user decreases. To calculate this portfolio, we follow Modern Portfolio theory. An extension to this is an efficient frontier. In an efficient frontier we generate so many random portfolios on the same set of companies. In that we choose the best allocation using expected returns and the risk involved. With generated random portfolios we calculate which portfolio gives the optimal returns and the low returns with the risk involved, we mark it as the optimal portfolio. Generally, Sharpe ratio is used in calculating efficient frontier.
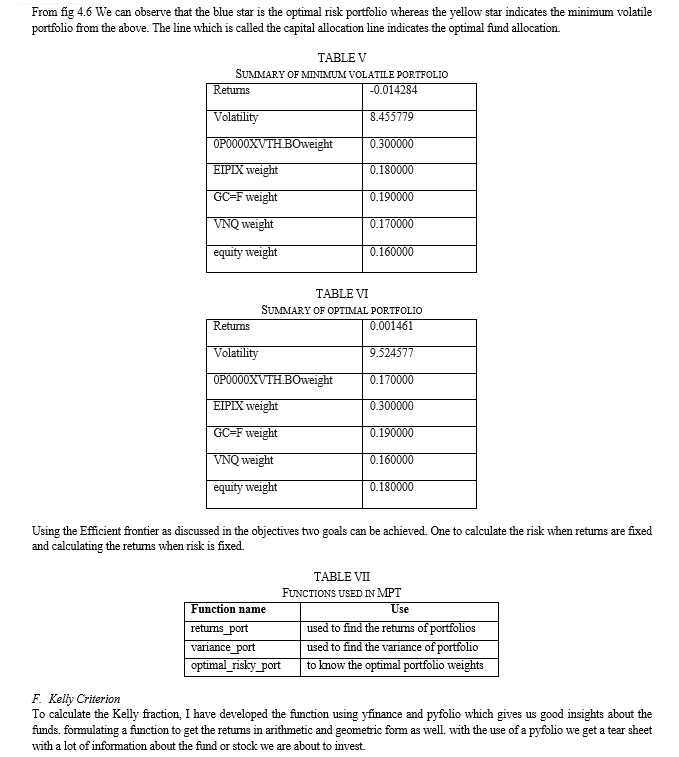
In Sharpe ratio we use standard deviation of all the returns, we also calculate the minimum volatility point. Users can choose this when he/she doesn’t want to bear risk. Optimal portfolio has some risk but helps in yielding higher returns. So as an outcome of the function we will have optimal portfolio allocation i.e. maximum expected return allocation, minimum volatility allocation and efficient frontier plot. We also have the minimum risk portfolio which has the maximum expected returns with minimum amount of risk involved within it.
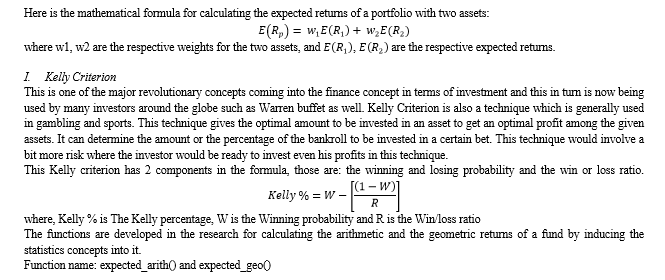
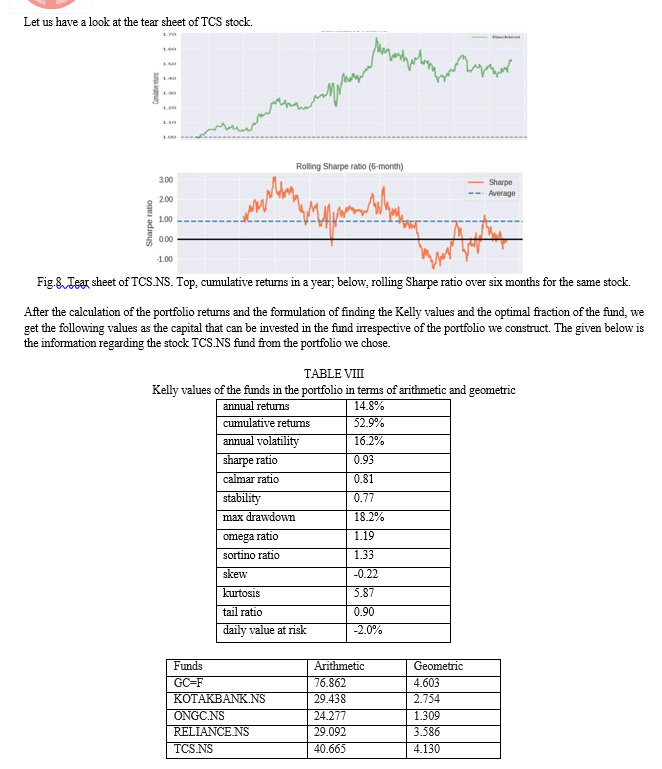
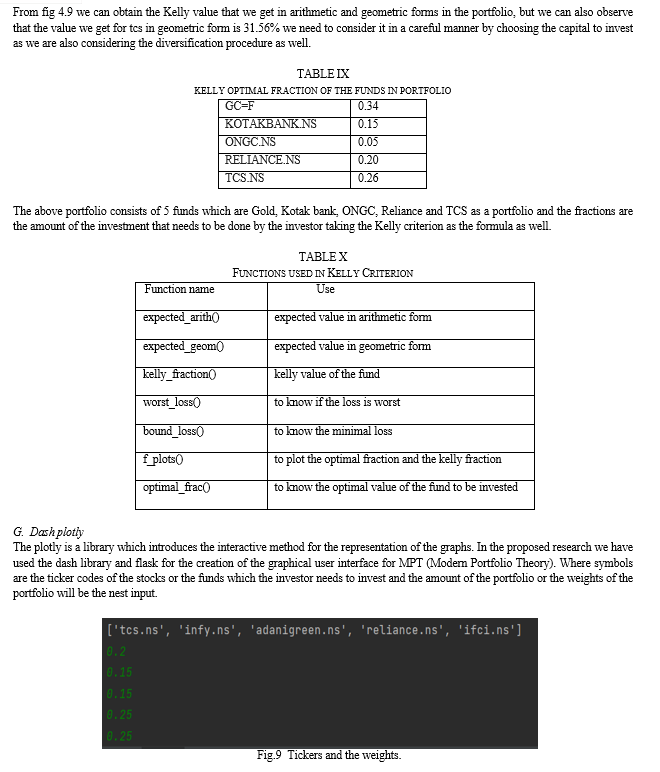
We tried to find the Kelly criterion fraction by formulating the function by using NumPy. As we cannot say whether a fund will return us the positive return after we invest or not, but we can estimate the returns of a fund by using this strategy as well.
We also need to consider the major point in the terms of investing is Diversification., where even the Kelly criterion gives us the huge value, we stick to the diversified portfolio and not invest more than 25% in any of the fund.
We have a package called pyfolio which is used to give us a tear sheet (information about the fund) in a very peculiar manner with tables, charts) we get enough information about the fund such as Sharpe ratio, beta, alpha etc.
Kelly criterion is a strategy nowadays growing rapidly. The calculations are done with the use of the winning and losing probability and the win ratio as well. The risk among the investment made are also high comparatively but it can produce more optimal value as the profit as well.
It is very crucial to know the winning and losing probability of the bet or investment that we are about to do as well, which could turn the investment upside down. Kelly Criterion is a pure mathematics-based formula which we use. The results of Kelly can be influenced by many factors such as the input of the winning probability as wrong as well.
J. Dash plotly
Dash is a web framework used to create the graphical user interface in a very creative manner and it helps the user of it to understand the plots in a very interactive manner. plotly is used in dash to create the interface and to represent any kind of graphs in it. We have used the flask for the interface.
III. RESULTS
A. Beta of the Market
Beta value is very much useful in calculating how volatile the stock is. A stock that swings more than the market over time has a beta above 1.0. Function named “beta” is used in calculating. If we calculate the beta value of TCS by this function, we get a value of 0.5887659 which is less than 1. With the definition of beta TCS is less volatile.
B. Volatility
Here are the values of volatility. It is calculated in the time slot Feb 2016 to Feb 2021 for Google. If observed volatility is high in the year 2020-2021 because of the COVID-19 pandemic. Values of volatility have seen a greater change. At this period many companies’ stock prices have increased. Stock market had a good growth by 1000 points. But this was all sudden. As we know it takes time in building a stock price. This sudden change makes stock so volatile. Higher the volatility, higher the risk.
Conclusion
The Stock market mainly has two rules 1) Do not lose your money 2) Do not forget the 1st point. With the help of the technical and computational knowledge we can attach proofs to the decisions we make and that is financial analytics. Financial Analytics has good scope. There are many ways to understand a portfolio. It can be through mere observations or by experts\' advice or by using some mathematical formula. In this research we tested the genetic algorithm with different weights and were able to get results based on the weights of the portfolio considered as the gene in its term. We also tested the Modern portfolio theory using the efficient frontier with expected returns and risk of the funds, which also provided us with an optimal value of portfolios considered with it. But there are many mathematical formulas and strategies to find the optimal values or the portfolios such as Calmar ratio, Treynor ratio that can help in optimizing the efficient frontier even better. This whole sum of functions is modular, so in future any functions that are to be added into this package becomes easy. We also used the Kelly Criterion for a stock to see its optimum weight that can be invested by lowering the risk and gaining the optimal profit. The future work would supposedly be the selection of the optimal portfolio gained from the strategies and help the investor to invest money efficiently.
References
[1] Oliphant, T.E., 2006. A guide to NumPy, Trelgol Publishing USA. [2] Markowitz, Harry. “Portfolio Selection.” The Journal of Finance, vol. 7, no. 1, 1952, pp. 77–91. doi: 10.1111/j.1540-6261.1952.tb01525.x [3] Carta, Andrea and Claudio Conversano. “Practical Implementation of the Kelly Criterion: Optimal Growth Rate, Number of Trades, and Rebalancing Frequency for Equity Portfolios.” Frontiers in Applied Mathematics and Statistics (2020). [4] Edward O. Thorp, 2011.\"The Kelly Criterion in Blackjack Sports Betting, and the Stock Market,\" World Scientific Book Chapters, in: Leonard C MacLean & Edward O Thorp & William T Ziemba (ed.), THE KELLY CAPITAL GROWTH INVESTMENT CRITERION THEORY and PRACTICE, chapter 54, pages 789-832, World Scientific Publishing Co. Pte. Ltd. [5] Estrada, Javier. (2009). “Geometric Mean Maximization: An Overlooked Portfolio Approach?” The Journal of Investing. 19. 10.2139/ssrn.1421232. [6] Kelly, John L. “A new interpretation of information rate.” IRE Trans. Inf. Theory 2 (1956): 185-189. [7] Kyong Joo Oh, Tae Yoon Kim, Sung-Hwan Min, Hyoung Yong Lee, Portfolio algorithm based on portfolio beta using genetic algorithm, Expert Systems with Applications, Volume 30, Issue 3, 2006, Pages 527-534, ISSN 0957-4174, https://doi.org/10.1016/j.eswa.2005.10.010.
Copyright
Copyright © 2024 Harshitha S, Dr. R. Muthu Meenakshi. This is an open access article distributed under the Creative Commons Attribution License, which permits unrestricted use, distribution, and reproduction in any medium, provided the original work is properly cited.

Download Paper
Paper Id : IJRASET63621
Publish Date : 2024-07-13
ISSN : 2321-9653
Publisher Name : IJRASET
DOI Link : Click Here
 Submit Paper Online

