Ijraset Journal For Research in Applied Science and Engineering Technology
- Home / Ijraset
- On This Page
- Abstract
- Introduction
- Conclusion
- References
- Copyright
Comparative Study of Pre-Engineered Building with Varying Wind Speed
Authors: A. A. Khanche, P. J. Salunke
DOI Link: https://doi.org/10.22214/ijraset.2024.64301
Certificate: View Certificate
Abstract
This research explores the structural performance of Pre-Engineered Buildings (PEB) using STAAD-Pro software, specifically analyzing the effects of different wind speeds. The wind analysis follows the guidelines of IS 875 (Part III) – 2015, with an emphasis on optimizing steel usage in warehouse structures of sizes 20×100 m, 30×100 m, and 40×100 m, situated in three locations: Mumbai, Delhi, and Mysore. The wind speeds considered for these locations are 44 m/s in Mumbai, 47 m/s in Delhi, and 33 m/s in Mysore. The objective of the study is to examine how varying wind speeds affect PEB design and to optimize steel usage for these structures.
Introduction
I. INTRODUCTION
Pre-engineered buildings (PEBs) represent a revolutionary approach to construction, offering a versatile and efficient alternative to traditional building methods. Steel buildings claim resilience against fire, earthquakes, and cyclones, ensuring both safety and longevity. In a country like India, characterized by diverse and extreme weather conditions, steel buildings prove to be energy-efficient, especially when adequately insulated due to their low thermal mass. The evolving mindset towards long-term investments in quality is contributing to the growth of PEBs in the Indian construction industry.
Steel structures also exhibit superior strength-to-weight ratios compared to reinforced concrete (RCC) and can be easily dismantled. PEBs feature bolted connections, allowing for reusability after dismantling, facilitating future shifts or expansions as needed.
The PEB concept, originating in the United States during the early 20th century, has witnessed remarkable adoption. Nearly 70% of single-storey non-residential construction in the USA now utilizes pre-engineered structures, ranging from small car parking sheds to wide clear-span aircraft hangars and low-rise multi-storey buildings. The versatility of PEB applications extends to almost every conceivable building use.
In conclusion, the adoption of pre-engineered buildings represents an example shift in the construction industry, offering a sustainable, efficient, and cost-effective solution to meet the evolving needs of modern construction projects. The versatility, speed, and economic benefits of PEB position them as a formidable player in the ever-growing steel industry on a global scale.
II. LITERATURE REVIEW
Syed Firoz et al. (2012) highlighted the advantages of Pre-Engineered Buildings (PEB) for single-story structures, noting their efficiency and real-time multidimensional data integration, with design facilitated by STAAD Pro software. Ms. Darshana P. Zoad (2012) explored PEB within the Indian context, finding that Indian codes impose stricter live load requirements compared to American standards, emphasizing the importance of adhering to local codes. Aijaz Ahmmad Zende et al. (2013) demonstrated significant steel weight reductions in PEB compared to conventional frames, highlighting PEB's efficiency for long-span structures. C.M. Meera (2013) assessed PEB in industrial warehouses, finding them more cost-effective and faster to construct. Jatin D. Thakar et al. (2013) analyzed varying bay spacings in PEB warehouses, showing that optimal spacing can reduce steel usage. Pradeep V et al.
(2014) reported a 30% cost reduction with PEB compared to conventional steel buildings. Sagar Wankhade et al. (2014) confirmed PEB's superior seismic resistance and cost savings. G. Durga Rama Naidu et al. (2014) found PEB reduced steel usage by up to 76%. G. Sai Kiran et al. (2014) compared Indian and American codes, noting differences in steel consumption due to varying deflection limits and loading criteria. Rohit C. Pingle et al. (2015) showed that PEB reduces steel and concrete quantities, offering cost advantages. Jinsha M S et al. (2016) identified 8-meter bay spacing as the most economical for PEB. Neeraja Gaidhani et al. (2017) focused on PEB connections, emphasizing their flexibility and recyclability.
Seena Somasekharan et al. (2017) found diagonal bracing most effective for wind load scenarios. Apurv Rajendra Thorat et al. (2017) demonstrated PEB's superior performance under seismic loads compared to conventional structures. Shashank Pattanshetti et al. (2017) observed a 33% reduction in weight with PEB. Vishwanath Pujar et al. (2017) compared Indian and U.S. codes, noting the cost-effectiveness of tapered sections in PEB. Pratik R Atwal et al. (2017) found international codes could reduce structural weight more than Indian standards. Deepti D Katkar et al. (2018) found PEB to be 30% lighter and more cost-effective than conventional trusses. K. Prabin Kumar et al. (2018) demonstrated the effectiveness of PEB in hangar design with enhanced ductility and stiffness. Balamuralikrishnan R. et al. (2019) showed that tapered sections in PEB models were more cost-effective than standard sections. Suraj Tale et al. (2019) optimized bracing systems, finding PEB structures more efficient than conventional ones. Gopika S. Kumar et al. (2020) confirmed PEB's superior deflection performance and cost savings, particularly with diagonal bracing. Swetha Pantheeradi et al. (2022) highlighted PEB's advantages in quality control and cost-effectiveness for warehouses. Anushri A. Isal et al. (2022) examined how varying ridge angles affect PEB structural performance, offering insights into optimizing PEB designs.
III. METHODOLOGY
The models are modelled and analyzed using STAAD PRO software, the models are as follows:
- Model 1: PEB Structure with 20 m width span and 33 m/s wind speed
- Model 2: PEB Structure with 20 m width span and 44 m/s wind speed
- Model 3: PEB Structure with 20 m width span and 47 m/s wind speed
- Model 4: PEB Structure with 30 m width span and 33 m/s wind speed
- Model 5: PEB Structure with 30 m width span and 44 m/s wind speed
- Model 6: PEB Structure with 30 m width span and 47 m/s wind speed
- Model 7: PEB Structure with 40 m width span and 33 m/s wind speed
- Model 8: PEB Structure with 40 m width span and 44 m/s wind speed
- Model 9: PEB Structure with 40 m width span and 47 m/s wind speed
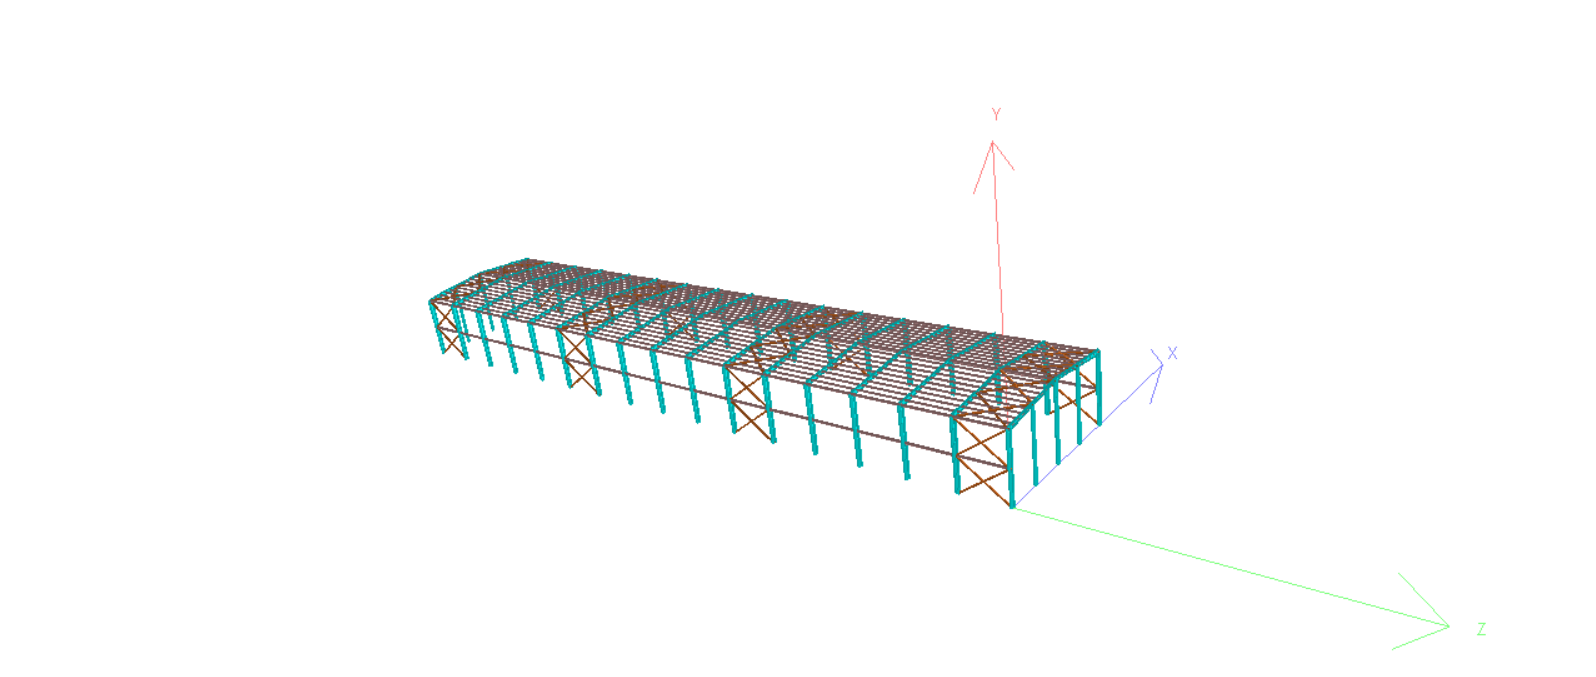 Fig 1. 3-D Details of Model
 Fig 2. PEB Structure Delhi 20 x 100 m
IV. CALCULATION
A. Load Calculation
1) Dead Load (DL)
Weight of the sheeting = 5 kg/m2
Weight of purlin = 10 kg/m2
Weight of sagrod, fixtures = 5 kg/m2
Total Dead Load =20 kg/m2
Total Dead Load =0.20 KN/m2
Dead Load for centre span =0.20 x 6.25
=1.25 KN/m
Dead Load for End span =1.25/2 =0.625
2) Live Load (LL) As per IS 875 (part II) -2015
Live Load per unit area =0.75 KN/m2
Live Load for centre span =0.75 x 6.25
=4.68 KN/m
Live Load for End span =4.68/2
=2.34 KN/m
3) Collateral Load (CL)
Weight of lightning fixture =5 kg/m2
Weight of HAVAC duct =5 kg/m2
Total =10 kg/ m2
Collateral Load =6.25 x 0.1
=0.625 KN/m
4) Wind Load (WL) As per IS 875 (par III) -2015
Basic wind speed (Vb)-Delhi =47 m/s
Design wind speed (Vz) =Vb x K1xK2xK3xK4
Where K1=Risk Coefficient Factor
=1
K2=Terrain & Height Factor
=0.91
K3=Topography Factor
=1
K4=Factor for Cyclonic Region
=1
Thus Vz = 42.77 m/s
Design Wind Pressure Pz =0.6 x (Vz)2
=1097.6 N/m2
Pd =Pz x Kd x Ka x Kc
Wind Directionality Factor Kd =0.9
Area Averaging Factor Ka =0.85
Combination Factor Kc =0.5
Thus Pd= 755.7 N/m2
Design Pressure coefficients
Condition of Building =Partially Enclosed
Internal Pressure Coefficient (Cpi) =± 0.5
0.5
+ 0.5 Towards the component
- 0.5 Away from the component
h/w =0.23
l/w =2.50
Table 1 wind calculation
|
Direction of Wind |
Load For Column |
Load for Rafter |
Load for Gabble Column |
|||||||||
|
Left |
Right |
Left |
Right |
Left(-z) |
Right(+z) |
|||||||
|
M |
E |
M |
E |
M |
E |
M |
E |
M |
E |
M |
E |
|
|
X+0.5 |
0.94 |
0.47 |
-3.54 |
-1.77 |
-6.9 |
-3.45 |
-4.25 |
-2.12 |
-4.16 |
-2.08 |
-4.16 |
2.08 |
|
X-0.5 |
5.67 |
2.83 |
1.18 |
0.59 |
2.17 |
1.08 |
0.47 |
0.23 |
-0.3 |
-0.19 |
-0.38 |
-0.19 |
|
-X+0.5 |
-3.54 |
-1.77 |
-0.94 |
-0.47 |
-4.25 |
-2.12 |
-6.90 |
-3.45 |
-4.16 |
-2.08 |
-4.16 |
-2.08 |
|
-X-0.5 |
1.18 |
0.59 |
5.67 |
2.83 |
0.47 |
0.23 |
-2.17 |
-1.08 |
-0.38 |
-0.19 |
-0.38 |
-0.19 |
|
Z+0.5 |
-4.72 |
-2.36 |
-4.72 |
-2.36 |
-6.14 |
-3.07 |
-6.14 |
-3.07 |
0.76 |
0.38 |
2.27 |
1.13 |
|
Z-0.5 |
0 |
0 |
0 |
0 |
-1.42 |
-0.71 |
-1.42 |
-0.71 |
4.53 |
2.26 |
1.51 |
0.75 |
|
-Z+0.5 |
-4.72 |
-2.36 |
-4.72 |
-2.36 |
-6.14 |
-3.07 |
-6.14 |
-3.07 |
-2.27 |
-1.13 |
0.76 |
0.38 |
|
-Z-0.5 |
0 |
0 |
0 |
0 |
-1.42 |
-0.71 |
-1.42 |
-0.71 |
1.51 |
0.75 |
4.53 |
2.26 |
V. RESUL
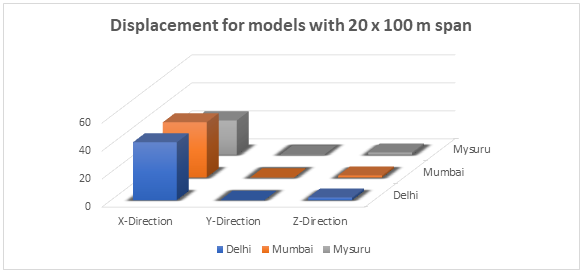
Graph 1: Displacements for models with 20 x 100 m span
The above graph 1 shows the displacement for models with 20 x 100 m span in Delhi, Mumbai, Mysuru with wind speed wind speed 47 m/s, 44 m/s, 33 m/s respectively
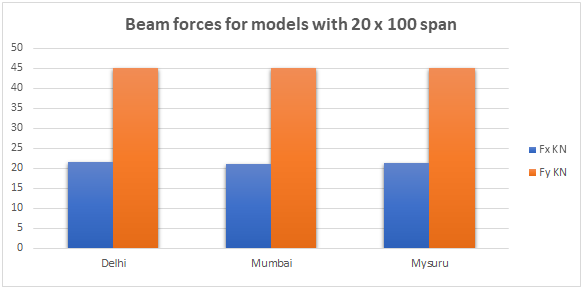
Graph 2: Beam forces for models with 20 x 100 m span
The above graph 2 shows the beam forces for 20 x 100 m span and value for Fy comparatively maximum and Fx is minimum
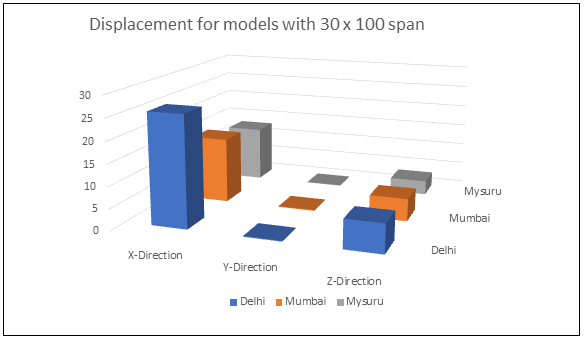
Graph 3: Displacement for models with 30 x 100 m span
The above graph 3 shows the displacement for models with 30 x 100 m span width in Delhi, Mumbai, Mysuru with wind speed wind speed 47 m/s, 44 m/s, 33 m/s respectively
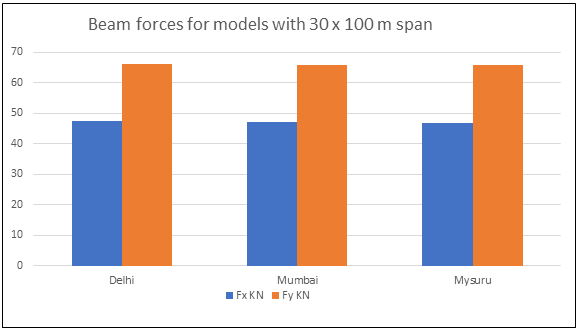
Graph 4: Beam forces for models with 30 x 100 m span
The above graph 4 shows the beam forces for 30 x 100 m span and value Fy comparatively maximum and Fx is minimum.
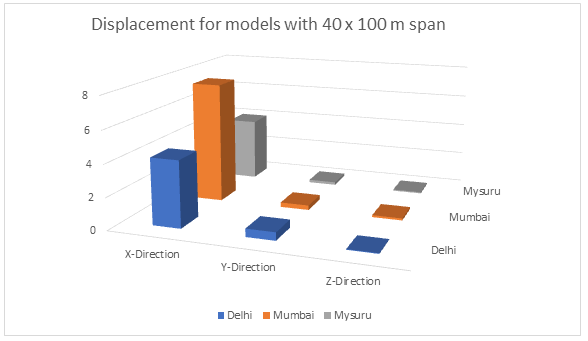
Graph 5: Displacement for models with 40 x 100 m span
The above graph 5 shows the displacement for models with 40 x 100 m span in Delhi, Mumbai, Mysuru with wind speed wind speed 47 m/s, 44 m/s, 33 m/s respectively.
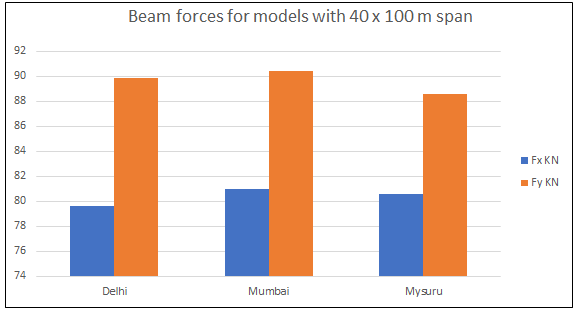
Graph 6: Beam forces for models with 40 x 100 m span
The above graph 6 shows the beam forces for 40 x 100 m span and value of Fy comparatively maximum and Fx is minimum.
Conclusion
The following conclusion are drawn from the models which are modelled using Staad pro software. 1) It is seen that the steel weight of Pre-Engineered building depends on the wind speed and span width. 2) When model are varied with span and wind speed the minimum steel weight is observed in the case of 20 x 100 span and wind speed 33m/s which is 668.490 KN while the maximum steel 40x100 Delhi. 3) Balance between span and wind speed is the key factor in optimizing the steel. 4) The steel weight is minimise not only by low wind speed but also optimizing the span. 5) The displacement is said to be maximum in the case of model having 20 X100 m span and wind speed is 47 m/s wind speed which is 41 .33 and it is minimum in the case of 40X 100m span with wind speed 33m/s. 6) The beam forces are maximum in case of model 40 X 100 m Span and minimum in case of 20 X 100 span 7) Bending moment also maximum in the case of 40 X 100m and minimum in 20 X 100 m span 8) The maximum percentage reduction in horizontal Fx is 4.12% and minimum 2.37%for wind speed 47m/s 9) When models are varied as per the wind speed the maximum reduction of steel weight in case of wind Speed 33m/s which is 89.55 % and minimum observed in case of 47m/s which is 88.30% In conclusion, the results emphasize that both span width and wind speed are critical factors that must be balanced in PEB design to minimize material use while maintaining structural safety
References
[1] Syed Firoz et al “DESIGN CONCEPT OF PRE-ENGINEERED BUILDING” International Journal of Engineering Research and Applications (IJERA) Vol. 2, Issue 2,Mar-Apr 2012, pp.267-272. [2] Ms Darshana P zoad “EVALUATION OF PRE-ENGINEERING STRUCTURE DESIGN BY IS-800 AS AGAINSTPRE-ENGINEERING STRUCTURE DESIGN BY AISC” International Journal of Engineering Research & Technology (IJERT) Vol. 1 Issue 5, July – 2012 [3] Aijaz Ahmad Zende et al “Comparative Study of Analysis and Design of Pre-Engineered Buildings and Conventional Frames” IOSR Journal of Mechanical and Civil Engineering (IOSR-JMCE) Volume 5, Issue 1 (Jan. - Feb. 2013). [4] C.M. Meera “PRE-ENGINEERED BUILDING DESIGN OF AN INDUSTRIAL WAREHOUSE” International Journal of Engineering Sciences & Emerging Technologies, June 2013. Volume 5, Issue 2, pp: 75-82. [5] Jatin D Thakkar et al “COMPARATIVE STUDY OF PRE-ENGINEERED STEELSTRUCTURE BY VARYING WIDTH OF STRUCTURE” International Journal of Advanced Engineering TechnologyInt J Adv Engg Tech/IV/III/July-Sept.,2013/56-62. [6] Pradeep V et al “COMPARATIVE STUDY OF PREENGINEERED AND CONVENTIONAL INDUSTRIAL BUILDING” International Journal of Engineering Trends and Technology (IJETT) – Volume 9 Number 1 - Mar 2014. [7] Sagar Wankhade et al “REVIEW PAPER ON COMPARISON OF CONVENTIONAL STEEL BUILDING & PRE-ENGINEERING BUILDING” International Journal of Research in Advent Technology, Vol.2, No.5, May 2014. [8] G. Durga Rama Naidu et al “COMPARATIVE STUDY OF ANALYSIS AND DESIGN OF PRE-ENGINEERED BUILDINGS AND CONVENTIONAL FRAMES” International Journal of Engineering Research and Development Volume 10, Issue 9 (September 2014), PP.33-41. [9] G.Sai Kiran et al “COMPARISON OF DESIGN PROCEDURES FOR PRE ENGINEERING BUILDINGS (PEB): A CASE STUDY” International Journal of Civil, Architectural, Structural and Construction Engineering Vol:8 No:4, 2014. [10] Rohit P Pingle et al “COMPARATIVE STUDY OF CONVENTIONAL STEEL STRUCTURE AND PRE-ENGINEERED STEEL STRUCTURE (PEB)” International Journal of Emerging Science and Engineering (IJESE) Volume-3 Issue-7, May 2015. [11] Jinsha M Set al “ANALYSIS OF PRE –ENGINEERED BUILDINGS” International Journal of Science and Research (IJSR) Volume 5 Issue 7, July 2016. [12] Neeraja Gaidhani et al “DESIGN AND ANALYSIS OF SPECIAL STEEL CONNECTIONS ON PRE-ENGINEERED STEEL BUILDINGS” International Journal of Advance Technology in Engineering And Sciences Vol no 5 Issue no 03 March 2017. [13] Deepti D Katkar et al “REVIEW PAPER ON COMPARATIVE STUDY OF AN INDUSTRIAL PRE – ENGINEERED BUILDING WITH CONVENTIONAL STEEL BUILDING” International Research Journal of Engineering and Technology (IRJET) Volume: 05 Issue: 10 | Oct 2018. [14] Balamuralikrishnan R. et al “COMPARATIVE STUDY ON TWO STOREY CAR SHOWROOM USING PRE-ENGINEERED BUILDING (PEB) CONCEPT BASED ON BRITISH STANDARDS AND EURO CODE” Civil Engineering Journal Vol. 5, No. 4, April, 2019. [15] Gopika .S. Kumar et al “COMPARATIVE ANALYSIS ON PRE-ENGINEERED AND CONVENTIONALBUILDINGS WITH DIAGONAL BRACES” International Research Journal of Engineering and Technology (IRJET) Volume: 07 Issue: 06 | June 2020. [16] Swetha Pantheeradi et al “COMPARATIVE STUDY OF PRE-ENGINEERED BUILDING AND CONVENTIONAL STEEL BUILDING” International Journal of Engineering Research & Technology (IJERT) Vol. 11 Issue 01, January-2022. [17] IS : 800 - 2007 :- General Construction In Steel - Code of Practice. [18] IS 1893- Part I (2016) Criteria for Earthquake Resistant Design of Structures. [19] IS 875- Part III (2015),Design Loads (Other Than Earthquake) for Buildings and Structures- Code Of Practice.
Copyright
Copyright © 2024 A. A. Khanche, P. J. Salunke. This is an open access article distributed under the Creative Commons Attribution License, which permits unrestricted use, distribution, and reproduction in any medium, provided the original work is properly cited.

Download Paper
Paper Id : IJRASET64301
Publish Date : 2024-09-21
ISSN : 2321-9653
Publisher Name : IJRASET
DOI Link : Click Here
 Submit Paper Online


