Ijraset Journal For Research in Applied Science and Engineering Technology
- Home / Ijraset
- On This Page
- Abstract
- Introduction
- Conclusion
- References
- Copyright
Predicting Multiple Cancer Using Advanced Machine Learning Technique
Authors: Tejas C. Janbandhu
DOI Link: https://doi.org/10.22214/ijraset.2024.64321
Certificate: View Certificate
Abstract
Cancer diagnosis systems are transformative platforms for web users, providing hassle-free techniques for identifying early-stage cancer cells. We have developed a web portal specifically designed for cancer identification and prediction, focusing on Breast Cancer, Brain Cancer, and Lung Cancer. Utilizing advanced machine learning techniques, particularly Deep Neural Networks, we aim to deliver accurate results. To deploy the application on the web, we incorporated technologies such as Flask and Gradio, while front-end development was achieved using PHP to create a high-quality website. This site includes a comprehensive cancer knowledge base, informative videos, and e-books for patients, along with a chat application for consultations with doctors. Our models have demonstrated impressive accuracy rates: 96% for breast cancer, 95% for brain cancer, and 97% for lung cancer. We are continually exploring future enhancements to improve accuracy, performance, and stability. This paper details the entire system, along with the research results and product outcomes.
Introduction
I. INTRODUCTION
Cancer is one of the most prevalent life-threatening illnesses globally. According to the World Health Organization (WHO), lung cancer is responsible for approximately 7.6 million deaths each year, with projections suggesting this figure could rise to nearly 17 million by 2030. In the United States, lung cancer remains the leading cause of cancer-related deaths. The American Cancer Society reported an estimated 1,660,290 new cancer cases in 2013, including 228,199 cases of lung cancer.
Among the total estimated cancer deaths of 580,350, lung cancer accounted for 159,480 fatalities. In Iraq, lung cancer is the second most common type, affecting 2,123 individuals across both genders, representing about 8.31% of total cancer cases in the country. This marks a slight increase from the previous year's ratio of 8.1%. Furthermore, lung cancer constitutes approximately 13.27% of all cancer cases, indicating its prevalence among males, with a rise from the recorded 12.7% in 2015.
On the other hand, breast cancer is the most common cancer among women globally, with nearly 1.7 million new cases diagnosed in 2012, accounting for about 25% of all female cancers. The Global Cancer Observatory, supported by the International Agency for Research on Cancer (IARC), reveals that incidence rates vary significantly worldwide, from 27 per 100,000 in Middle Africa and Eastern Asia to 92 per 100,000 in Northern America. Breast cancer is the fifth leading cause of cancer deaths among women, resulting in an estimated 522,000 deaths annually, which constitutes 6.4% of total cancer mortality.
In regions with lower development and income indices, breast cancer is the most frequent cause of cancer death, accounting for 14.3% of fatalities. In areas with higher indices, it follows lung cancer, making up 15.4% of deaths. A similar trend has been observed in Cameroon, where breast cancer is the leading cancer among women in Yaoundé, comprising 18.5% of all cancers and 32.5% of cancers in females. The IARC reported 2,625 new cases of breast cancer per 100,000 women in Cameroon in 2012.
II. PROBLEM IDENTIFICATION
Several studies have utilized artificial intelligence techniques for predicting various cancers. For instance, artificial neural networks have been employed for lung cancer detection, while support vector machines, K-nearest neighbors, genetic algorithms, and fuzzy techniques have also proven effective in this context. Convolutional neural networks (CNNs) are particularly useful for such applications.
AI's role extends beyond lung cancer diagnosis; it is applied across all fields of biomedical engineering, including breast cancer and brain cancer diagnosis, as well as the classification of diabetes. To effectively implement these machine learning techniques, it is essential to use appropriate data as input for the algorithms. Various diagnostic methods are available for lung cancer, particularly MRI, isotopes, X-rays, and CT scans. Among these, chest radiography and Computer Tomography (CT) are the most commonly used imaging modalities for identifying different lung diseases.
Numerous public databases support scientific research in this area, such as the ELCAP Public Lung Image Database, LIDC Database, and Data Science Bowl 2017. The aim of our study is to develop a computer-aided diagnosis (CAD) system that assists doctors in diagnosing lung cancer. This system will accurately detect and classify lung cancer cases as normal, benign, or malignant by applying convolutional neural network techniques to a dataset of lung cancer CT scans collected from Iraqi hospitals.
III. OBJECTIVES
A. Motivation
Recent reviews of breast cancer data indicate that poor overall survival rates among patients in Sub-Saharan Africa can be attributed to a lack of early detection programs and limited access to surgical care, which is the primary treatment modality for breast cancer in the region. A retrospective cohort study conducted in Yaounde, Cameroon, revealed a 5-year survival rate of only 30% and a 10-year survival rate of 13.2% for breast cancer patients treated between 1995 and 2007. In stark contrast, high-income countries report breast cancer survival rates exceeding 80%. This disparity underscores the essential role of early detection and access to surgical treatment in improving breast cancer outcomes and survival rates, as these factors are fundamental components of effective breast cancer control strategies. Early diagnosis is critical for reducing cancer-related mortality, especially in regions where radiation, hormonal therapies, and chemotherapy are not widely available. Effective early detection depends on raising breast awareness and encouraging the use of screening methods. Although mammography is the only screening modality proven to lower breast cancer mortality, it is often neither affordable nor feasible in many low- and middle-income countries.
B. Related Work
Several studies have been conducted in the field of breast cancer detection and prevention. Notably, the Panafrican Medical Journal provides valuable histo-epidemiological insights. In 2017, Y.S. Sun, Z. Zhao, and Z.N. Yang highlighted risk factors and preventive measures for breast cancer, which was the second leading cause of cancer deaths among women at that time. Additionally, Y. Zou and Z. Guo explored impedance techniques for breast cancer detection, focusing on both in vitro and in vivo measurements of human breast tissues. On November 4, 2020, Pacilé S., Lopez J., Chone P., Bertinotti T., Grouin J.M., and Fillard P. published a study evaluating the effectiveness of an artificial intelligence (AI)–based tool for enhancing the detection process in two-dimensional mammography. Various solutions have been proposed, ranging from cancer detection methods based on X-ray image analysis to advanced breast imaging techniques. Most of these approaches aim to distinguish between benign and malignant tumors, often assuming a cancer diagnosis without taking into account patients' medical histories, such as previous suspicions of cancer or family history of the disease.
C. Proposed Solution
To address this issue, we propose a web platform called “BBL Care,” designed to help doctors quickly identify patients with or at risk of cancer, considering their past medical histories. Mammography is effective in detecting suspicious breast lesions, while biopsies confirm the presence of cancer. For brain and lung cancer detection, CT scans play a crucial role. The process for breast cancer detection involves two steps, whereas brain cancer can be identified in a single stage by importing CT scan images for tumor analysis. Similarly, lung cancer detection is achieved in one stage by analyzing and classifying CT scan images.
IV. METHODOLOGY
To develop a reliable model for predicting the presence of breast cancer, we undertook several key stages:
- Identifying significant factors related to mammography data and mammography images.
- Sourcing datasets for mammography and biopsy ultrasound images.
- Creating and validating the predictive model.
- Developing an interface for both doctors and patients.
A. For Lung Cancer
To establish a reliable model for predicting lung cancer using CT scan images, we followed these key steps:
- Identifying significant factors influencing lung cancer prediction through CT scan images.
- Sourcing datasets specifically for CT scan images.
- Creating and validating the predictive model.
- Developing an interface for both doctors and patients.
B. For Brain Cancer (Tumor):
To develop a reliable model for predicting brain cancer using CT scan images, we undertook the following steps:
- Identifying key factors relevant to brain cancer prediction based on CT scan images.
- Sourcing datasets specifically related to CT scan images.
- Creating and validating the predictive model.
- Developing an interface for both doctors and patients.
In this phase, we aimed to identify all factors related to mammography and biopsy procedures. Our research, conducted through various medical websites and articles, indicated that the primary method used by radiologists to assess breast health is the examination of mammogram results. A mammogram utilizes an X-ray tube and a breast compression system, with the main goal of detecting suspicious lesions in the breast. This examination typically lasts about 20 minutes. During the mammography process, radiologists can analyze several attributes, and we have identified eight key attributes relevant to our searches:
- age : patient’s age in years at time of mammogram.
- density : patient’s BI-RADS breast density as recorded at time of mammogram.
1: Almost entirely fatty
2: Scattered fibro glandular densities
3: Heterogeneously dense
4: Extremely dense
- famhx : family history of breast cancer in a first degree relative.
- hrt : current use of hormone therapy at time of mammogram.
- prvmam : binary indicator of whether the woman had ever received a prior mammogram.
- biophx : binary indicator of whether the woman had ever received a prior breast biopsy.
- bmi : body mass index at time of mammogram.
- The doctor formulates their judgment based on these attributes. This judgment is referred to as "assessment," which is defined as follows:
- assess : Radiologist’s assessment based on the 1BI-RADS
- scale : used to define the abnormalities seen and to determine what should be done next, return to screening, close follow-up or biopsy[2].
0 : Needs additional imaging
1 : Negative
2 : Benign finding(s)
3 : Probably benign
4 : Suspicious abnormality
5 : Highly suggestive of malignancy
- It is this attribute that we like to predict. So,
- X = (age, density, famhx, hrt , prvmam, biophy, bmi)
- y = assess
- Biopsy consists of taking a sample of a lesion detected by palpation or mammography to be examined under a microscope.
- We take the X-ray images and make the mask to reveal distinctly the cancer cells.
- X = X-ray image
- y = corresponding Image mask
C. Dataset
1) Breast Cancer Prediction (Diagnosis) Dataset
After identifying the various features used to predict breast cancer, we sought data from mammograms and X-ray images of Cameroonian patients. To facilitate this, we submitted a request for data collection to the regional delegation of public health in the center. However, due to administrative delays, we have not yet received a response. Consequently, we based our study on a dataset provided by [3], which includes the previously identified 09 attributes along with 03 additional ones:
- A binary indicator indicating whether a comparison mammogram from a prior examination is available
- A binary indicator for cancer diagnosis within one year of the screening mammogram
- Cancer type: Ductal carcinoma in situ or invasive cancer
- For the biopsy data, we thank those who provided a relatively up-to-date dataset from February 2020, which contains images and corresponding masks of benign and malignant tumors.
2) Lung Cancer Prediction Dataset
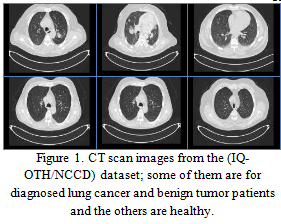
The lung cancer dataset from the Iraq-Oncology Teaching Hospital/National Center for Cancer Diseases (IQ-OTH/NCCD) was collected over three months in the fall of 2019. It includes CT scans of patients diagnosed with lung cancer at various stages, as well as scans from healthy individuals. Annotated by oncologists and radiologists at both centers, the dataset comprises a total of 1,190 images representing CT scan slices from 110 cases (see Figure 1). These cases are categorized into three classes: normal, benign, and malignant, with 40 cases diagnosed as malignant, 15 as benign, and 55 as normal.
The CT scans were originally captured in DICOM format, with each scan containing between 80 and 200 slices, each representing an image of the human chest from different angles. The dataset encompasses a diverse range of cases varying by gender, age, educational background, area of residence, and living status. Participants include employees from the Iraqi ministries of Transport and Oil, as well as farmers and laborers, predominantly from the central region of Iraq, particularly the provinces of Baghdad, Wasit, Diyala, Salahuddin, and Babylon. This dataset is available for access online on Kaggle.
3) Brain Cancer Prediction Dataset
In this study, we utilize two distinct datasets. The first dataset, referred to as Dataset 1, is a publicly available CE-MRI dataset sourced from General Hospital, Tianjin Medical University, and Nanfang Hospital in China, collected between 2005 and 2010. This dataset comprises 3,064 T1-weighted contrast MRI slices from 233 patients diagnosed with one of three types of brain tumors: meningioma, glioma, and pituitary tumors (as illustrated in Fig. 2). The MRI images in this dataset include three different views: axial, coronal, and sagittal.
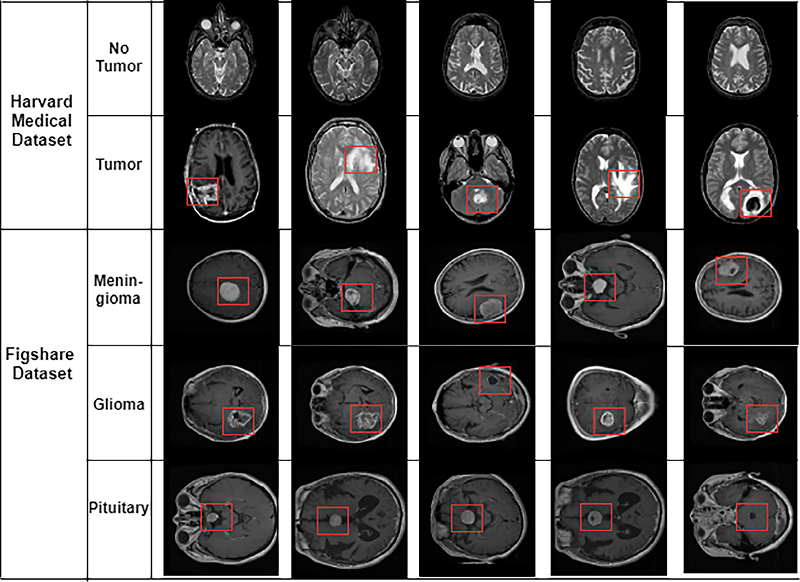
Figure 2. Different samples of brain tumors. Glioma, Metastatic adenocarcinoma, Metastatic bronchogenic carcinoma, Meningioma, and Sarcoma tumors from left to right in Harvard medical dataset. The tumor presents within the rectangle.
The second dataset, referred to as Dataset 2 in this article, was sourced from the Harvard repository. This dataset comprises a total of 152 T1 and T2-weighted contrast MRI slices. Among these, 71 slices are healthy images that do not show any tumors, while the remaining 81 images are classified as abnormal, containing various types of tumors. The abnormal brain slices feature five different tumor types: glioma, metastatic adenocarcinoma, metastatic bronchogenic carcinoma, meningioma, and sarcoma (as shown in Fig. 2).
D. Creation and Validation of a Model
1) Breast Cancer Prediction Model
a) Mammography Data Prediction
Since our goal is to support oncologists, we provide them with an evaluation of the likelihood that a patient falls into each category, represented as probabilities corresponding to each value of the "assess" attributes described earlier. To evaluate our models, we selected the Multiclass ROC AUC score. The ROC AUC score is scale-invariant, meaning it measures the quality of ranking predictions rather than their absolute values. We utilized the 'ovo' (One-vs-One) approach, which calculates the average AUC across all possible pairwise class combinations. Initially, we explored three approaches:
- SVM (Support Vector Machine): The goal of the Support Vector Machine (SVM) algorithm is to identify a hyperplane in an N-dimensional space (where N represents the number of features) that clearly separates the data points into distinct classes. There are multiple potential hyperplanes that can be selected to divide the two classes, but the objective is to find the one that maximizes the margin—the distance between the data points of both classes. By maximizing this margin, the model gains robustness, allowing future data points to be classified with greater confidence. In our case, we achieved an AUC score of 0.72.
- LGBM Classifier (Light Gradient Boost Model): We implemented a fast, distributed, high-performance gradient boosting framework based on the decision tree algorithm. However, the model performed worse than expected, achieving an AUC score of 0.69.
- Random Forest Classifier (with criterion=’gini’, Using the configuration of min_samples_split=2, n_estimators=1000, and other parameters set to their default values, the model's performance significantly improved, achieving an AUC score of 0.87.
b) Mammography Image Prediction
The objective of this task is to generate segmentation masks for cancerous tumors. We utilized the Keras U-Net architecture, which is widely used in computer vision for semantic segmentation. The goal of semantic segmentation is to classify every pixel in the image, determining whether it is part of the tumor or not. In Figure 3, we show the original image, while in Figure 4, we present both the mask provided in the dataset and the predicted mask generated by our model.
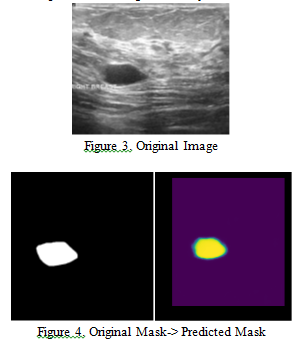

Figure 5. CNN Architecture for Breast Cancer
2) Lung Cancer Prediction Model
In the proposed approach, Convolutional Neural Networks (CNNs) are employed to detect and classify lung cancer from CT scans collected from hospitals. CNNs are a type of deep learning model specifically designed for processing grid-like data structures such as images, making them particularly well-suited for tasks involving computer vision. To better understand CNNs, one can think of a neural network architecture applied to visual tasks, such as image and video analysis. CNNs are widely used in various applications, including object recognition, facial recognition, and autonomous vehicles.
A Convolutional Neural Network (CNN) is a deep learning algorithm designed to process images by assigning weights and biases to various features, enabling it to differentiate between objects. One of the primary advantages of CNNs is their reduced need for pre-processing compared to other classification methods. The CNN simplifies images for easier processing while preserving crucial features required for accurate predictions. By effectively capturing spatial hierarchies in visual data, CNNs excel in tasks such as object recognition, image classification, and segmentation, making them essential in fields like computer vision and medical imaging.
A standard CNN architecture typically consists of three main types of layers: the convolutional layer (CONV), the pooling layer (POOL), and the fully connected classifier layer (FC), as illustrated in the figure below.
For the purpose of detecting breast cancer in ultrasound images we used in our study convolutional neural network:
V. EXPERIMENTS & RESULTS
We have achieved validation and results on all three models as follows:
A. Breast Cancer Prediction
The model achieved impressive performance, with a Training Accuracy of 96.78%, Validation Accuracy of 96.59%, and Testing Accuracy of 97.60%. For the customized model, the Training Loss was 0.00315, Validation Loss was 0.07326, and Testing Loss was 0.09518. In terms of computational time, the Xception model required 2944 seconds for training and 5.32 seconds for testing. Table II presents the precision, recall, and F1-score for each class in the dataset, with the model classifying eight types of tumors: benign adenosis (BA), benign fibroadenoma (BF), benign phyllodes tumor (BPT), benign tubular adenoma (BTA), malignant lobular carcinoma (MLC), malignant mucinous carcinoma (MMC), malignant papillary carcinoma (MPC), and malignant ductal carcinoma (MDC).
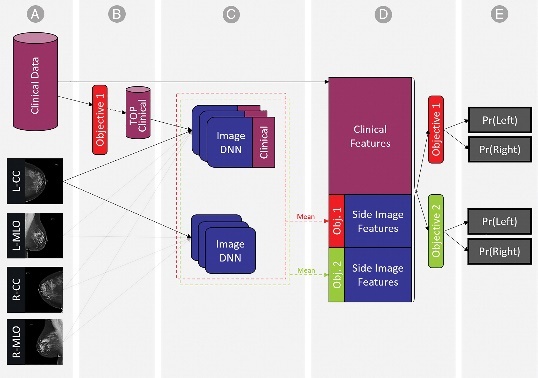
Figure 6. customized model for Breast Cancer
The customized model achieved an average Precision of 96.60%, Recall of 96.60%, and an F1-Score of 96.58%. Additionally, the ROC Curve metric for each class in the dataset reached 100%, as illustrated in Fig. 6. This indicates that the model performed exceptionally well in classifying the different categories, demonstrating high accuracy and reliability across all performance metrics.
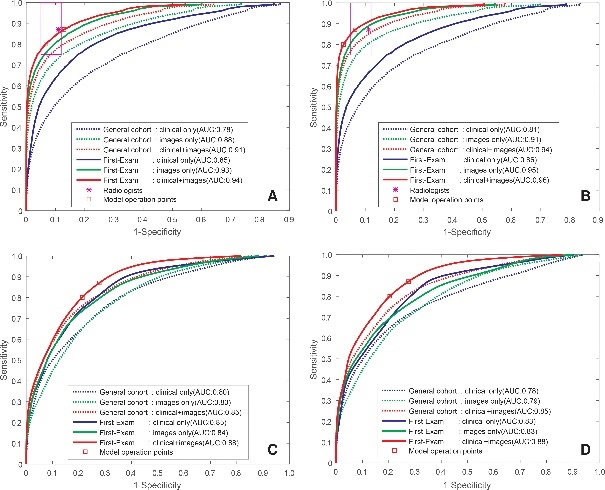
Figure 7. ROC Curve for Class in the Dataset
B. Lung Cancer Prediction
For detecting lung cancer in CT scans, we utilized the AlexNet convolutional neural network in our study, following these steps:
- The input image (Layer 0) has dimensions of 227 x 227 x 3, corresponding to height, width, and depth (color channels).
- In the first layer, a convolution operation is performed using 96 filters of size 11 x 11 with a stride of 4 and no padding (padding = 0). This results in an output image with dimensions of 55 x 55 x 96.
- The second layer applies a max-pooling operation with a 3 x 3 filter and a stride of 2. This reduces the size to 27 x 27, while maintaining the same depth of 96 as the pooling is applied independently on each layer.
- In Layer 3, a convolution operation with 256 filters of size 5 x 5, stride 1, and padding 2 restores the output size to 27 x 27, but increases the depth to 256.
- Max pooling is applied again in the next layer, with a 3 x 3 filter and a stride of 2, reducing the output to 13 x 13 x 256.
- Layer 5 involves another convolution operation, using 384 filters of size 3 x 3, with stride 1 and padding 1. The output remains 13 x 13, but the depth increases to 384.
- Another convolution operation, identical to the previous one, is applied in the next layer, keeping the output dimensions the same.
- In Layer 7, a convolution operation with 256 filters of size 3 x 3, stride 1, and padding 1 produces the same 13 x 13 size but with a depth of 256.
- Layer 8 applies max pooling with a 3 x 3 filter and a stride of 2, resulting in an output of 6 x 6 x 256.
- In Layer 9 (fully connected), the 6 x 6 x 256 output is flattened into 9216 pixels, which are fed into 4096 neurons of AlexNet.
- This process is repeated in the next fully connected layer.
- Finally, the last fully connected layer uses 1000 neurons for classification.
This architecture processes and classifies CT scan images efficiently, helping detect lung cancer.
In this study, an AI model was developed using a convolutional neural network based on the AlexNet architecture, implemented with MATLAB libraries to create the proposed model. The dataset comprised 110 CT scans of lung cancer cases, categorized into three classes: normal, benign, and malignant. During the training process, the dataset was split into two groups, with 70% allocated for training and 30% for testing. After completing the randomized training process, the model achieved an overall accuracy of 93.548% after 86 epochs out of the total 100 training epochs. The model's accuracy is illustrated in the following figure:
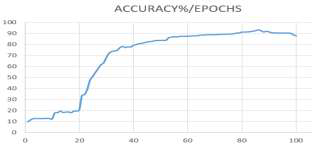
Figure 8. Accuracy of the training
The confusion matrix of the proposed model are as shown below:
Table 1- The confusion matrix
|
Confusion matrix |
Predicted class |
||
|
Non-malignant (positive) |
Malignant (negative) |
||
|
Actual class |
Non-malignant |
67 (TP) |
3(FN) |
|
Malignant |
2 (FP) |
38 (TN) |
|
The performance metrics of the proposed model, derived from the confusion matrix, include several key indicators:
- Sensitivity (Recall) measures the rate of true positives correctly identified by the test.
- Specificity indicates the rate of true negatives accurately classified by the test.
- Precision (or positive predictive value) represents the proportion of relevant cases among the total predicted cases.
- F-score combines both Precision and Recall to provide a single metric for model performance.
All these rates are calculated for all classes, as summarized in the table below:
Table 2: Performance metrics of the proposed model
|
Perform metrics |
Sensitivity |
Specificity |
Precision |
F1 Score |
|
values |
95.714% |
95% |
97.1015% |
96.403% |
C. Brain Cancer Prediction
The proposed models were implemented using TensorFlow and Keras in Python. The implementation took place on Google Colab, which offers free online cloud services for running machine learning projects.

Figure 9. Fine-tuned Proposed architecture with the attachment of ‘‘transfer learning based VGG16 architecture
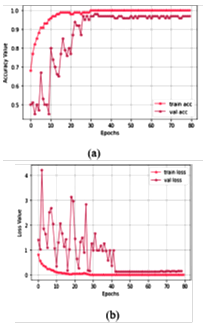
Figure 10. Training progress for study I: (a) accuracy value during training and validation process (preferred higher value), and (b) loss value during training and validation process (preferred lower value)
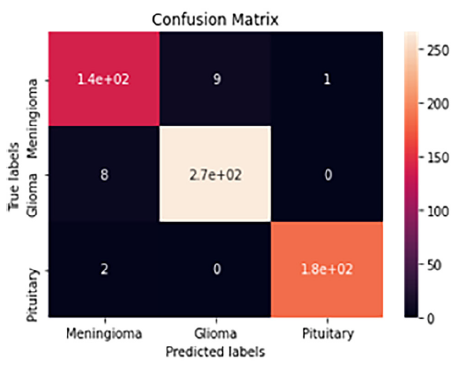
Figure 11. CNN model’s performance confusion matrix,
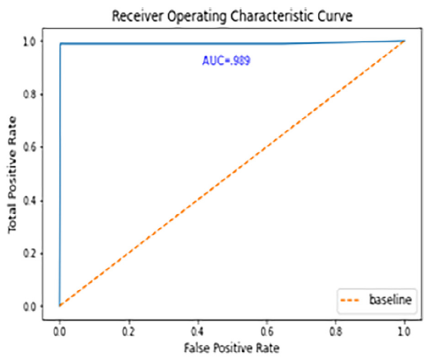
Figure 12. Performance ROC curve
The confusion matrix and ROC curve share dataset are shown in Fig. 12. A "23-layer CNN" architecture was employed for predictions. From the figure, it is evident that the model correctly classified 140 MRI slices for meningioma, 270 for glioma, and 180 for pituitary tumors, with only 20 slices misclassified. Performance metrics, including accuracy, precision, recall, false positive rate (FPR), true negative rate (TNR), and F1-score, are summarized in Table 6. The model achieved prediction accuracies of 96.7%, 97.2%, and 99.5% for meningioma, glioma, and pituitary tumors, respectively, resulting in an overall prediction accuracy of 97.8% for dataset. Additionally, the average precision was 96.5%, recall was 96.4%, and F1-score was 96.4%. The false-positive rate was approximately 0, while the true negative rate approached 1, indicating that the "23-layer CNN" architecture performs exceptionally well on this dataset. The ROC curve area value of 0.989 further confirms the model's consistency and generalizability.
D. Web Interface
We developed a web application using Flask to facilitate doctor interaction with our models. For the mammography module, doctors fill in the patient's information fields, which triggers a request to our system. In response, we provide the probabilities indicating the patient's likelihood of being in each of the six categories corresponding to the "assess" attributes. Figures 13 and 14 illustrate some of the interfaces designed for the mammography section of the application.

Figure 13. Mammography Data Home interface
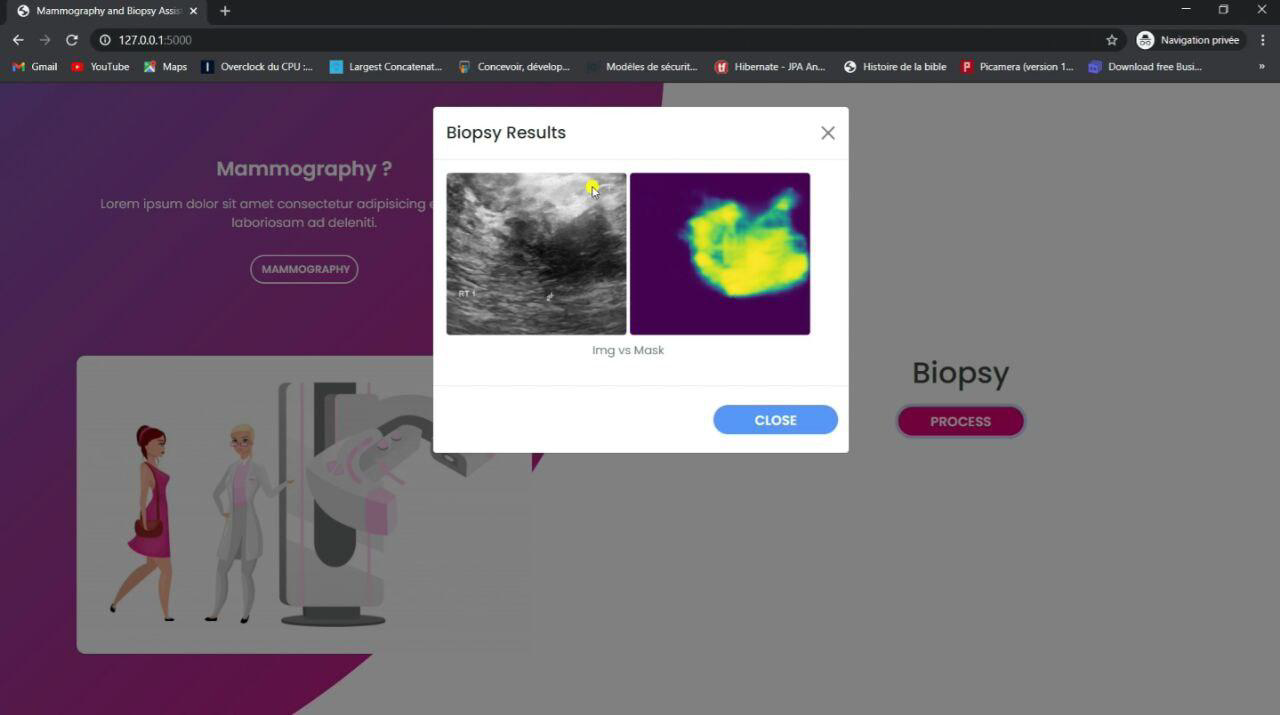 Figure 14. Mammography Image Results interface
Conclusion
In this study, a deep learning technique with kNN is used to predict lung cancer in CT scan images. The CT scan images were preprocessed using image augmentation technique. Then the augmented dataset is used in deep learning model (AlexNet) for training. And then features were extracted from the last layer of AlexNet and the extracted features from AlexNet was applied as input to kNN classifier. And then the 5-fold cross validation was also applied to the experiment to achieve generalized result. The model implemented on a publicly available SIPE-AAPM dataset consisting total 81 labeled chest CT images. The experiment achieved an accuracy of 90%, precision of 83%, recall of 100% and, f1 score of 90.9%. The limitation of this study, because of hardware lacking (graphics card) of our computer, we could not apply feature selection technique. The dataset used in this study was small, in future, we will work with a big dataset and an improved model. Also for cancer prediction The strategy of using pre-trained deep learning models has proved to be useful for such complicated tasks. On the other hand, in the research community Chen et al. got an 84% accuracy score combining CNN with SVM classifier, Monkam et al. reached accuracy of 88.28% pure CNN, Da Nóbrega et al. achieved accuracy of 88.41% with ResNet50 architecture, Wang et al. got scores 94.78% from pure CNN, from Da Silva et al. scored an accuracy of 97.62%. As it can be seen, the accuracy scores are very diverse in the sense of accuracy and even more diverse in the tools and techniques used to find nodules, extract features, and classify the cancer as benignant or malignant).
References
[1] Khaled H Fahmy A. Al-Dhabyani W Gomaa M. Dataset of breast ultrasound images. Data in Brief. 2020 Feb;28:104863. URL: DOI:10.1016/j.dib.2019.104863.. [2] Cancer.org. Understanding Your Mammogram Report. URL: https : / /www. cancer. org / cancer / breast - cancer / screening - tests - and - early - detection / mammograms / understanding-your-mammogram-report.html. [3] Data collection and sharing was supported by. the National Cancer Institute-funded Breast Cancer Surveillance Consortium (HHSN261201100031C). You can learn more about the BCSC at: URL: http://www.bcscresearch.org/ [4] IARC. Cancer Today. URL: https://gco.iarc.fr/today/. [5] Panafrican Medical Journal. Breast cancer in Cameroon, histo-epidemiological profile: about 3044 cases. URL: http://www.panafrican-med-journal.com/content/article/ 21/242/full [6] Chone P Bertinotti T Grouin JM Fillard P. Pacil`e S Lopez J. Improving breast cancer detection accuracy of mammography with the concurrent use of an artificial intelligence tool. https://doi.org/10.1148/ryai.2020190208 [7] Z. Guo Y. Zou. A review of electrical impedance techniques for breast cancerdetection. URL: doi : 10 . 1016 / S1350-4533(02)00194-7. [8] ZN Yang YS Sun Z Zhao. Risk Factors and Preventions of Breast Cancer. https://www.ncbi.nlm.nih.gov/pmc/articles/PMC5715522 [9] Welch HG, Schwartz LM, Woloshin S. Are increasing 5-year survival rates evidence of success against cancer Jama. 2000;283(22):2975 [10] Asuntha A, Srinivasan A. Deep learning for lung Cancer detection and classification. Multimedia Tools Applications. 2020:1-32. [11] Nie L, Zhang L, Yang Y, Wang M, Hong R, Chua T-S, editors. Beyond doctors: Future health prediction from multimedia and multimodal observations. Proceedings of the 23rd ACM international conference on Multimedia; 2015. American Lung Association [12] Siegel, Rebecca, Naishadham, Deepa, Jemal, Ahmedin. Cancer statistics, 2013. a cancer journal for clinicians. 2013;63(1):11-30. [13] Republic of Iraq, Ministry of Health\\Environment, Board. IC. Annual Report Iraqi Cancer Registry 2016 2016. [14] Republic of Iraq, Ministry of Health\\Environment, Board. IC. Annual Report Iraqi Cancer Registry 2015. 2015. [15] Nasser, Ibrahim M Abu-Naser, S. S. Lung Cancer Detection Using Artificial Neural Network. International Journal of Engineering Information Systems. 2019;3(3):17-23. [16] Taher, Fatma Sammouda, Rachid., editors. Lung cancer detection by using artificial neural network and fuzzy clustering methods. 2011 IEEE GCC Conference and Exhibition (GCC); 2011: IEEE. [17] Eskandarian P, Bagherzadeh J, editors. Computer-aided detection of Pulmonary Nodules based on SVM in thoracic CT images. 2015 7th Conference on Information and Knowledge Technology (IKT); 2015: IEEE. [18] Ganesan S, Subashini T, Jayalakshmi K, editors. Classification of X-rays using statistical moments and SVM. 2014 International Conference on Communication and Signal Processing; 2014: IEEE. [19] Parveen SS, Kavitha CJIJoCA. Classification of lung cancer nodules using SVM Kernels. 2014;95(25). [20] Thamilselvan P, Sathiaseelan J. Detection and classification of lung cancer MRI images by using enhanced k nearest neighbor algorithm. Indian Journal of Science Technology. 2016;9(43):1-7. [21] Kurkure M, Thakare A, editors. Lung cancer detection using genetic approach. 2016 International Conference on Computing Communication Control and automation (ICCUBEA); 2016: IEEE. [22] Behin A, Hoang-Xuan K, Carpentier AF, Delattre J-Y. Primary brain tumours in adults. Lancet 2003;361(9354):323–31. [23] Louis DN, Perry A, Reifenberger G, Von Deimling A, Figarella-Branger D, Cavenee WK, Ohgaki H, Wiestler OD, Kleihues P, Ellison DW. The 2016 world health organization classification of tumors of the central nervous system: a summary. Acta Neuropathol 2016;131(6):803–20. [24] Dasgupta A, Gupta T, Jalali R. Indian data on central nervous tumors: A summary of published work. South Asian J Cancer 2016;5(3):147. [25] C.R. UK, Published on may, 2019; 2019. URL: https://www.cancerresearchuk. org. [26] Hollon TC, Pandian B, Adapa AR, Urias E, Save AV, Khalsa SSS, Eichberg DG, D’Amico RS, Farooq ZU, Lewis S, et al. Near real-time intraoperative brain tumor diagnosis using stimulated raman histology and deep neural networks. Nat Med 2020;26(1):52–8. [27] Kasraeian S, Allison DC, Ahlmann ER, Fedenko AN, Menendez LR. A comparison of fine-needle aspiration, core biopsy, and surgical biopsy in the diagnosis of extremity soft tissue masses. Clin Orthopaedics Rel Res 2010;468 (11):2992–3002. [28] Hansson O, Lehmann S, Otto M, Zetterberg H, Lewczuk P. Advantages and disadvantages of the use of the csf amyloid b (ab) 42/40 ratio in the diagnosis of alzheimer’s disease. Alzheimer’s Res Ther 2019;11(1):34. [29] Mabray MC, Cha S. Advanced mr imaging techniques in daily practice. Neuroimaging Clin 2016;26(4):647–66. [30] Gudigar A, Raghavendra U, San T, Ciaccio E, Acharya U. Application of multiresolution analysis for automated detection of brain abnormality using mr images: A comparative study. Future Gener Comput Syst 2019;90:359–67. [31] Chen Y, Shao Y, Yan J, Yuan T-F, Qu Y, Lee E, Wang S. A feature-free 30-disease pathological brain detection system by linear regression classifier. CNS & Neurol Disorders-Drug Targets (Formerly Current Drug Targets-CNS & Neurological Disorders) 2017;16(1):5–10
Copyright
Copyright © 2024 Tejas C. Janbandhu. This is an open access article distributed under the Creative Commons Attribution License, which permits unrestricted use, distribution, and reproduction in any medium, provided the original work is properly cited.

Download Paper
Paper Id : IJRASET64321
Publish Date : 2024-09-24
ISSN : 2321-9653
Publisher Name : IJRASET
DOI Link : Click Here
 Submit Paper Online

