Ijraset Journal For Research in Applied Science and Engineering Technology
- Home / Ijraset
- On This Page
- Abstract
- Introduction
- Conclusion
- References
- Copyright
Prediction and Analysis of Liver Patient Data
Authors: Priyanka Singh, Pooja Singh, Dr. Sadhana Rana
DOI Link: https://doi.org/10.22214/ijraset.2024.62495
Certificate: View Certificate
Abstract
Prediction and Analysis of Liver Patient Data is a project that aims to gain insights into liver diseases and develop a system for predicting the likelihood of liver-related health conditions by using data analysis techniques and predictive modeling. This project examines data from liver patients, focusing on the relationships between a key list of liver enzymes, proteins, age, and gender in order to predict the likelihood of liver disease. In this case, we are constructing a model by employing various machine learning algorithms to find the most accurate model. And connect to a flask-based web application. The user can predict the disease by entering parameters into the web application. The project\'s goal is to uncover significant indicators and build a predictive model to aid in diagnosing liver diseases and identifying potential risks by exploring patterns and relationships within the data.
Introduction
I. INTRODUCTION
The project addresses the need for efficient and accurate liver disease diagnosis to improve early intervention and patient outcomes. If left untreated, hepatitis, cirrhosis, and fatty liver disease can cause serious health problems. This project uses predictive analytics on liver patient data to achieve these goals:
- Early Detection and Diagnosis: The project analyses liver disease factors and attributes to find patterns and indicators for early liver disease detection and diagnosis. Medical professionals could intervene earlier, preventing disease progression and improving treatment outcomes.
- Risk Assessment: The project will create a liver disease risk assessment model. The model can predict liver-related health issues based on age, gender, BMI, and alcohol consumption. This information can help with prevention, lifestyle advice, and patient education.
- Treatment Planning and Monitoring: The project analyses liver patient data to identify treatment effectiveness and patient response factors. Medical professionals can customize treatment plans and track patient progress by understanding the relationship between attributes and treatment outcomes.
- Insights and Knowledge Discovery: The project analyses a large liver patient dataset to discover new liver disease insights. This can help the medical community understand liver health risk factors, causes, and interventions, improving patient care and research
II. LITERATURE SURVEY
Liver diseases pose a significant health burden worldwide, and timely and accurate diagnosis is crucial for effective treatment and management. However, traditional diagnostic methods rely heavily on subjective observations, clinical assessments, and invasive procedures, which can be time-consuming, expensive, and prone to errors. Additionally, the increasing prevalence of liver diseases necessitates more efficient and automated approaches for early detection and prediction.
Existing Approaches or Methods to Solve the Problem: Several existing approaches and methods have been employed to address the challenges associated with liver disease prediction and analysis. These include:
- Statistical Analysis: Researchers have utilized statistical techniques to analyze liver patient data, identify risk factors, and establish correlations between various attributes and liver diseases. Methods such as logistic regression, decision trees, and random forests have been applied to develop predictive models.
- Machine Learning: Machine learning algorithms have been employed to predict liver diseases based on patient data. Techniques such as support vector machines (SVM), neural networks, and ensemble methods have shown promise in accurately classifying patients and predicting disease outcomes.
- Data Mining: Data mining techniques have been utilized to extract useful patterns and insights from large datasets of liver patient data. Association rule mining, clustering, and anomaly detection methods have been employed to uncover hidden relationships and identify subgroups of patients with specific characteristics.
- Decision Support Systems: Decision support systems have been developed to assist healthcare professionals in diagnosing and treating liver diseases. These systems integrate patient data, clinical guidelines, and predictive models to provide recommendations and assist in decision-making processes for liver disease prediction.
- Deep Neural Networks: Can analyze complex relationships within liver patient data and extract high-level representations for accurate predictions. Convolutional neural networks (CNNs) and recurrent neural networks (RNNs) have been employed to capture spatial and temporal dependencies within the data.
III. PROPOSED METHODOLOGY
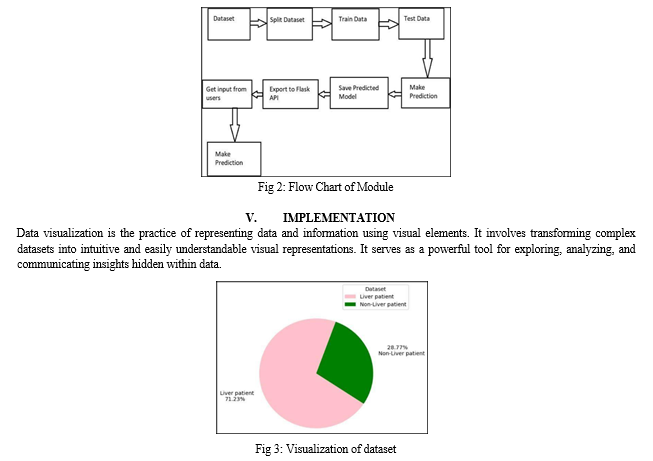
In this project, the proposed solution involves leveraging liver patient data to predict the likelihood of liver disease using machine learning techniques. The key steps of the proposed solution are as follows:
- Data Collection and Preprocessing: Gather a comprehensive dataset comprising liver patient records, including attributes such as liver enzymes, proteins, age, and gender. Ensure the data is properly cleaned, removing any inconsistencies or missing values.
- Feature Selection and Engineering: Identify the key features that contribute significantly to liver disease prediction. Conduct exploratory data analysis to understand the relationships between variables and select relevant features. Additionally, engineer new features if necessary to enhance the model's predictive power.
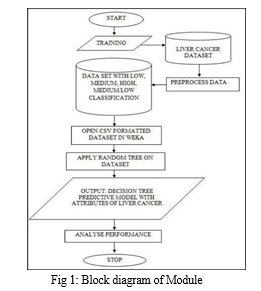
- Model Building: Apply various machine learning algorithms, such as decision trees, random forests, SVM, and logistic regression, to build predictive models. Train these models using the pre-processed data and evaluate their performance using appropriate metrics, such as accuracy, precision, recall, and F1 score. Select the best-performing model for further refinement. into the application, allowing users to input their parameters (e.g., liver enzymes, proteins, age, and gender) and obtain the predicted likelihood of liver
- Model Evaluation and Deployment: Assess the accuracy and robustness of the model using validation techniques such as cross-validation. Fine-tune the model if necessary and finalize it for deployment. Deploy the model and the web application to a suitable hosting environment, ensuring it can handle user requests efficiently and securely.
- Continuous Improvement: Monitor and update the predictive model periodically as new data becomes available. Continuously evaluate the model's performance and refine it based on feedback and emerging research findings to enhance its accuracy and predictive capabilities.
By implementing this proposed solution, users will be able to utilize the web application to predict the likelihood of liver disease based on their input parameters, contributing to early detection and intervention, and potentially improving patient outcomes.
IV. EXPERIMENT INVESTIGATION

- Data Preprocessing: The liver patient data is collected and pre-processed to ensure data quality and consistency. This includes handling missing values, outlier detection and treatment, and normalizing or scaling numerical features. Exploratory data analysis is performed to understand the distribution and characteristics of the data.
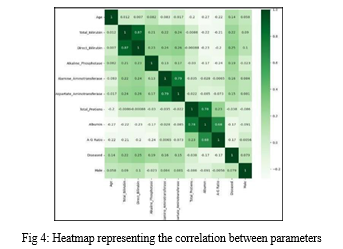
- Feature Selection: An investigation is conducted to identify the most relevant features for liver disease prediction. Correlation analysis and feature importance ranking techniques are applied to determine the key factors contributing to liver disease likelihood. This investigation helps in selecting a subset of informative features for model training.
- Model Selection and Comparison: Various machine learning algorithms, such as decision trees, random forests, logistic regression, and support vector machines, are investigated and compared for their performance in liver disease prediction. Different evaluation metrics, such as accuracy, precision, recall, and F1 score, are used to assess and compare the models' performance.
- Hyperparameter Tuning: The impact of different hyperparameters on model performance is investigated. Techniques like grid search or random search are used to find the optimal combination of hyperparameters for each model. The investigation helps in fine-tuning the models and improving their predictive accuracy.
- Web Application Testing: The Flask-based web application is tested to ensure its functionality, usability, and performance. User input parameters are provided, and the predictions generated by the models are compared against known outcomes to validate the accuracy of the web application.
- Error Analysis: Misclassifications or errors made by the predictive models are analyzed to understand the reasons behind them. This investigation helps identify areas for improvement such as handling class imbalance, addressing bias or overfitting issues, or incorporating additional features to reduce false positive or false negative.

By presenting data visually, patterns, trends, and relationships can be easily identified, enabling individuals and organizations to make informed decisions. Effective data visualization enhances data storytelling and enables audiences to grasp key messages and draw meaningful conclusions. It plays a crucial role in fields such as business, science, journalism, and public policy, allowing stakeholders to derive actionable insights and drive impactful outcomes from data.
Here are a few ways visualization can facilitate data-driven tasks:
- Facilitates Communication: Data science visualization provides a way to properly communicate the findings of data analysis to stakeholders.
- Enables Pattern Recognition: Visualization enables data scientists to identify patterns and trends in data that may be difficult to discern from raw data alone. For instance, consider a healthcare provider that wants to identify trends in patient data to improve patient outcomes. Through visualization techniques, it can easily see which factors are most strongly correlated with positive patient outcomes and which are not. This information, in turn, can be used to develop more effective treatment plans.
- Facilitates Data Exploration: Data science visualization allows us to explore data by interacting with it in real-time.
Enhances decision-making by delivering insights and enabling us to understand data better, data science and data visualization can help us make better decisions. plots, and heat maps, among others. Each type has its specific use case and can represent different types of data.
a. Scatter Plot: This is a data science chart that shows the relationship between two variables. Each point on the plot represents a pair of values for the two variables. It is useful for identifying patterns and trends in data.
b. Bar Chart: A bar chart is a plot that shows the frequency or proportion of categorical data. The x-axis represents the categories and the height of each bar represents the frequency or proportion of the category. It is useful for comparing the frequency or proportion of different categories.
c. Line Chart: This is a data science chart that shows the trend of a variable over time. The x-axis represents time and the y-axis represents the values of the variable. It is useful for showing how a variable changes over time.
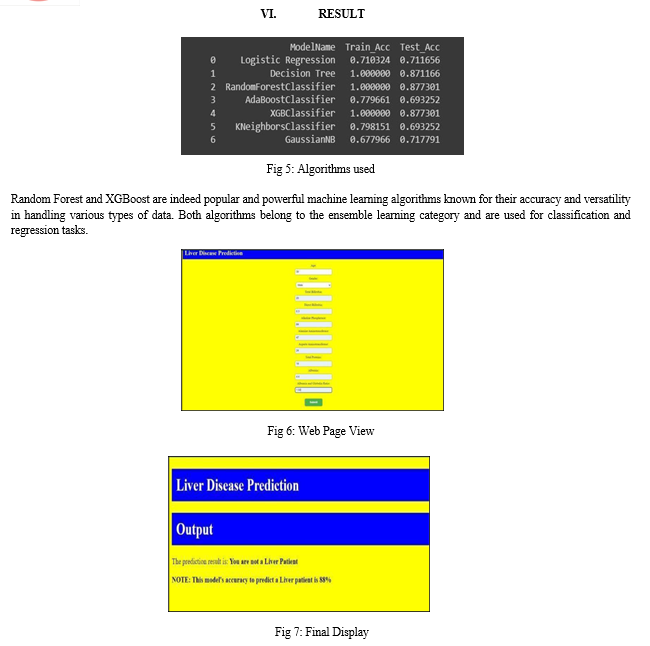
d. Heat Map: This is a plot that shows the values of a variable using color. The x-axis and y-axis represent two variables and the color of each cell in the plot represents the value of the variable.
e. Histogram: A histogram is a plot that shows the distribution of a variable. The x-axis represents the values, variable and the y-axis represents the frequency or proportion of each value. It is useful for identifying the range and shape of the distribution of a variable.

f. Box Plot: A box plot shows the distribution of a variable using quartiles. The box represents the middle 50% of the data, the whiskers represent the range of the data, and the dots represent outliers. It is useful for identifying the range and shape of the distribution of a variable, especially when there are many outliers

Conclusion
In conclusion, the project \"Prediction and Analysis of Liver Patient Data\" aims to leverage data analysis techniques and predictive modeling to detect and predict liver diseases accurately. The proposed solution, consisting of data analysis, machine learning modeling, and a Flask-based web application, offers several advantages, including early detection, accurate predictions, personalized treatment, and improved healthcare decision-making. By analyzing key factors and integrating a user-friendly interface, the solution can facilitate effective liver disease prediction and enhance patient outcomes.
References
[1] Chaudhary, N., Bansal, A., & Aggarwal, S. (2021). Prediction of Liver Disease Using Machine Learning Algorithms. International Journal of Advanced Science and Technology, 30(9), 7340-7352. [2] Ghosh, S., & Ghosh, K. (2018). A Comparative Study of Machine Learning. [3] Algorithms for Liver Disease Prediction. In 2018 3rd International Conference on Information Systems and Computer Networks (ISCON) (pp. 1-5). IEEE [4] Tayal, D., & Bansal, A. (2019). Liver Disease Prediction Using Machine Learning Techniques: A Review. International Journal of Emerging Technologies and Innovative Research, 6(1), 61-67. [5] Zia, A., Chandio, F. H., & Baloch, M. A. (2020). Comparative Study of Machine Learning Techniques for Liver Disease Prediction. In 2020 4th International Conference on Computer and Communication Systems (ICCCS) (pp. 8488). IEEE. [6] Ramteke, P., & Ghatol, A. (2019). Liver Disease Prediction Using Machine. [7] Learning Algorithms. In 2019 10th International Conference on Computing, Communication and Networking Technologies (ICCCNT) (pp. 1-6). IEEE. [8] Kumar, R., Kumar, A., & Singh, D. (2020). Predictive Analysis of Liver Disease Using Machine Learning Techniques. In 2020 International Conference on Emerging Trends in Smart Technologies (ICETST) (pp. 1-6). IEEE. [9] Dwivedi, R., & Dwivedi, S. (2020). Predictive Analysis of Liver Disease using Machine Learning Techniques. In International Conference on Computing, Power. [10] Jain, A., Kumar, A., & Kumar, V. (2020). Liver Disease Prediction using Machine Learning Techniques. In 2020 11th International Conference on Computing, Communication and Networking Technologies (ICCCNT) (pp. 1-6). IEEE. [11] Dwivedi, R., & Dwivedi, S. (2020). Machine Learning-based Analysis for Liver Disease Prediction. In 2020 International Conference on Smart Electronics and Communication (ICOSEC) (pp. 1-6). IEEE. [12] Rajaraman, S., Antony, V. D., & Veluchamy, M. S. (2020). Liver Disease Prediction using Machine Learning Techniques. 2020 International Conference on Communication and Processing (ICCSP) (pp. 1753-1758). IEEE.
Copyright
Copyright © 2024 Priyanka Singh, Pooja Singh, Dr. Sadhana Rana. This is an open access article distributed under the Creative Commons Attribution License, which permits unrestricted use, distribution, and reproduction in any medium, provided the original work is properly cited.

Download Paper
Paper Id : IJRASET62495
Publish Date : 2024-05-22
ISSN : 2321-9653
Publisher Name : IJRASET
DOI Link : Click Here
 Submit Paper Online

