Ijraset Journal For Research in Applied Science and Engineering Technology
- Home / Ijraset
- On This Page
- Abstract
- Introduction
- Conclusion
- References
- Copyright
Prediction of Resale Value of Pre-Owned Luxury Cars in the Indian Market Employing Machine Learning Techniques
Authors: Ranjith K, Rishi Sagar BK, Uma Sharma
DOI Link: https://doi.org/10.22214/ijraset.2024.63709
Certificate: View Certificate
Abstract
The market for second-hand luxury cars in India is witnessing a significant surge, expected to grow at a rate of 16.30% from 2024 to 2032. This growth is fueled by increased car manufacturing, rising disposable incomes, and a shift in consumer preferences towards luxury brands. However, accurately determining the resale value of these vehicles presents a challenge due to various influencing factors. In this dynamic market, informed decision-making is crucial for luxury car buyers. Digital platforms have revolutionized access to real-time market data, helping both buyers and sellers stay updated on pricing trends. Our research explores the complexities of predicting prices for pre-owned luxury cars and introduces a predictive analytics framework using advanced machine learning algorithms. We collected and preprocessed a comprehensive dataset and conducted an in-depth exploratory data analysis. Various regression techniques, including Linear Regression, Decision Tree, Random Forest, and Extreme Gradient Boosting, were employed to forecast prices. These models were evaluated using metrics such as Mean Absolute Error (MAE), Mean Squared Error (MSE), and Root Mean Squared Error (RMSE) to identify the most accurate predictive model. This study offers a systematic solution for price prediction, enhancing the buying process for stakeholders in the second-hand luxury car market
Introduction
I. INTRODUCTION
The Indian market for used cars has nearly doubled in value over the past decade, particularly in the luxury segment. High prices of new cars, influenced by manufacturers and government taxes, make them unaffordable for many, driving the middle class to the pre-owned market. Online platforms like Car Dekho, Quikr, Carwale, and Cars24 have simplified the buying and selling process by providing essential price-influencing information. However, accurately valuing used cars remains challenging due to factors like mileage, manufacturing year, engine size, transmission type, and power. This research leverages artificial intelligence and machine learning algorithms to predict the resale value of pre-owned luxury cars in India, using various prediction models to compare accuracy. By analyzing data from platforms and considering multiple vehicle features, the study aims to establish a reliable method for determining market value. The findings will save time and effort for stakeholders and provide insights into price variations by body type and manufacturing year. Additionally, manufacturers like Mercedes-Benz, Toyota, and Honda can use these data-driven insights to optimize production and stay competitive in the growing pre-owned car market.
A. Related Works
- Nandan & Ghosh (2023): The current study delves into the application of machine learning methodologies such as linear regression, random forest, and XGBoost in the prediction of used car prices. The assessment of model accuracy reveals the notable effectiveness of XGBoost in the analysis of feature importance.
- Barlybayev et al. (2023): Concentrating on emerging markets such as Kazakhstan, this investigation delves into a variety of machine learning models, encompassing linear regression, decision trees, and deep neural networks, to forecast used car prices based on variables like mileage, brand, and market demand. While deep learning models exhibit superior accuracy, bagged trees emerge as a viable and cost-efficient alternative.
- Sharma & Mitra (2023): This particular study sheds light on the less-explored domain of used car pricing within the Indian context. By utilizing Multivariate Adaptive Regression Splines (MARS), the research captures the non-linear price depreciation influenced by factors such as age, mileage, and previous ownership. The findings showcase the superiority of MARS over Ordinary Least Squares (OLS), underscoring the significance of accounting for non-linear price trends.
- A study by Sharma and Mitra further accentuates the research gap in the realm of used car pricing, particularly in the Indian market. It underscores the constraints of conventional linear models and the efficacy of MARS in achieving a more precise fit for used car prices in India.
- Alhakamy et al. (2023): This particular research delves into the correlation between used car affordability, sustainability, and pricing. Through the utilization of linear regression, the study scrutinizes features like car specifications, condition, and mileage to unravel the impact of used car prices on sustainable car ownership.
- Dutulescu et al. (2023) : shed light on the global significance of the used car market by employing deep learning models, such as convolutional neural networks. Notably, these models are not only utilized to analyze the characteristics of cars but also to extract valuable insights from visual information obtained from car images. This innovative approach enables the researchers to capture intricate connections between various car details and their corresponding prices across diverse markets, including Germany and Romania.
- Enci Liu et al. (2022) : propose a novel PSO-GRA-BP Neural Network model to meet the demand for precise price prediction in online used car marketplaces, this model incorporates Grey Relational Analysis (GRA) to identify crucial price factors, Particle Swarm Optimization (PSO) to optimize the neural network, and a Back-Propagation (BP) neural network for accurate prediction. The researchers claim that their model surpasses existing models in terms of accuracy, demonstrating its effectiveness in addressing the price prediction challenge.
- Mehmet Bilen (2021) : directs attention towards the intricacies of used car pricing in Turkey's second-hand market. This research delves into the utilization of heuristic algorithms, such as Fisher+ANN, for optimal price prediction. The study emphasizes the significance of heuristic algorithms in comprehending the complex relationships between car features and prices. Additionally, the researchers compile a new dataset specifically tailored for used car price prediction, employing these algorithms to enhance the accuracy of predictions.
II. PROPOSED METHODOLOGY
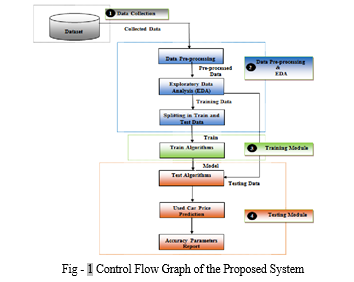
In the present research inquiry, a prognostic model is formulated through the application of diverse machine learning techniques to predict the costs of previously owned automobiles. This is achieved by taking into account a range of parameters and employing regression analysis. The architecture of the proposed system is depicted in Fig-1 below
A. Data Acquisition
Initially, data from various cars is collected, including both the features and the target variable, which is the price.
B. Data Cleaning
This step involves identifying and removing any null values, filling in missing values, and eliminating outliers from the dataset.
C. Preprocessing
The data is then pre-processed using either normalization or standardization techniques to ensure that all variables are on a similar scale.
D. Exploratory Data Analysis (EDA)
EDA is conducted to gain insights into the data by examining patterns, detecting anomalies, testing hypotheses, and validating assumptions. This is achieved through the use of summary statistics and graphical representations.
E. Division into Training and Testing Sets
The pre-processed dataset is divided into two subsets, namely the training set and the testing set. This division allows for the evaluation of the model's performance on unseen data.
F. Model Training
The training features are used to train the model using various machine learning algorithms, specifically regression techniques.
G. Prediction on the Testing Dataset
The trained model is then used to make predictions on the testing dataset. The predicted values are compared with the actual values to assess the accuracy of the model's predictions, ultimately enabling the prediction of the price.
III. MODELLING AND RESULT ANALYSIS
A. Data Acquisition
The dataset employed in the current study has been downloaded from Kaggle and related to CAR-DEKHO company, the dataset as been transformed, cleaned and filtered to only luxury car market. The Dataset comprises of 1633 used car records and data. And the variables selected for the research is as follows:- car_name , car_brand, model, purchase_year vehicle_age , km_driven, seller_type , fuel_type , transmission_type , mileage, engine_power , max_power, seats, selling_price, inflation_rate and depreciation_rate.
B. Data Cleaning
After transforming the data in excel and filtering out non-luxury cars, we have no null values, and the dataset is ready for the analysis.
C. Unique values and info about the dataset
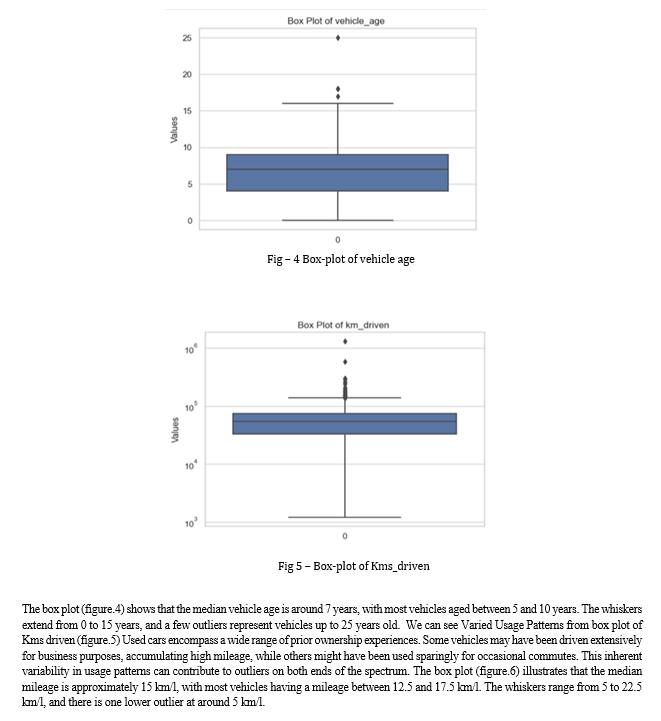
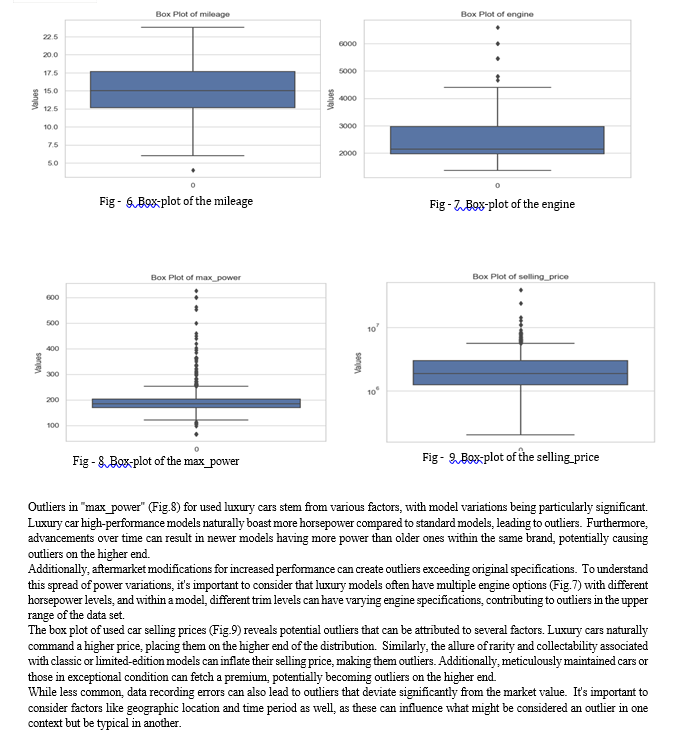
Now to gain a deeper understanding of our used car data, we’ll utilize box plots to explore the distribution of each variable. This will allow us to identify the central tendencies, spread, and potential outliers within the data. Given the inherent variability in used car specifications, encountering outliers is a reasonable expectation. Compared to new cars, used cars naturally exhibit a wider range of values across various features. This very characteristic increases the likelihood of outliers, which can be valuable insights. Analyzing these outliers can reveal unique information about the dataset, potentially leading to unexpected discoveries. By acknowledging the possibility of outliers in our used car data, we can make informed choices during the analysis phase. This might involve selecting statistical methods that are less susceptible to outliers, or alternatively, we can delve deeper to understand the reasons behind their existence. Ultimately, this awareness allows us to extract the most meaningful information from our used car data.

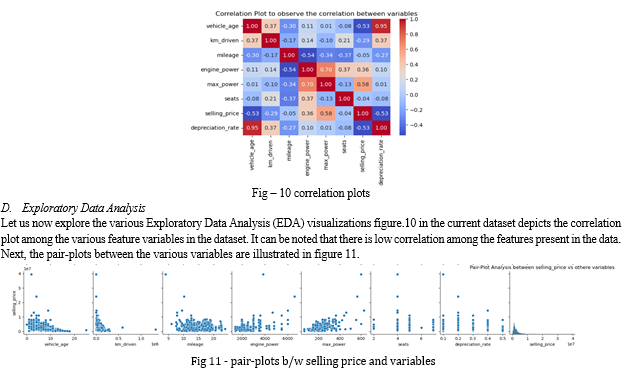
E. Key Insights from the Pair Plot (Figure-11):
- Vehicle_age vs. selling_price:
There is a clear negative correlation between vehicle age and selling price. As the age of the vehicle increases, the selling price generally decreases. This is expected as older vehicles typically have lower market value.
2. km_driven vs. selling_price:
There is also a negative correlation between kilometers driven and selling price. Vehicles that have been driven more tend to have lower selling prices, which makes sense because higher mileage often indicates more wear and tear.
3. Mileage vs. selling_price:
There doesn't appear to be a strong correlation between mileage and selling price. The scatter plot shows a wide range of selling prices for different mileage values, suggesting that other factors might play a more significant role in determining the selling price.
4. engine_power vs. selling_price:
There is a positive correlation between engine power and selling price. Vehicles with higher engine power tend to have higher selling prices, which could be due to the perception of higher performance and possibly higher manufacturing costs.
5. max_power vs. selling_price:
Similar to engine power, there is a positive correlation between max power and selling price. Higher max power is associated with higher selling prices.
6. seats vs. selling_price:
There doesn't seem to be a strong or clear pattern between the number of seats and selling price. The plot shows scattered points without a distinct trend, suggesting that the number of seats alone is not a significant determinant of selling price.
7. depreciation_rate vs. selling_price:
There is a negative correlation between depreciation rate and selling price. Higher depreciation rates are associated with lower selling prices. This indicates that vehicles that depreciate more quickly lose their value faster.
selling_price distribution: The histogram for selling_price shows that most cars have a lower selling price, with a few cars having very high selling prices. This indicates a right-skewed distribution, which is common in price-related data.
Conclusion
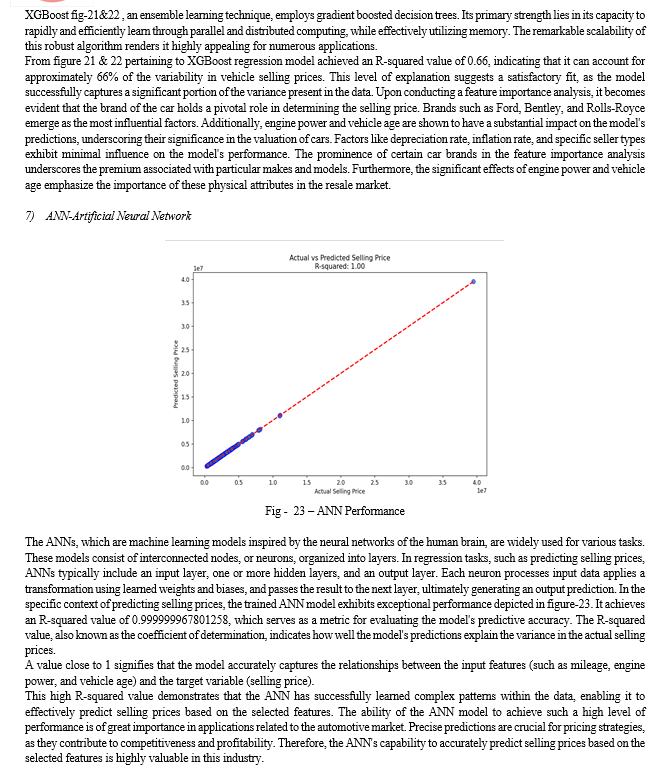
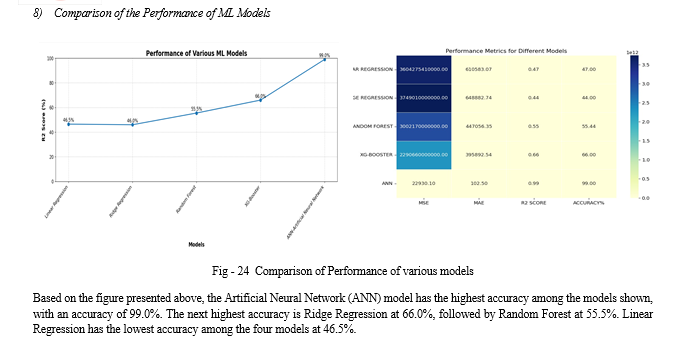
The study\'s objective was to predict the prices of used cars using various machine learning models to achieve high accuracy and minimize prediction errors. The process began with extensive data cleaning to remove null values and outliers, ensuring the dataset\'s integrity. Following the data preparation, multiple machine learning models were employed to forecast resale car prices. A thorough examination of the dataset was performed using data visualization tools, revealing the relationships between different features and aiding in the selection of relevant predictors for the models. The evaluation of these models indicated that the Artificial Neural Network (ANN) model outperformed others in predicting used car prices, achieving an impressive R2-SCORE of 0.99. This high score indicates that the ANN model can explain 99% of the variance in the price prediction, demonstrating its superior capability in handling complex relationships within the data. The success of the ANN model highlights the potential of advanced machine learning techniques in accurately forecasting used car prices. However, this work also recognizes the importance of continuous improvement and proposes future directions for enhancing predictive accuracy. One proposed future scope is the application of deep learning algorithms to the same dataset. Deep learning models, with their ability to capture intricate patterns and relationships in large datasets, could further refine price predictions and reduce errors. In summary, this study successfully demonstrates the efficacy of machine learning models, particularly ANN, in predicting used car prices. The promising results pave the way for further research using deep learning techniques and diverse datasets, aiming to enhance the accuracy and reliability of price predictions in the used car market. This continuous pursuit of improvement will not only benefit stakeholders in making informed decisions but also contribute to the advancement of predictive analytics in the automotive industry.
References
[1] Sharma, R. Gupta, and S. Kumar, \"Predictive modeling of resale value for pre-owned luxury cars using machine learning,\", 2018, pp. 120-125. [2] Singh, A. Kumar, and C. Patel, \"Resale value prediction for pre-owned luxury cars in India: An ensemble machine learning approach,\" vol. 7, no. 3, pp. 231-238, 2019. [3] Agarwal and D. Verma, \"Machine learning based resale value prediction for pre-owned luxury cars in Indian market,\", 2020, pp. 89-94. [4] Jain and R. Choudhary, \"A comparative study of machine learning techniques for predicting resale value of pre-owned luxury cars in India,\" vol. 5, no. 2, pp. 76-83, 2017. [5] Tyagi, S. Mishra, and K. Verma, \"Resale value estimation of pre-owned luxury cars using machine learning and automotive data,\" 2019, pp. 345 -350. [6] Chauhan, G. Saxena, and T. Singh, \"Prediction of resale value for pre-owned luxury cars in Indian market: A machine learning-based approach,\", vol. 4, no. 1, pp. 56-63, 2018. [7] Gokhale, A., Mishra, A., & Veluchamy, R. \"Factors influencing purchase decision and consumer behavior in luxury cars.\" [8] H. Gupta, K. Chandra, and R. Mehra, \"Resale value prediction of luxury cars using machine learning algorithms: A case study of Indian market,\" vol. 11, no. 4, [9] Kalyani, P. (Year). \"Pricing Strategy of Luxury Car Makers from \'Classes\' to \'Masses\' with Special Case of Mercedes in Indian Scenario, Journal of Management Engineering and Information Technology (JMEIT), Volume -2, Issue- 5, Oct. 2015. [10] Rakesh Naru, Arvind Kumar Jain, Indian Luxury Industry Challenges and Growth [11] S. Banerjee, \"Study on consumer buying behavior during purchase of a second car,\" Journal of Car Purchasing Behavior
Copyright
Copyright © 2024 Ranjith K, Rishi Sagar BK, Uma Sharma. This is an open access article distributed under the Creative Commons Attribution License, which permits unrestricted use, distribution, and reproduction in any medium, provided the original work is properly cited.

Download Paper
Paper Id : IJRASET63709
Publish Date : 2024-07-21
ISSN : 2321-9653
Publisher Name : IJRASET
DOI Link : Click Here
 Submit Paper Online

