Ijraset Journal For Research in Applied Science and Engineering Technology
- Home / Ijraset
- On This Page
- Abstract
- Introduction
- Conclusion
- References
- Copyright
Predictive Modellig of Dementia Using Machine Learning
Authors: Ab Rashid Wani, Dr. Gurinder Kaur Sodhi
DOI Link: https://doi.org/10.22214/ijraset.2024.64237
Certificate: View Certificate
Abstract
In an era marked by relentless technological advancement and a burgeoning aging population, dementia has appeared as a significant societal challenge. The relentless cognitive decline it brings not only takes a toll on individuals and their families but also poses a formidable challenge to healthcare systems worldwide. Previous research in this domain has encountered significant challenges in accurately predicting and mitigating dementia\'s progression. This proposed work seeks to address these challenges by leveraging cutting-edge machine learning methodologies, presenting a clear path towards more effective prediction and potential mitigation of dementia. Our research constitutes a pioneering investigation into the use of cutting-edge machine learning methods in the intricate field of medicine data sources, including neuroimaging, genetics, and clinical records. Previous researchers have grappled with the complex character of these data sources, struggling to unveil mild designs and insights that often remain concealed from the naked eye. Our approach aims to overcome these challenges by utilizing a well-defined machine learning algorithm, specifically a deep neural network, with carefully selected hyperparameters. The deep neural network is chosen for its ability to handle complex, high-dimensional data and uncover hidden patterns. Through the scrupulous curation and rigorous analysis of extensive datasets, our proposed work represents a significant step forward within the domain of studies on dementia. Our goal is to identify even the smallest changes in the form and function of the brain and to provide insight into the intricate genetic factors contributing to this enigmatic condition. Our algorithm\'s parameters are carefully tuned to ensure optimal performance, with an emphasis on sensitivity and specificity, crucial in dementia diagnosis and prediction.
Introduction
I. INTRODUCTION
In an era marked by relentless technological advancement and a growing older population, dementia has emerged as known as a significant societal challenge, casting a long shadow over individuals, families, and healthcare systems worldwide. Dementia, a collective term for cognitive deficits that cause problems in day-to-day activities and living are typified by a relentless decline in cognitive function, often including memory loss, impaired reasoning, and the inability to communicate effectively. This multifaceted and debilitating condition not only exacts a heavy toll on those who are immediately impacted, but also poses a formidable challenge to healthcare systems and societies at large.. This elusive target is further complicated by the diverse and often subtle ways in which dementia manifests itself in different individuals, making early diagnosis and intervention a formidable task.
This proposed work seeks to address these formidable challenges by harnessing the strength of cutting-edge machine learning methodologies, offering a ray of hope for more effective prediction and potential mitigation of dementia. As technology continues to advance at an unprecedented pace, we are presented with an opportunity to transform the landscape of dementia research and care. By capitalizing on the vast potential of machine learning, we aim to welcome a new age. of insight and understanding, clearing the path for improved outcomes and more informed decision-making.
Our research represents a pioneering investigation into the use of cutting-edge machine learning techniques for the complex and multifaceted landscape of medical data sources. These sources encompass a rich array of information, including neuroimaging data, genetic profiles, and clinical records. Previous researchers have grappled with the intricate nature of these data sources, struggling to unveil subtle patterns and insights that often remain concealed from the naked eye. Our approach is made to overcome these obstacles by deploying a well-defined machine learning algorithm, specifically a deep neural network, with carefully selected hyperparameters. The a deep neural network is selected because of its exceptional capacity to handle complex, high-dimensional data and uncover hidden patterns, even when they exist beneath layers of noise and variability.
Through the scrupulous curation and rigorous analysis of extensive datasets, our proposed work represents a significant leap forward within the dementia profession research.
Not only do we seek to discern the subtlest deviations in the anatomy and operation of the brain, illuminating the complex genetic factors contributing to this enigmatic condition, but we also make an effort to increase the precision and dependability of dementia prediction. Our algorithm's parameters are meticulously tuned to ensure optimal performance, with a particular emphasis on sensitivity and specificity, which are paramount in dementia diagnosis and prediction.
While we aspire to build on the limitations faced by previous researchers, we are acutely aware that as we venture deeper into predictive modeling, the ethical dimension takes on increasing significance. The handling of sensitive medical data carries a profound responsibility, and our work is committed to addressing ethical considerations with the utmost diligence. We emphasize principles of privacy, transparency, and equitable access to make certain that the benefits of our research extend to all individuals and do not compromise the rights and well-being of those whose data contribute to our knowledge.
In summary, our proposed work represents a novel and data-driven approach to overcoming the formidable obstacles that previous researchers, offering promising avenues for improving dementia prediction and care. By using the capacity of machine learning, we aim to shine a brighter shedding insight on the complex aspects of dementia, eventually enhancing the lives of individuals afflicted with this illness and providing a ray of hope for a future in which the effects of dementia are lessened via more precise diagnostics and focused treatment interventions.
II. LITERATURE REIVIES
Popuri et al. [8] provided a methodology for calculating the FDG-PET DAT score (FPDS), a 0–1 number used to detect Alzheimer-type cognitive impairment. (DAT). For the purpose of illness prediction, a new hybrid model has been created that combines the algorithm for cuckoo searching and the dependent shared data maximization method. The particle swarm optimization strategy allows for the greatest amount of tolerance towards error and uncertainty. ANN controller for a four-area linked power system's load control of frequency. The optimum control theory was used in the design of that controller to overcome the load frequency control problem. The training function is a multi-layer feed-forward neural network, with a backpropagation training function based on Bayesian registration.
A machine learning-based approach for detecting AD and tracking related disorders was presented by Raza et al. [19]. According to the literary works, several machine learning techniques are used to the disease's categorization and prediction, but little progress has been made in terms of performance enhancement. Thus, the machine learning model has been used to forecast Alzheimer's illness, and the cuckoo algorithm has been used to enhance the model's efficacy..
III. OBJECTIVES
- Develop and validate diagnostic instruments as well as biomarkers, employing the DenseNet-201 algorithm and other deep learning models, to achieve early and precise detection of dementia.
- Investigate therapeutic interventions utilizing Language is natural. interpretation and neural networks, such DenseNet-201, to improve dementia patients' overall quality of life and more effectively manage its affects dementia.
- Promote interdisciplinary collaboration that leverages data-driven approaches, with a certain emphasis on employing DenseNet-201, for comprehensive dementia care.
- Generate evidence-based policy recommendations by applying analytics techniques like regression analysis and decision trees in conjunction with DenseNet-201, to advance research and care efforts for dementia
IV. METHODOLOGY
A. Data Acquisition and Storage
1) Data Acquisition
The process of gathering information for this study project was a meticulously planned and executed endeavor. It involved several stages to ensure the collection of high-quality data for the studies into dementia. Here's a closer look at the information acquisition process:

Figure 1 Data Acquisition and storage.
2) Data Storage
The storage of acquired data was a critical a component of this study project, and it was managed with a focus on security, accessibility, and long-term preservation:
3) Feature Selection:
Feature selection is a critical step to identify the most relevant variables or attributes for the analysis. In this research project, The subsequent methods were utilized for feature selection:
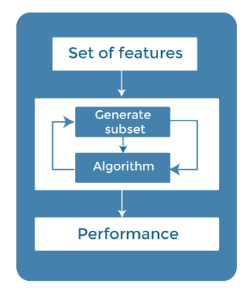
Figure 2 Feature selection
Correlation Analysis: The ratios of pairwise connection were calculated. to identify highly correlated features. Redundant features were removed to simplify the dataset and improve the interpretability of the models.
B. Machine Learning Algorithms Selection
When selecting the right algorithms, a number of aspects were taken into account, such as the type of data, the goals of the study, and the requirement for interpretability. Here are The robotic learning methods chosen for various tasks:
1) Logistic Regression:
Since logistic regression is a fundamental and popular approach for binary classification problems, it's a great option for differentiating between dementia and non-dementia cases. It operates on the principle of modeling the probability of a binary outcome by applying a logistic function to a linear combination of predictor variables. In the context of dementia diagnosis, Among these predictive factors are various clinical and demographic features, cognitive test scores, and biomarker measurements.
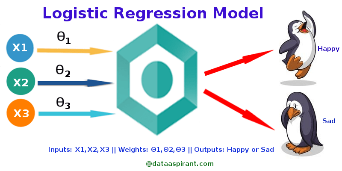
Figure 3. logistic regression
2) Random Forest
Strong ensemble learning method Random Forest is appropriate for both activities including regression and categorization. It is very good at managing extremely complex data and capturing complex relationships in the data, which is especially valuable in the context of dementia research where numerous variables might affect the disease's progression and severity..
3) Support Vector Machines (SVM)
Encouragement Strong algorithms that work well for challenges in classification include vector machines, especially when working with information that is not linear SVMs optimize the feature domain by locating the ideal plane that optimally divides two classes in the gap around them. Using SVMs, one may ascertain which choice to draw line, in the situation of dementia diagnosis, successfully distinguishes people with dementia from non-dementia cases dependent on the selected features.
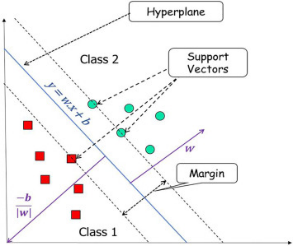
Figure 4 SVM
SVMs offer flexibility through the use of different kernel functions, such as linear, polynomial, or seeds of the radial basis function (RBF). This flexibility allows them to capture complex relationships in the data. SVMs are also known for their ability to handle high-dimensional data, which qualifies them for assignments requiring a lot of variables.
4) Neural Networks
Neural networks—deep neural networks in specifically— have gained popularity in recent times for their astounding capacity to seize intricate patterns in complex data. In the context of dementia research, deep neural networks, the task of such as repeated along with convolutional neural networks (CNNs) (RNNs), is applicable to various data types.
5) K-Nearest Neighbors (K-NN)
K-Nearest Neighbors is a straight forward yet effective algorithm for similarity-based tasks. It classifies or predicts according to the dominant class among its k-nearest neighbors inside the component area. In dementia research, K-NN may be used to determine cases with similar clinical profiles or feature patterns.
K-NN is intuitive to comprehend and put into practice. It doesn't make strong presumptions regarding the underlying data distribution, which is beneficial when working with diverse sources of info. But how well it works may be greatly impacted by the distance measurement and the value assigned to 'k'.
V. EXPERIMENTAL SETUP
The predictive modeling system for dementia was designed and implemented as a comprehensive solution for the prompt identification and prognosis of dementia. Multiple data sources were utilized, including neuroimaging data such as MRI and PET scans, genetic information, and clinical records. These diverse data inputs were subjected to a meticulous data preprocessing phase, which encompassed data cleaning, feature extraction, and selection, as well as data integration to ensure data quality and consistency.
A range of neural network models were considered, including Support Vector Machines (SVM), Random Forests, and Deep Neural Networks, with a rigorous model selection process. The models were trained and validated using distinct datasets, which included training, validation, and test data. The primary objective was to ascertain the most suitable model for accurately predicting dementia onset and progression.
The culmination of this extensive research effort resulted in valuable findings and recommendations for early dementia detection and prognosis. Documentation and reporting were crucial elements of the project, facilitating the dissemination of research findings and insights.
Furthermore, the application and deployment of the predictive modeling system in clinical settings marked a critical milestone in the fight against dementia. Continuous monitoring and improvement strategies were also established to ensure that the system remains up-to-date and effective in real-world scenarios, contributing significantly to the early detection and management of dementia.
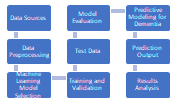
Figure 5 Flow diagram of the system
A. Data Collection and Preprocessing
1) Data collection
The process for collecting information for this research project was a meticulous and multi-faceted endeavor aimed at acquiring high-quality neuroimaging and clinical data for the investigation of dementia. It involved several key steps and considerations:
Participant Recruitment: A crucial initial step was the recruitment of participants. To guarantee the dataset's diversity and inclusivity, a concerted effort was created to enroll people with a range of experiences namely different age groups, genders, and ethnicities. Participants were often sourced from memory clinics, hospitals, and research institutions specializing in dementia care.
Informed Consent: Over the whole process of gathering data, ethical issues were crucial. All participants or their official representatives provided informed permission, stressing the value of openness and respect for people's individuality. The goals, methods, and any dangers of the study were fully disclosed to the subjects., as they had the chance to inquire and make knowledgeable judgments regarding their participation.
2) Data Preprocessing
Once the data was collected, a rigorous preprocessing pipeline was implemented to ensure data quality and consistency:
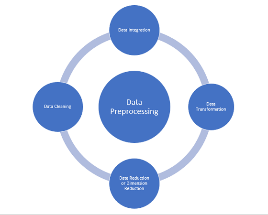
Figure 6 Data preprocessing
B. Model Training and Validation
The model training and validation phase was a pivotal component in the evolution of models for computational learning for dementia diagnosis and prognosis. This phase was distinguished by a series of carefully orchestrated steps aimed at crafting models that could effectively predict and assess dementia-related conditions.
Ultimately, the test set assumed the role of the arbiter, offering an unbiased evaluation of the model's real-world capabilities. This was the crucible where the model's mettle was truly tested. A successful model not only performed well on training and validation the information, but it also showed that it could generalize effectively to new, unseen data.
Model interpretability was an indispensable aspect of comprehending the inner workings of these machine learning models. Techniques like SHAP (SHapley Additive exPlanations) values and examination of its significance illuminated the factors and features that bore the most significance in the model's predictions. Such insights were invaluable in unraveling the diagnostic and prognostic determinants of dementia.
Lastly, once a model had proven its mettle, it could be deployed in clinical or research settings, where it served as a useful instrument in aiding healthcare professionals and researchers in diagnosing and assessing dementia-related conditions. However, this deployment process had to be conducted with scrupulous attention to regulatory and ethical standards, especially in light of healthcare applications. In sum, model training and validation were intricate processes, comprising numerous interdependent stages aimed at the creation of dependable and accurate machine learning algorithms have an opportunity to completely transform the early diagnosis and prognosis of dementia, thereby elevating patient care and outcomes to new heights.
VI. RESULTS AND DISCUSSION
A. Load Dataset
We created a Pandas Data Frame by loading in a spreadsheet that stores CSV facts named 'dementia_dataset.csv.'
The dataset was summarized, and it was discovered to have 15 columns and 373 rows.
The first 10 rows of the dataset were displayed.
Table . 1 Grouping Dataset with dimensions
|
Subject ID |
MRI ID |
Group |
Visit |
MR Delay |
M/F |
Hand |
Age |
EDUC |
SES |
MMSE |
CDR |
eTIV |
nWBV |
ASF |
|
|
0 |
OAS2_0001 |
OAS2_0001_MR1 |
Nondemented |
1 |
0 |
M |
R |
87 |
14 |
2.0 |
27.0 |
0.0 |
1987 |
0.696 |
0.883 |
|
1 |
OAS2_0001 |
OAS2_0001_MR2 |
Nondemented |
2 |
457 |
M |
R |
88 |
14 |
2.0 |
30.0 |
0.0 |
2004 |
0.681 |
0.876 |
|
2 |
OAS2_0002 |
OAS2_0002_MR1 |
Demented |
1 |
0 |
M |
R |
75 |
12 |
NaN |
23.0 |
0.5 |
1678 |
0.736 |
1.046 |
|
3 |
OAS2_0002 |
OAS2_0002_MR2 |
Demented |
2 |
560 |
M |
R |
76 |
12 |
NaN |
28.0 |
0.5 |
1738 |
0.713 |
1.010 |
|
4 |
OAS2_0002 |
OAS2_0002_MR3 |
Demented |
3 |
1895 |
M |
R |
80 |
12 |
NaN |
22.0 |
0.5 |
1698 |
0.701 |
1.034 |
|
5 |
OAS2_0004 |
OAS2_0004_MR1 |
Nondemented |
1 |
0 |
F |
R |
88 |
18 |
3.0 |
28.0 |
0.0 |
1215 |
0.710 |
1.444 |
B. Descriptive Statistics
1) Statistical Summary
Numerical values were described using my_data.describe().
Categorical variables were displayed, including counts of unique values in each category.
Information about the dataset, such as data types and non-null counts, was printed using my_data.info().
The number of unique values Every single row was ascertained utilizing my_data.nunique().
2) Univariante Plots
Univariate histograms were generated for the dataset.
The histograms were plotted with a specified figure size. The histograms were displayed using plt.show().
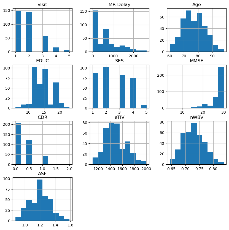
Figure 8 Univariate histograms
The 'dementia' Data Frame was loaded from a CSV file.
An attempt was made to create bar plots for 'Group' (Dementia Type) and 'M/F' (Gender), but errors occurred in both cases. A count plot for 'Group' with a breakdown by 'M/F' was attempted to visualize the connection between Dementia Type and Gender.
A count plot for 'Age' was attempted to classify ages within the dataset.
Figure 9 Classification of Age
Plots with boxes and whiskers were created for the dataset's columns.
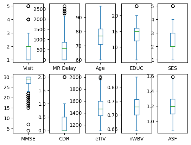
Figure 10 Plots for Box and Whiskers
A boxplot for 'MMSE' was created using Seaborn.
Information about the 'MMSE' The normal difference (SD) and means was provided.
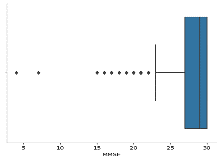
Figure 11 MMSE Mean plot
A boxplot for 'nWBV' was created using Seaborn.
Information about the 'nWBV' as a percentage of intracranial volume was provided.
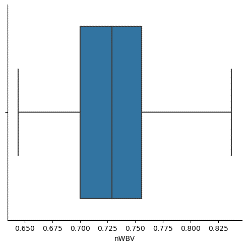
Figure 12 NWBV plot
3) Multivariante Plots
A correlation heatmap was created,.
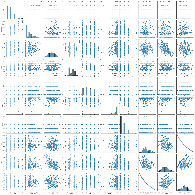
Figure 14 Seaborn grid
A relational plot was created to show the connection amongst 'Age' and 'nWBV' while using different colors to represent different 'Group' categories in the dataset.
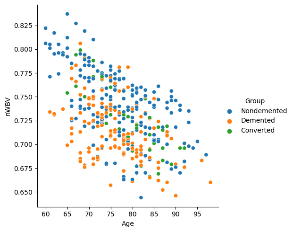
Figure 15 Age vs MWBV and diagnmosis of Dementia
Another relational plot was designed to highlight the connection between 'EDUC' (Education) and 'MMSE' (Mini-Mental State Examination) with various hues signifying various 'Group' categories in the dataset.
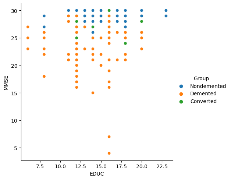
Figure 16 EDUC diagnosis
Another relational plot was created to depict the Relationship among 'eTIV' (Estimated Total Intracranial Volume) and 'ASF' (Atlas Scaling Factor) with various hues signifying various 'Group' categories in the dataset.
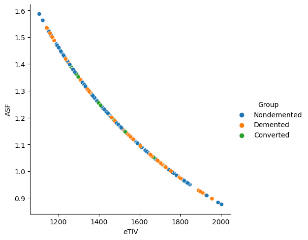
Figure 17bETIV Diagnosis plot
Kernel density estimation (kdeplot) was used to visualize the correlation between "Age" and the different categories within the "Group" variable ('Demented,' 'Nondemented,' and 'Converted').
Labels were added for the x and y axes.
A legend was included to differentiate between the three groups.
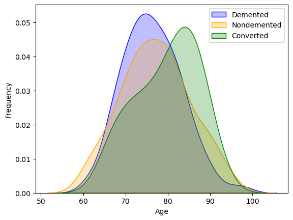
Figure 18 Age and dementia plot
Kernel density estimation (kdeplot) was used to visualize the correlation between "nWBV" and the different categories within the "Group" variable ('Demented,' 'Nondemented,' and 'Converted').
Labels were added for the x and y axes.
A legend was included to differentiate between the three groups.
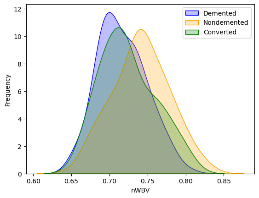
Figure 19 NWBV and dementia plot
Kernel density estimation (kdeplot) was accustomed to visualize the correlation between "EDUC" and the different categories within the "Group" variable ('Demented,' 'Nondemented,' and 'Converted').
Labels were added for the x and y axes.
A legend was included to differentiate between the three groups.
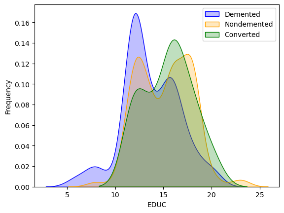
Figure 20 EDUC and dementia diagnosis
Kernel density estimation (kdeplot) was used to visualize the correlation between "SES" and the different categories within the "Group" variable ('Demented,' 'Nondemented,' and 'Converted').
Labels were added for the x and y axes. A legend was included to differentiate between the three groups.
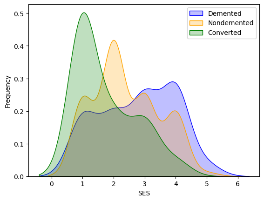
Figure 21 SES and dementia
4) Prepare Data
A copy of the original dataset was made and stored in a new variable named 'dataset.' The first few rows of the copied dataset were displayed using dataset. Head():
Table 2 Dementia datacase
|
Subject ID |
MRI ID |
Group |
Visit |
MR Delay |
M/F |
Hand |
Age |
EDUC |
SES |
MMSE |
CDR |
eTIV |
nWBV |
ASF |
|
|
0 |
OAS2_0001 |
OAS2_0001_MR1 |
Nondemented |
1 |
0 |
M |
R |
87 |
14 |
2.0 |
27.0 |
0.0 |
1987 |
0.696 |
0.883 |
|
1 |
OAS2_0001 |
OAS2_0001_MR2 |
Nondemented |
2 |
457 |
M |
R |
88 |
14 |
2.0 |
30.0 |
0.0 |
2004 |
0.681 |
0.876 |
|
2 |
OAS2_0002 |
OAS2_0002_MR1 |
Demented |
1 |
0 |
M |
R |
75 |
12 |
NaN |
23.0 |
0.5 |
1678 |
0.736 |
1.046 |
|
3 |
OAS2_0002 |
OAS2_0002_MR2 |
Demented |
2 |
560 |
M |
R |
76 |
12 |
NaN |
28.0 |
0.5 |
1738 |
0.713 |
1.010 |
|
4 |
OAS2_0002 |
OAS2_0002_MR3 |
Demented |
3 |
1895 |
M |
R |
80 |
12 |
NaN |
22.0 |
0.5 |
1698 |
0.701 |
1.034 |
C. Data Cleaning
Missing results found in the information were identified and counted using isnull().sum().
Missing values in the 'SES' column were imputed with the mode (most frequent value). Missing values in the 'MMSE' column were imputed with the mean value. After imputing missing values, The quantity of missing values in each column was checked again using isna().sum().
D. Drop Columns
Columns 'Subject ID', 'MRI ID', and 'Hand' were removed from the dataset using the drop function.
The initial panels of the updated dataset were displayed to show the changes.
Table 3 Results obtained
|
Group |
Visit |
MR Delay |
M/F |
Age |
EDUC |
SES |
MMSE |
CDR |
eTIV |
nWBV |
ASF |
|
|
0 |
Nondemented |
1 |
0 |
M |
87 |
14 |
2.0 |
27.0 |
0.0 |
1987 |
0.696 |
0.883 |
|
1 |
Nondemented |
2 |
457 |
M |
88 |
14 |
2.0 |
30.0 |
0.0 |
2004 |
0.681 |
0.876 |
|
2 |
Demented |
1 |
0 |
M |
75 |
12 |
2.0 |
23.0 |
0.5 |
1678 |
0.736 |
1.046 |
|
3 |
Demented |
2 |
560 |
M |
76 |
12 |
2.0 |
28.0 |
0.5 |
1738 |
0.713 |
1.010 |
|
4 |
Demented |
3 |
1895 |
M |
80 |
12 |
2.0 |
22.0 |
0.5 |
1698 |
0.701 |
1.034 |
E. Data Modification
The attributes 'M/F' and 'Group' were renamed to 'Gender' and 'Dementia,' respectively.
Values in the 'Dementia' column were encoded to represent different categories ('Nondemented' as 0, 'Demented' as 1, and 'Converted' as 2). Values in the 'Gender' column were encoded ('M' as 0 and 'F' as 1).
Information about the dataset, including the data types, non-null counts, and memory usage, was presented using info(). Summary statistics of the dataset, for example, minimum, standard deviation, range, number mean, and maximum, were displayed using describe()
Table 5 Overall analysis
|
Dementia |
Visit |
MR Delay |
Gender |
Age |
EDUC |
SES |
MMSE |
CDR |
eTIV |
nWBV |
ASF |
|
|
count |
373.000000 |
373.000000 |
373.000000 |
373.000000 |
373.000000 |
373.000000 |
373.000000 |
373.000000 |
373.000000 |
373.000000 |
373.000000 |
373.000000 |
|
mean |
0.589812 |
1.882038 |
595.104558 |
0.571046 |
77.013405 |
14.597855 |
2.436997 |
27.342318 |
0.290885 |
1488.128686 |
0.729568 |
1.195461 |
|
std |
0.664461 |
0.922843 |
635.485118 |
0.495592 |
7.640957 |
2.876339 |
1.109307 |
3.673329 |
0.374557 |
176.139286 |
0.037135 |
0.138092 |
|
min |
0.000000 |
1.000000 |
0.000000 |
0.000000 |
60.000000 |
6.000000 |
1.000000 |
4.000000 |
0.000000 |
1106.000000 |
0.644000 |
0.876000 |
|
25% |
0.000000 |
1.000000 |
0.000000 |
0.000000 |
71.000000 |
12.000000 |
2.000000 |
27.000000 |
0.000000 |
1357.000000 |
0.700000 |
1.099000 |
|
50% |
0.000000 |
2.000000 |
552.000000 |
1.000000 |
77.000000 |
15.000000 |
2.000000 |
29.000000 |
0.000000 |
1470.000000 |
0.729000 |
1.194000 |
|
75% |
1.000000 |
2.000000 |
873.000000 |
1.000000 |
82.000000 |
16.000000 |
3.000000 |
30.000000 |
0.500000 |
1597.000000 |
0.756000 |
1.293000 |
|
max |
2.000000 |
5.000000 |
2639.000000 |
1.000000 |
98.000000 |
23.000000 |
5.000000 |
30.000000 |
2.000000 |
2004.000000 |
0.837000 |
1.587000 |
F. Evaluate Algorithms
1) Split Data
The dataset was split into features (X) and the target variable (y).
The information was ultimately separated into training and testing sets (80% training, 20% testing).
Oversampling Utilizing SMOTE, the minority population was balanced by class distribution.
The quantity of information before and after oversampling was displayed.
Feature standardization was applied to both the training and testing sets using StandardScaler.
2) Compare Algorithms
Logistic Regression, KNN, and CART classification models were evaluated using cross-validation, and their mean estimated accuracies were calculated.
Numerous classification methods (K-Nearest Neighbors, Decision Tree, Naive Bayesian, a Logistic Re and Linear Discriminant Evaluation), Support Vector Machine, and Random Forest) were compared using cross-validation.
A boxplot was employed to juxtapose and display the results of several strategies..
The mean estimated accuracy about every approach as well as the contrast of multiple algorithms are provided as output.

Figure 21 Comparison of Algorithms.
G. Interpretation of Model Outputs
The key metric Our interests lie in is accuracy, which tells us how well the example is performing in terms of correctly classifying instances. Below is the interpretation of the prototype outputs:
1) Logistic Regression Classification
Mean Estimated Accuracy: Approximately 81.29%
Interpretation: The A logistics regression model was produced. an estimated accuracy of around 81.29%. This means that, on average, the model correctly predicts the class (demented or not) of 81.29% of the cases in the dataset.
2) KNN Classification
Mean Estimated Accuracy: Approximately 82.10%
Interpretation: The KNN classification model achieved an estimated accuracy of around 82.10%. This means that, on average, the model correctly predicts the class based on the majority class among its k nearest neighbors.
3) Decision Tree Classification
Mean Estimated Accuracy: Approximately 90.2%
Interpretation: The decision tree classification model achieved an estimated accuracy of around 90.2%. This means that, on average, the model correctly predicts the class based on a decision tree algorithm, which has learned to split the data into different branches to make predictions
Conclusion
\\In this analysis, the dataset related to dementia diagnosis was prepared and explored. After the data was loaded and summarized, its characteristics were delved into, and various aspects were visualized to gain insights. Data preprocessing involved the handling of missing values, the dropping of unnecessary columns, and the transformation of categorical features into numerical representations. Additionally, class imbalance was addressed through oversampling using SMOTE, and features were standardized to ensure consistent scaling. Next, several classification models, including Logistic Regression, K-Nearest Neighbors (KNN), and Decision Tree (CART), were built and evaluated using cross-validation. These models provided valuable insights into the data and their classification accuracy. The Decision Tree model (CART) outperformed the others with a mean estimated accuracy of 90.2%. Various classification algorithms were also compared, with Random Forest achieving the highest mean estimated accuracy of 94.5%. The analysis highlighted the importance of choosing an appropriate classification model tailored to the specific problem. Lastly, a Voting Ensemble was created, combining Logistic Regression, Decision Tree, and Support Vector Machine (SVM). This ensemble approach achieved a mean estimated accuracy of approximately 89.7%, indicating that combining multiple models can lead to improved classification results. The selection of the final model depended on the specific goals and constraints of the dementia diagnosis problem, considering factors like model performance, interpretability, and practical applicability in a medical environment. The analysis underscored the significance of data preparation, model selection, and evaluation in addressing healthcare challenges, such as dementia diagnosis
References
[1] Mart?-Juan G, Sanroma-Guell G, Piella G. A survey on machine and statistical learning for longitudinal analysis of neuroimaging data in Alzheimer’s disease. Comput Methods Programs Biomed 2020; 189: 105348 [2] Chen P-HC, Liu Y, Peng L. How to develop machine learning models for healthcare. Nat Mater 2019; 18 (5): 410–4. [3] Pellegrini E, Ballerini L, Valdes Hernandez MDC, et al. Machine learning of neuroimaging for assisted diagnosis of cognitive impairment and dementia: a systematic review. Alzheimers Dement 2018; 10 (1): 519–35. [4] Moher D, Liberati A, Tetzlaff J, et al.; PRISMA Group. Preferred reporting items for systematic reviews and meta-analyses: the PRISMA statement. PLoS Med 2009; 6 (7): e1000097. [5] Wu Y, Zhang X, He Y, et al. Predicting Alzheimer’s disease based on survival data and longitudinally measured performance on cognitive and functional scales. Psychiatry Res 2020; 291: 113201. [6] Khan A, Usman M. Early diagnosis of Alzheimer’s disease using informative features of clinical data. In: Proceedings of the International Conference on Machine Vision and Applications. 2018; Singapore. [7] Lin M, Gong P, Yang T, et al. Big data analytical approaches to the NACC dataset: aiding preclinical trial enrichment. Alzheimer Dis Assoc Disord 2018; 32 (1): 18–27. [8] Wang T, Qiu RG, Yu M. Predictive modeling of the progression of Alzheimer’s disease with recurrent neural networks. Sci Rep 2018; 8 (1): 9161. [9] Bhagwat N, Viviano JD, Voineskos AN, et al.; Alzheimer’s Disease Neuroimaging Initiative. Modeling and prediction of clinical symptom trajectories in Alzheimer’s disease using longitudinal data. PLoS Comput Biol 2018; 14 (9): e1006376. [10] Ang TFA, An N, Ding H, et al. Using data science to diagnose and characterize heterogeneity of Alzheimer’s disease. Alzheimers Dement (N Y) 2019; 5: 264–71. [11] Joshi PS, Heydari M, Kannan S, et al. Temporal association of neuropsychological test performance using unsupervised learning reveals a distinct signature of Alzheimer’s disease status. Alzheimers Dement 2019; 5 (1): 964–973. [12] Fisher CK, Smith AM, Walsh JR, et al.; Coalition Against Major Diseases. Machine learning for comprehensive forecasting of Alzheimer’s Disease progression. Sci Rep 2019; 9 (1): 13622
Copyright
Copyright © 2024 Ab Rashid Wani, Dr. Gurinder Kaur Sodhi. This is an open access article distributed under the Creative Commons Attribution License, which permits unrestricted use, distribution, and reproduction in any medium, provided the original work is properly cited.

Download Paper
Paper Id : IJRASET64237
Publish Date : 2024-09-14
ISSN : 2321-9653
Publisher Name : IJRASET
DOI Link : Click Here
 Submit Paper Online

