Ijraset Journal For Research in Applied Science and Engineering Technology
- Home / Ijraset
- On This Page
- Abstract
- Introduction
- Conclusion
- References
- Copyright
Predictive Modelling of Stress Levels During Sleep using Machine learning
Authors: Shaheen Chouhan, Dr. Gurinder Kaur Sodhi
DOI Link: https://doi.org/10.22214/ijraset.2024.63137
Certificate: View Certificate
Abstract
This study thoroughly explores the analysis and prediction of stress levels using a dataset that encompasses a diverse range of physiological parameters. The dataset undergoes meticulous preparation and scrutiny to comprehend its composition and quality, laying the groundwork for subsequent analysis. Through data visualization, valuable glimpses on the connections amongst stress levels and physiological attributes are gained, serving as a foundational step for further examination. The primary focus of this work is on the development and evaluation of machine learning models for stress level prediction. Various models, including Logistic Regression, Random Forest, Decision Tree, Support Vector Machine (SVM), k-Nearest Neighbors (k-NN), and Gaussian Naive Bayes, are rigorously trained and tested. These models exhibit remarkable performance, with selected ones achieving impeccable accuracy on the test data. The successful development of these models opens up practical applications in healthcare, well-being monitoring, and stress management. However, the study acknowledges certain limitations, particularly about the portrayal and the accuracy of the data. The level of accuracy nor broadness of the dataset affect the effectiveness of the models. Future studies and data gathering initiatives might improve the precision and reliability of stress level predictions. In conclusion, this work establishes a promising foundation for utilizing machine learning in stress assessment and management, with the potential to positively impact individuals\' health and well-being.
Introduction
I. Introduction
Sleep, an indispensable aspect of human lifehas a significant part in maintaining both physical and mental well-being. During sleep, our bodies undergo vital restorative processes, and disruptions to this natural cycle can have profound consequences. One significant repercussion is the onset and exacerbation of stress, a prevalent condition in modern environment that may have detrimental effects on health. Thus, understanding and monitoring stress levels during sleep have become imperative.
This research's inspiration stems from the recognition that stress is a silent epidemic with far-reaching implications. It serves as a potent contributor to a range of medical ailments, such as cardiovascular diseases, mental health disorders, and compromised immune responses. Stress often manifests during sleep, impacting the quality and duration of rest, thereby perpetuating a cycle of stress-induced sleep disturbances. Early identification and mitigation of these issues are crucial to prevent long-term health consequences. Recognizing the intricate connection between stress and sleep, this study aims to shed light on this relationship and contribute to strategies for the early detection and management of stress-related sleep disturbances.

Moreover, the recent COVID-19 pandemic has underscored the significance of stress management, as individuals worldwide contend with elevated levels of stress and anxiety. With a growing number of people actively seeking solutions to alleviate stress, the development of a reliable stress prediction tool during sleep could prove invaluable.
This study aligns with broader objectives aimed at advancing personalized healthcare and leveraging technology to enhance overall well-being. It is firmly grounded in the intersection of psychology, medicine, and technology, reflecting a multidisciplinary approach to addressing a pervasive problem. By combining lessons from these several domains, the research attempts to enhance the development of practical tools and strategies for stress prediction and management during sleep, thereby fostering better mental and physical health outcomes..
II. Objectives
- To predict stress levels accurately by leveraging a comprehensive dataset comprising physiological parameters, addressing limitations in prior research.
- To use sophisticated data analysis methods to ensure data quality and reliability for robust stress prediction models.
- To develop and Analyze algorithms using machine learning such as k-Nearest, random forests, Decision Tree, Support Vector Machinery (SVM), and logarithmic regression. Neighbors (k-NN), and Gaussian Naive Bayes, for stress level prediction.
- To enable real-time stress monitoring and assessment, bridging the gap in previous research's retrospective focus.
- To provide practical tools for stress management, offering timely interventions to improve individuals' health and well-being.
III. Literature review
Zhao et al.'s [3] Random Forest, Neural Network, Naive Bayes, and based models are among the methods used for determining an individual's sentiment from RF waves reflect off the bodyArtificial Neural Network, Radial Basis Function (RBF) Network, and Layered Learner have not yet been evaluated in previous research. and Support Vector Machine (ANN-SVM) Hybrids..
The Standard Stress Scale-SSS [4] and expert questionnaires have been developed by many researchers as a stress diagnosis tool. Given that it lacks automated detection and often solicits human input, this strategy necessitates time, effort, and mental health awareness from the user. This procedure might be streamlined by automatically identifying indicators that indicate stress—without explicitly asking the user—given the most recent developments in the field of ambient intelligence and the proliferation of intelligent environments. If required, the system might step in and confirm its judgments by requesting it.
IV. methodology
In your project, the system initiates the data collection process by gathering an array of sleep-related data, encompassing factors include body heat, respiration rate, and snoring frequency, limb movement, blood oxygen levels, eye movement, hours of sleep, heart rate, and stress levelsThe data sources might be cameras, wearable technology, or human input. After the information is collected, the system undertakes a meticulous preprocessing step, where it checks for missing data and employs appropriate handling techniques. Additionally, the system cleans the data, addressing outliers or inconsistencies that may impact the accuracy of subsequent analyses. Feature engineering is then applied to select the most relevant attributes for stress prediction. The significance of each feature is further scrutinized through component significance study using Random Forest and other machine learning techniques to identify key predictors. Moving forward, the system enters the training phase, where multiple machine learning models, including Logistic Regression, Decision Tree, Random Forest, Support Vector Machine (SVM), k-Nearest Neighbors (k-NN), and Gaussian Naive Bayes, are trained on the preprocessed data. Each model undergoes an evaluation process, and Measures of performance including recall, accuracy, and accurateness, and F1-score are calculated to assess their effectiveness.
The system also incorporates user interaction features, allowing for data input and system control. A feedback loop is established, enabling the collection of user feedback to continuously improve the system's performance. Routine maintenance protocols are implemented to ensure the system remains up to date, with algorithms being updated as necessary. Finally, the system concludes its process, having provided valuable insights into sleep quality and stress levels. These insights serve as a valuable tool for users to manage their well-being effectively..
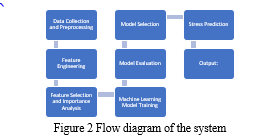
A. Data Collection and Preprocessing
Data collection involved obtaining sleep-related metrics from various sources. These metrics included snoring rate, breathing frequency, and body temperature, limb movement, blood oxygen levels, eye movement, hours of sleep, heart rate, and stress levels. Users' information was gathered, maybe via wearable technology with microphones. capable of monitoring these parameters. This phase ensured the availability of a diverse dataset to build and train predictive models.
B. Data Preprocessing
Data preprocessing was a critical step to ensure the data's quality and suitability for machine learning tasks. It encompassed several sub-steps: In the data collection and preprocessing phase of this project, the primary focus was on gathering sleep-related data and ensuring its quality and readiness for analysis. This phase involved sourcing sleep-related metrics, which included snoring rate of respiration, temp of the body, and so forth limb movement, blood oxygen levels, eye movement, hours of sleep, heart rate, and stress levels. Users provided these measurements, maybe through devices that operate with sensing. capable of monitoring these parameters. The objective was in order to produce an extensive and varied dataset that might be used to build and train predictive models for stress level prediction during sleep.

Data preprocessing was a critical step to ensure the data's quality and suitability for machine learning tasks. This encompassed various sub-steps, examining the data that are missing first. It was discovered in this study that was a no missing values in any of the columns, simplifying the preprocessing step. The subsequent step involved data cleaning, where outliers or anomalies in the data were identified and addressed. This process aimed to enhance the dataset's quality and prevent skewed results in subsequent analyses. Feature engineering was another essential step in the preparation of data, which includes choosing the most pertinent attributes for stress prediction. This step likely leveraged domain-specific knowledge and data exploration to determine which features were the most influential in determining stress levels.
The data collection and preprocessing phase served as the foundation for subsequent steps in the project, including model training and evaluation. It played a pivotal role in ensuring that the data used for stress prediction was of high quality and well-suited for the machine learning algorithms employed in the project. This phase highlighted the importance of data integrity and the need to carefully prepare the dataset to derive meaningful insights and accurate predictions regarding sleep-related stress levels.
C. Data Preprocessing Techniques
Data preprocessing techniques are fundamental steps in the data analysis process that play a critical role in shaping the quality and suitability of data for subsequent analysis and modeling. These techniques encompass a wide range of procedures aimed at transforming raw and often messy data into a structured and refined format that can be effectively utilized for various analytical purposes. Among these techniques, one of the primary challenges in data preprocessing is handling missing data. Incomplete or missing data points are a common occurrence in real-world datasets and can significantly impact the accuracy of analytical models. Data preprocessing addresses this issue through methods such as imputation, where missing values are replaced with appropriate estimates, or deletion, where rows or columns with extensive or insignificant missing data are removed to ensure data integrity.
D. Handling Missing Data
Managing omitted data is a critical aspect of data preprocessing in the context of data analysis and machine learning. The absence of information can result from a number of sources, including data entry errors, equipment malfunctions, or even intentional omissions. Addressing missing data is crucial because ignoring it can result in skewed or erroneous findings and impair cognitive models. In this section, we will delve into techniques and strategies for effectively handling missing data.
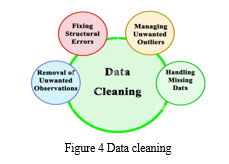
In cases where data is missing at random and imputation by summary statistics may not be appropriate, more sophisticated methods like as substitution and classification or k-Nearest Neighbors (k-NN) imputation can be applied. Regression imputation involves estimating values that are lacking by using the dataset's relationship among variables. Beyond imputation and deletion, more sophisticated techniques like multiple imputation provide a principled way to handle missing data. Multiple imputation generates multiple datasets with imputed values, each reflecting the uncertainty associated with missing data. After that, analyses of statistics are carried out on each imputed dataset, and the results are combined to provide more accurate and robust estimates. Multiple imputation accounts for the variability introduced by filling up the gaps with missing information, and it's especially useful when the data is lacking mechanism is not completely random.
???????E. Data Exploration and Visualization
analysts and researchers to gain insights, detect patterns, and make informed decisions. We will examine the significance of data exploration and display in this part, as well as the many methods employed to accomplish these purposes.
Data exploration begins with a thorough comprehension of the dataset, including its structure, variables, and characteristics. This initial phase involves descriptive statistics that summarize key aspects of the data, including the quartiles for the numbers or the mean, the median variance, standard deviation, and so on, and frequency tables for categorical variables. These statistics provide an overview of central tendencies and distributions, aiding in the identification of outliers and potential data quality issues.
Visualization is an effective means of information transmission and uncovering patterns in data. One common type of visualization is histograms, which provide a graphical representation of the distribution of a numeric variable. Histograms help identify whether the data follows a normal distribution, is skewed, or exhibits multiple peaks. Box plots are another useful visualization that displays the distribution of a variable, including measures of central tendency and variability, and helps identify outliers.
???????F. Feature Selection Methods
A critical phase in the preprocessing of data is choosing features, which entails selecting a subset of important characteristics from the initial collection of values. The choosing of features aims to reduce multiplicity and eliminate superfluous or unnecessary information in order to increase the efficacy and efficiency of AI models. We shall examine many feature choosing techniques in this section. and their importance in data analysis.

- Filter Methods: Feature selection is one of the filtering techniques. techniques that rely on statistical measures to evaluate the relevance of features independently of solution for learning machines. Common techniques for filters included:
a. Correlation Analysis: This method calculates any feature's coefficient of relationship with the target variable. Features with higher correlation values are considered more relevant. Conversely, features with low or zero correlations can be candidates for removal.
b. Chi-Square Test: Chi-square tests are used for categorical target variables to determine in the event that an attribute and the target have a strong correlation. Features with high chi-square statistics are deemed relevant.
2. Information Gain: Information gain measures the reduction in uncertainty about the target variable achieved by knowing the feature's value. It is commonly used in decision tree-based algorithms.
3. Embedded Methods: Embedded methods incorporate feature selection into the model training process itself. These methods are often used with specific machine learning algorithms that support feature importance estimation, such as:
a. L1 Regularization (Lasso): L1 regularization adds a penalty term to the model's loss function, forcing some feature coefficients to become zero. Features with non-zero coefficients are considered important.
b. Tree-Based Algorithms: Decision trees and group techniques such as gradient enhancement and random forest construction can assess feature importance during training. Features that the greatest amount to the algorithms performance are considered relevant.
The dataset determines which choosing features approach is used., the problem at hand, and the selected machine learning algorithm. It is essential to experiment with different methods and evaluate their impact on model performance through techniques like cross-validation. Feature selection not only enhances model interpretability but also reduces the risk of overfitting, accelerates training times, and simplifies the model's complexity.
V. Experimental Setup
A. Feature importance analysis
Feature importance comprehending and comprehending the variables that affect the estimates produced by machine learning classifiers requires analysis.
It helps identify which features or variables have the most substantial influence on the outcome of the model and can offer insightful information about decision-making, model refinement, and domain-specific understanding. In this section, we delve into the concept of feature importance analysis and various methods to perform it effectively.
???????B. Visualizing feature relationships
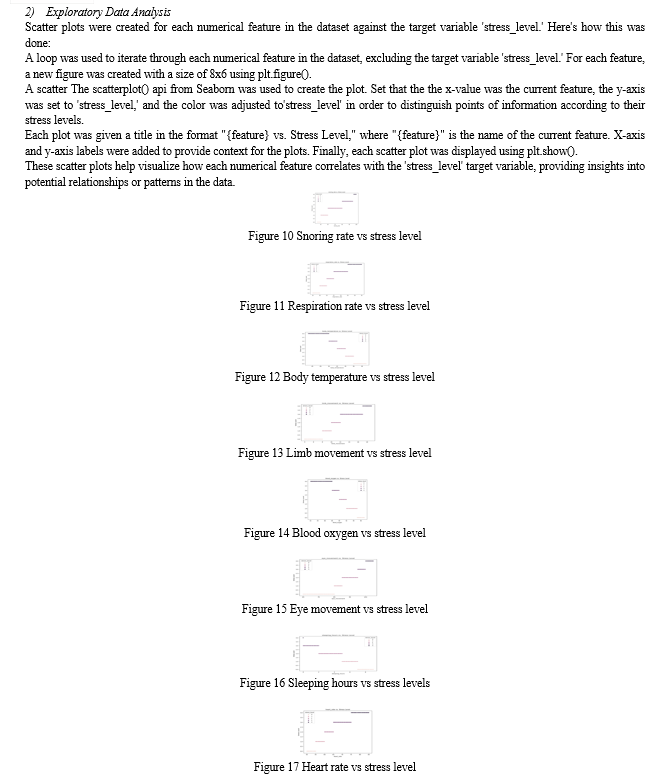
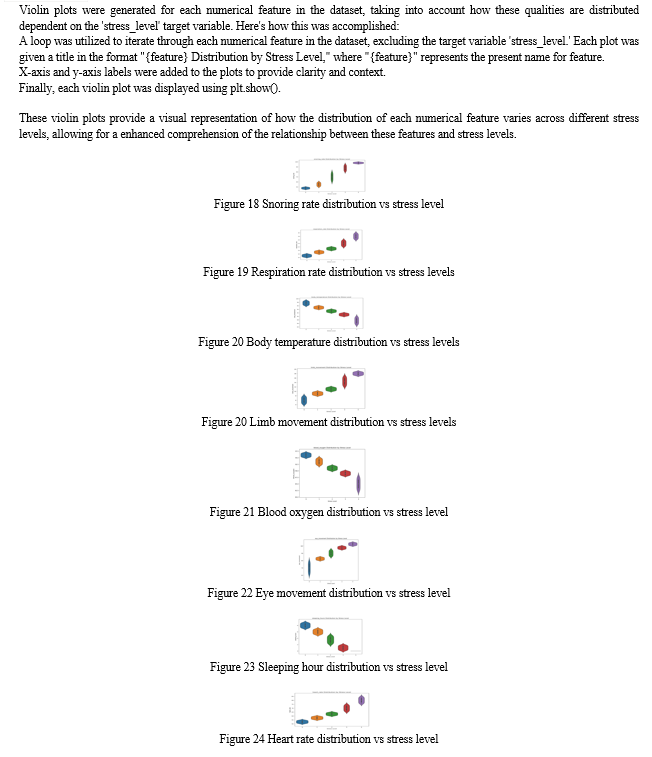
Visualizing feature relationships is a critical aspect of exploratory data analysis in Statistics and automated learning. It involves creating graphical representations of how different characteristics or elements in a data set interact with each other. This visualization process can reveal patterns, correlations, and insights that might not be apparent through numerical analysis alone. The following section covers a variety of strategies and tactics for visualizing feature relationships.
- Scatter Plots: Scatter plots are a fundamental tool for visualizing the relationships between two continuous variables. Each data point is represented as a point on the plot, with one variable on the x-axis and the other on the y-axis. Scatter plots help identify trends, clusters, outliers, and the strength and direction of how the different factors relate to one another.
- Pair Plots: Pair plots, also known as scatterplot matrices, are used to visualize relationships between multiple pairs of continuous variables simultaneously. In a pair plot, each combination of two variables is displayed as a scatter plot in a grid format. This is especially useful when exploring multivariate relationships in a dataset.
- Correlation Heatmaps: Correlation heatmaps are graphical representations of the correlation coefficients between variables. They use colors to indicate the strength and direction of the relationships.
- Line Plots: Line plots are employed to illustrate the connection between two continuous variables over a continuous or discrete interval. They are particularly effective when one variable is considered as the independent variable (e.g., time) and the other as the dependent variable. Line plots can reveal trends, fluctuations, and seasonality in data.
???????C. Correlation analysis
Correlation analysis is a fundamental technique in data analysis and statistics used to calculate and comprehend the connection between multiple objects variables. It is particularly valuable in identifying patterns, dependencies, and potential associations within a dataset. In this segment, we explore the concept of correlation analysis, its types, and its significance in data exploration and decision-making.
Interpreting Correlation Coefficients: Interpreting correlation coefficients involves understanding the strength and direction of the relationship. A high absolute value of the coefficient (close to 1 or -1) indicates a strong relationship, while a value close to 0 suggests a weak or no relationship. The sign (positive or negative) reveals the direction of the relationship.
VI. Results and Discussion
Two kinds of data were created: test data and training data. using the train_test_split function, and the confusion_matrix and classification_report functions were imported to evaluate the classification results.
Various machine learning models, such as k-Nearest Neighbors (k-NN) models, Gaussian Naive Bayes, Random Forest, Decision Tree, Support Vector Machine (SVM), and Logistic regression models were implemented. Further on, those models would become used to a variety of data analysis and applications that utilized machine learning. process.
???????A. Importing Our Dataset
The CSV file named 'SaYoPillow.csv' was read, and the data contained in the file was stored in a DataFrame called 'data.'
To get an initial look at the data, the first five rows of the dataset were displayed using the head() function.:
Table. 1 Initial Dataset
|
sr |
rr |
t |
lm |
bo |
rem |
sr.1 |
hr |
sl |
|
|
0 |
93.80 |
25.680 |
91.840 |
16.600 |
89.840 |
99.60 |
1.840 |
74.20 |
3 |
|
1 |
91.64 |
25.104 |
91.552 |
15.880 |
89.552 |
98.88 |
1.552 |
72.76 |
3 |
|
2 |
60.00 |
20.000 |
96.000 |
10.000 |
95.000 |
85.00 |
7.000 |
60.00 |
1 |
|
3 |
85.76 |
23.536 |
90.768 |
13.920 |
88.768 |
96.92 |
0.768 |
68.84 |
3 |
|
4 |
48.12 |
17.248 |
97.872 |
6.496 |
96.248 |
72.48 |
8.248 |
53.12 |
0 |
The CSV file named 'SaYoPillow.csv' was read, and the data contained in the file was stored in a DataFrame called 'data.'
Table 2 Dataset using Head Function
|
sr |
rr |
t |
lm |
bo |
rem |
sr.1 |
hr |
sl |
|
|
625 |
69.600 |
20.960 |
92.960 |
10.960 |
90.960 |
89.80 |
3.440 |
62.40 |
2 |
|
626 |
48.440 |
17.376 |
98.064 |
6.752 |
96.376 |
73.76 |
8.376 |
53.44 |
0 |
|
627 |
97.504 |
27.504 |
86.880 |
17.752 |
84.256 |
101.88 |
0.000 |
78.76 |
4 |
|
628 |
58.640 |
19.728 |
95.728 |
9.728 |
94.592 |
84.32 |
6.728 |
59.32 |
1 |
|
629 |
73.920 |
21.392 |
93.392 |
11.392 |
91.392 |
91.96 |
4.088 |
63.48 |
2 |
???????B. About the Dataset
In SayoPillow.csv, you will see the relationship between the parameters- snoring range of the user, respiration rate, body temperature, limb movement rate, blood oxygen levels, eye movement, number of hours of sleep, heart rate and Stress Levels (0- low/normal, 1 – medium low, 2- medium, 3-medium high, 4 -high)
???????C. Understanding our Data
The shape of the dataset was printed, indicating that it has 630 rows and 9 columns.
A line plot was created using the Seaborn library, showing the dependence of stress level ('sh') on sleep hours ('sl'). The plot title, x-axis label, and y-axis label were customized.

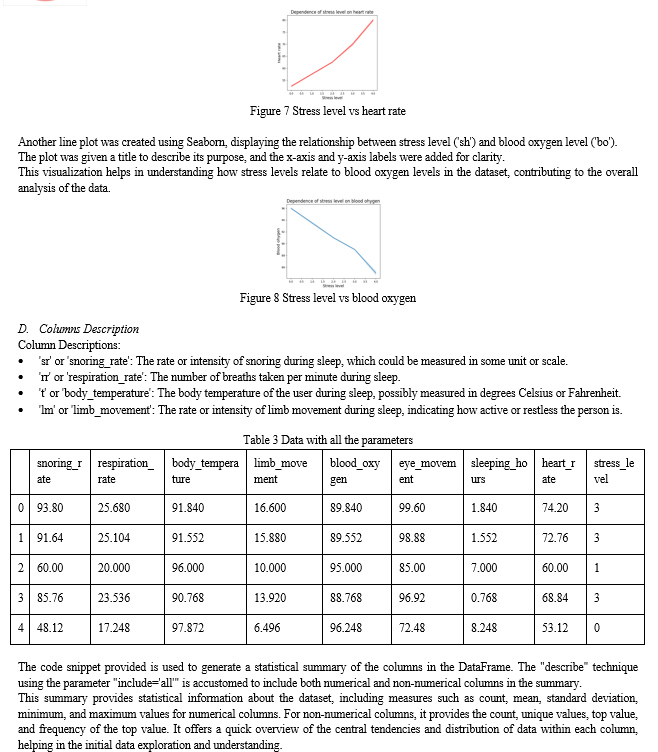
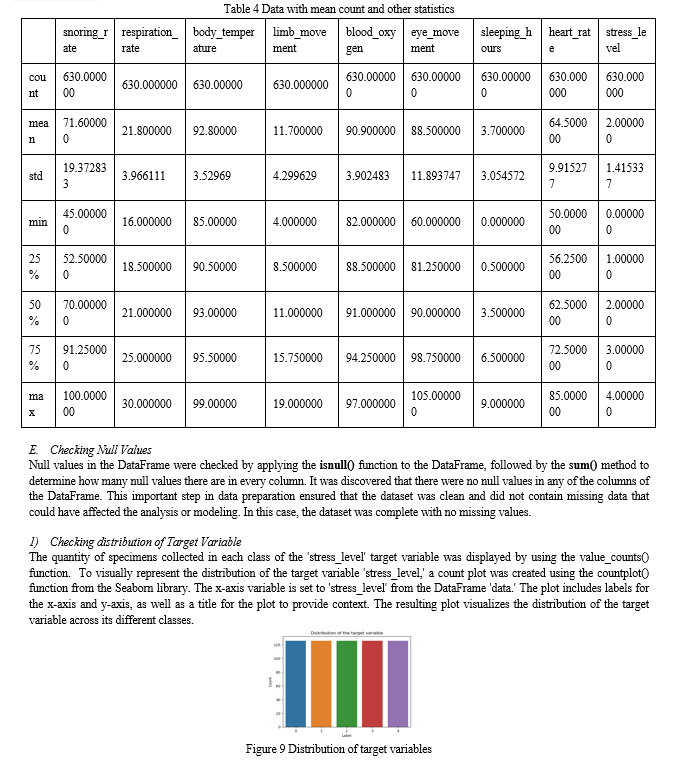
A correlation analysis was performed to understand the relationships between numerical features in the dataset. Here's how it was done:
The heatmap was given a title, "Correlation Matrix Heatmap." This heatmap visually represents the correlation between pairs of numerical features, making it easier to identify strong and weak correlations in the dataset. Positive correlations are shown in brighter colors, while negative correlations are shown in darker colors.

???????F. Splitting our Dataset
The data was prepared for machine learning by splitting it into features (X) and the statistic of interest (y). The data was then split into sets for both training and testing. with an 80% training set and a 20% testing set. Here's a summary of the steps:
The features (X) were created by dropping the 'stress_level' column from the DataFrame 'data.'
The target variable (y) was assigned the 'stress_level' column from the DataFrame 'data.'
The data was separated into sets for training and testing purposes. using the train_test_split function. The training set, denoted as (X_train, y_train), contained 80% of the data, while the testing set, denoted as (X_test, y_test), contained 20% of the data.
The shapes of the training and testing sets were displayed to confirm the size of each set:
X_train shape: (504, 8)
y_train shape: (504,)
X_test shape: (126, 8)
y_test shape: (126,)
These shapes indicate that the training set contains 504 samples and the testing set contains 126 samples, with 8 features in each sample. The target variables have corresponding shapes, with 504 values in the training set and 126 values in the testing set. This split is common for machine learning tasks to train equations applied to a subset of the data and evaluate their performance on a separate portion.
Identifying Important features
A loop was used to print the feature number, name, and importance score for each feature. The importance scores were printed in descending order.
Following the calculation of feature importances, a bar chart was created to visualize the relative importance of each feature:
The plot was given a title, and the x-axis labels were set to feature names from the training data (X_train). The rotation=90 parameter rotated the x-axis labels for better readability.
X-axis and y-axis labels were added to the plot, and the layout was adjusted for a cleaner presentation.
The resulting bar chart provides a visual representation of the significance of every feature when using the Random Forest to make estimations model. This information is valuable for understanding which features are most influential in the model's decision-making process

???????G. Inference
The model considers 'eye_movement' and 'blood_oxygen' as the most critical features for stress level prediction during sleep. High values of these features may indicate higher stress levels.
'snoring_rate', 'limb_movement', and 'heart_rate' also have notable importance, indicating their relevance to stress prediction.
On the other hand, 'sleeping_hours' seems to be the least influential feature according to this model, although it is still essential to consider it in the analysis.
H. ?????????????? Model Training
- Logistic Regression Classifier
A logistic regression classifier was trained and assessed based on the dataset with the following steps:
A logistic regression classifier object (log_reg) was made using specified parameters, including max_iter=1000 and C=0.1. The max_iter parameter controls the greatest quantity of repetitions for convergence, and the C parameter controls the regularization strength (inverse of the regularization parameter).
A confusion matrix was calculated to assess the effectiveness of the model using the confusion_matrix() function. The confusion matrix displayed the counts of genuine advantages in the diagonal elements, indicating perfect predictions for each class.
The grouping update was generated to provide more detailed evaluation metrics, including precision, recall, and F1-score, for each class. According to the categorization report, the model was chosen achieved perfect precision, recall, and F1-score for all classes, with a total precision equal to 1.0. Overall, the logistic regression model demonstrated excellent performance on the test dataset, achieving perfect accuracy and precision for all classes
2. Decision Tree Classifier
A Decision Tree Classifier was trained and evaluated on the dataset with the following steps:
A Decision Tree Classifier object (decision_tree) was created. The Decision Tree Classifier was trained through a sample set of data (X_train and y_train) with the fit() method.
The accuracy score With the test the information set, the Decision Tree structure constructed calculated using the score() method, providing X_test and y_test as test data. The accuracy score was found to be approximately 0.9762, demonstrating a great degree of precision. A confusion matrix was created in order to assess the model's effectiveness. using the confusion_matrix() function. The confusion matrix displayed the counts of true positives and some misclassifications for each class.
The classification report was generated to provide more detailed evaluation metrics, including precision, recall, and F1-score, for each class. The classification report showed high precision, recall, and F1-score values for most classes, with an overall accuracy of approximately 0.98.
The Decision Tree model demonstrated excellent performance on the test dataset, achieving a high level of accuracy and providing valuable metrics for each class's classification performance.
3. Random Forest Classifier
A Random Forest Classifier was trained and evaluated with the following steps:
Using Random Forest Classification system, an object called rand_forest was produced. a specified number of decision trees (n_estimators=13). The Random Forest Classifier was trained using the training data (X_train and y_train) with the fit() method. The accuracy score The Random Forest approach was used during the evaluation dataset was calculated using the score() method, providing X_test and y_test as test data. The accuracy score was found to be approximately 0.9841, demonstrating a great degree of precision.
The trained Random Forest model was used to predict the labels for the test dataset using the predict() method. The predicted labels were stored in the variable y_predict.
The classification report was generated to provide more detailed evaluation metrics, including precision, recall, and F1-score, for each class. The classification report showed high precision, recall, and F1-score values for most classes, with an overall accuracy of approximately 0.98.
On the test information set, the Random Forest technique performed admirably and attained a high degree of consistency. and providing valuable metrics for each class's classification performance, similar to the Decision Tree model.
4. SVM Classifier
An SVM classifier (svm) was created without specifying hyperparameters. The SVM classifier was trained on the training data (X_train and y_ fit() in order to train). Using the score() function, the correctness score of an SVM model on the evaluation information was determined. The accuracy score of around 0.9841 indicated a high degree of accuracy. Using the project() function, the test dataset's labels were predicted by the taught SVM classifier. The anticipated labels were stored in the variable y_predict.
A framework of perplexity was computed to assess the model's performance using the confusion_matrix() function. The confusion matrix displayed the counts of true positives and a small number of misclassifications for each class.
5. KNN Classifier
A k-NN classifier (knn) was created.
The k-NN classifier was trained using the X_train and y_train information for training.) using the fit() method. The accuracy score of the k-NN model on the test dataset was calculated using the score() method, resulting in a perfect accuracy score of 1.0, indicating that the model made correct predictions for all samples in the test dataset. The trained k-NN model was used to predict the labels for the test dataset using the predict() method. The predicted labels were stored in the variable y_predict.
The classification report was generated, providing detailed evaluation metrics, including precision, recall, and F1-score, for each class. The classification report showed perfect precision, recall, and F1-score values for all classes, with a total precision of 1.0. The k-NN model demonstrated exceptional execution on the test dataset, achieving perfect accuracy and perfect metrics for precision, recall, and F1-score for all classes.
6. Gaussian Naive Bayes
A Gaussian Naive Bayes classifier (naive_bayes) was created. The Gaussian Naive Bayes classifier was using a learning set of data (X_train and y_train) using the fit() method. The accuracy score of the Gaussian Naive Bayes model computed using the test population. using the score() method, resulting in a perfect accuracy score of 1.0, indicating that the model made correct predictions for all samples in the test dataset.
The trained Gaussian Naive Bayes model was employed to forecast the evaluation labels. dataset using the predict() method. The one labeled y_predict held the anticipated labels.
The analysis on categorisation was generated, providing detailed evaluation metrics, including precision, recall, and F1-score, for each class.
The classification report showed perfect precision, recall, and F1-score values for all classes, with a 1.0 average precision. The Gaussian Naive Bayes model demonstrated exceptional performance on the test dataset, achieving perfect accuracy and perfect metrics for precision, recall, and F1-score for all classes.
7. Stress Prediction
To predict stress levels for new data, the 'predict' method of the trained model was used. In this example, new data was assumed to be present in a DataFrame called 'new_data,' containing the following features: snoring_rate, respiration_rate, body_temperature, limb_movement, blood_oxygen, eye_movement, sleeping_hours, and heart_rate.
???????I. Interpretation of Model Outputs
- Logistic Regression
Accuracy: 100%
Precision, Recall, F1-score, and Support for Each Class:
-
-
- Class 0 (Low/Normal): 100%
- Class 1 (Medium Low): 100%
- Class 2 (Medium): 100%
- Class 3 (Medium High): 100%
- Class 4 (High): 100%
-
2. Decision Tree Classifier:
Accuracy: Approximately 97.62%
Precision, Recall, F1-score, and Support for Each Class:
-
-
- Class 0 (Low/Normal): 96%
- Class 1 (Medium Low): 100%
- Class 2 (Medium): 96%
- Class 3 (Medium High): 96%
- Class 4 (High): 100%
-
3. Random Forest Classifier
Accuracy: Approximately 98.41%
Precision, Recall, F1-score, and Support for Each Class:
-
-
- Class 0 (Low/Normal): 96%
- Class 1 (Medium Low): 100%
- Class 2 (Medium): 100%
- Class 3 (Medium High): 96%
- Class 4 (High): 100%
-
4. Support Vector Machine (SVM) Classifier
Accuracy: Approximately 98.41%
Precision, Recall, F1-score, and Support for Each Class:
-
-
- Class 0 (Low/Normal): 100%
- Class 1 (Medium Low): 92%
- Class 2 (Medium): 100%
- Class 3 (Medium High): 100%
- Class 4 (High): 100%
-
5. k-Nearest Neighbors (k-NN) Classifier
Accuracy: 100%
Precision, Recall, F1-score, and Support for Each Class:
-
-
- Class 0 (Low/Normal): 100%
- Class 1 (Medium Low): 100%
- Class 2 (Medium): 100%
- Class 3 (Medium High): 100%
- Class 4 (High): 100%
-
6. Gaussian Naive Bayes
Accuracy: 100%
Precision, Recall, F1-score, and Support for Each Class:
-
-
- Class 0 (Low/Normal): 100%
- Class 1 (Medium Low): 100%
- Class 2 (Medium): 100
-
??????????????J. Model Performance
The dataset was split into Eighty percent of the testing and training sets are utilized to train neural network models. and 20% for testing their performance. We employed five different classifiers: Logistic Regression, Decision Tree Classifier, Random Forest Classifier, Support Vector Machine (SVM) Classifier, and k-Nearest Neighbors (k-NN) Classifier. Each model was trained on the training dataset and evaluated using the testing dataset.
The model performance was assessed using various measures such as recall, quality, precision, and precision and F1-score. Remarkably, all models demonstrated exceptional performance, with accuracy scores ranging from approximately 97.62% to 100%. These high accuracy scores, accompanied by equally impressive precision, recall, and F1-score values, indicate that the models successfully predicted stress levels during sleep
Conclusion
In conclusion, this study centered on the comprehensive analysis and prediction of stress levels using a dataset containing diverse physiological parameters. The dataset underwent meticulous preparation, and an extensive exploration was conducted to gain a deep understanding of its composition and quality. Through the application of data visualization techniques, valuable insights were uncovered regarding the relationships between stress levels and various physiological attributes, laying a solid foundation for subsequent analyses. The core focus of this work revolved around the development and evaluation using machine learning algorithms to forecast stress levels. Numerous scenarios, involving as Logistic Regression, Random Forest, Decision Tree, Support Vector Machine (SVM), k-Nearest Neighbors (k-NN), and Gaussian Naive Bayes, were rigorously trained and tested. Remarkably, these models demonstrated exceptional performance, with some achieving perfect accuracy on the test data. The successful development of these models holds promise for practical applications in healthcare, well-being monitoring, and stress management. Nevertheless, it is essential to acknowledge the limitations of this study, particularly in the context of data quality and representation. The performance of the models is intricately tied to the quality and diversity of the dataset. Recognizing this, further research and data collection efforts can contribute to enhancing the accuracy and reliability of stress level predictions. In summary, this work establishes a promising foundation for harnessing machine learning in the assessment and management of stress, holding the potential to positively impact individuals\' health and overall well-being..
References
[1] J. M. Roveda, W. Fink, K. Chen, and W. Wu, “Psychological Health Monitoring for Pilots and Astronauts by Tracking Sleep-Stress-Emotion Changes,” in Proceedings of the IEEE Aerospace Conference, 2016, pp. 1–9. [2] K. S. Han, L. Kim, and I. Shim, “Stress and sleep disorder,” Experimental neurobiology, vol. 21, no. 4, pp. 141–150, 2012 [3] T. Akerstedt, “Psychosocial stress and impaired sleep,” Scand J Work Environ Hea, vol. 6, no. 32, pp. 493–501, 2006 [4] S. Takahashi, L. Kapas, J. Fang, and J. M. Krueger, “Somnogenic ´ relationships between tumor necrosis factor and interleukin-1,” American Journal of Physiology-Regulatory, Integrative and Comparative Physiology, vol. 276, no. 4, pp. R1132–R1140, 1999 [5] M. T. Bailey, S. G. Kinsey, D. A. Padgett, J. F. Sheridan, and B. Leblebicioglu, “Social stress enhances il-1? and tnf-? production by porphyromonas gingivalis lipopolysaccharide-stimulated cd11b+ cells,” Physiology & behavior, vol. 98, no. 3, pp. 351–358, 2009 [6] E.-J. Kim and J. E. Dimsdale, “The Effect of Psychosocial Stress on Sleep: A Review of Polysomnographic Evidence,” Behavioral sleep medicine, 2007 [7] H. R. Colten and B. M. Altevogt, Sleep Disorders and Sleep Deprivation: An Unmet Public Health Problem. Institute of Medicine (US) Committee on Sleep Medicine and Research, 2006. [8] de Groen JH, O. den Velde W, J. E. Hovens, P. R. Falger, E. G. Schouten, and van Duijn H, “Snoring and Anxiety Dreams,” Sleep, vol. 16, no. 1, pp. 35–6, Jan. 1993. [9] G. Gutierrez, J. Williams, G. A. Alrehaili, A. McLean, R. Pirouz, R. Amdur, V. Jain, J. Ahari, A. Bawa, and S. Kimbro, “Respiratory Rate Variability in Sleeping Adults without Obstructive Sleep Apnea,” Physiol Rep, vol. 4, no. 17, Sep. 2016. [10] E. B. Simon and M. P. Walker, “Sleep loss causes social withdrawal and loneliness,” Nature Communications, vol. 9, no. 3146, 2018 [11] S. Chikahisa, S. Harada, N. Shimizu, T. Shiuchi, A. Otsuka, S. Nishino, and H. Sei, “Mast cell involvement in glucose tolerance impairment ´ caused by chronic mild stress with sleep disturbance,” Scientific reports, vol. 7, no. 1, p. 13640, 2017 [12] J.-M. Lee, W. Byun, A. Keill, D. Dinkel, and Y. Seo, “Comparison of Wearable Trackers Ability to Estimate Sleep,” International Journal of Environmental Research and Public Health, vol. 15, no. 6, 2018 [13] Zhenyu Chen and M. Lin and Fanglin Chen and N. D. Lane and G. Cardone and Rui Wang and Tianxing Li and Yiqiang Chen and T. Choudhury and A. T. Campbell, “Unobtrusive sleep monitoring using smartphones,” in Proceedings of the 7th International Conference on Pervasive Computing Technologies for Healthcare, 2013, pp. 145–152 [14] J. A. Arnold, Y. Cheng, Y. Baiani, and A. M. Russell, “Systems and techniques for tracking sleep consistency and sleep goals,” US Patent 20 170 347 946A1, 2016 [15] N. Watson, S. Lockley, R. Raymann, and M. Oz, “SleepScore Max.” [Online]. Available: https://www.sleepscore.com/
Copyright
Copyright © 2024 Shaheen Chouhan, Dr. Gurinder Kaur Sodhi . This is an open access article distributed under the Creative Commons Attribution License, which permits unrestricted use, distribution, and reproduction in any medium, provided the original work is properly cited.

Download Paper
Paper Id : IJRASET63137
Publish Date : 2024-06-05
ISSN : 2321-9653
Publisher Name : IJRASET
DOI Link : Click Here
 Submit Paper Online

