Ijraset Journal For Research in Applied Science and Engineering Technology
- Home / Ijraset
- On This Page
- Abstract
- Introduction
- Conclusion
- References
- Copyright
Premilinary Assessment for Physcio-Chemical Parameters of Ground Water in and Around Gundlapochampally, Medchal Malkajgiri District Telangana
Authors: Musini Venkateshwarlu, Padamata Yeswanth Babu, Dosilla Jashuva, K. Sravya, K Prudvi Raj
DOI Link: https://doi.org/10.22214/ijraset.2024.59521
Certificate: View Certificate
Abstract
Ground water is one of the most valuable natural sources of drinking water and various usages with increase in urbanization and industrialization, health conditions are influenced by the chemical aspects of groundwater and geology of the region. Access to wholesome drinking water remains an urgent necessity Ground water is one of the most valuable natural sources of drinking water and various usages. Within the world as it is directly related to the health. Groundwater accounts for more than 80% of the rural domestic water supply in India. The integrated ground water prospects maps are preferred by using different thematic layers like Geology, Geomorphology, Structures, Hydrology, etc. Drinking water quality data of Rural Water supply sources situated in Gundlapochampally village, Medchal district is studied for the parameters of pH, Electrical Conductivity, Total Dissolved solids, Total Hardness, Calcium Magnesium, Sodium, Potassium, Alkalinity, Acidity, Chloride, Nitrate, Floride, Bi-carbonate. The results ware compare with the drinking water standards given by World Health Organization and Bureau of Indian Standards. Thus this research work recommended that the potassium and bicarbonates Contaminated water in Gundlapochampally region is not at all fit for drinking as a solution it was suggested that the solid waste treatment plant should be setup to handle crisis.
Introduction
I. INTRODUCTION
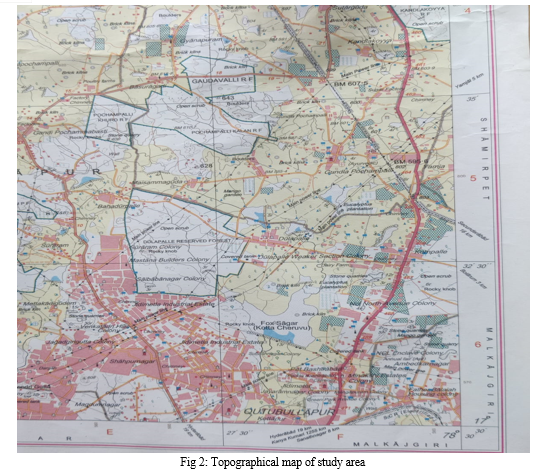
Two- thirds of the earth surface is covered by water. Water is very important to life, without water our life cannot move Availability of quality freshwater is one of the most critical environmental issues of the twenty first century. Groundwater is an important water resource for domestic and agriculture in both rural and urban parts of India. The chemical composition of groundwater is very important criteria that determine the quality of water. Water quality is very important and often degraded due to agricultural, industrial and human activities. Even though the natural environmental processes provide by means of removing pollutants from water, there are definite limits. It is up to the people to provide security to protect and maintain quality of water. Drinking water with good quality is very important to improve the life of people and to prevent diseases. Pollution of groundwater comes from many sources. Discharge of waste disposal from agriculture, industries and municipalities are main source of groundwater pollution. Sometimes surface run-off also brings mud, leaves, and human and animal wastes into surface water bodies. These pollutants may enter directly into the groundwater and contaminate it. Water quality index calculation comprises anions and cat-ions weight which is then compared with Indian water quality standards; therefore, it follows the standard hydro-chemical laboratory analysis procedure, demurred concentration of parameters One has to note that Parameters are seldom weighed before their perceived importance concerning the index of groundwater quality, estimated as per the average atomic weight of the elements. Understanding the Spatial distribution of water is essential to evaluate the characteristics of water in that geography. This is done by using geospatial techniques. Gundlapochampally is located in the northern part of the Medchal–Malkajgiri District in Telangana State. It is lies between North latitudes 17° 32′–17° 40′ and East longitudes 78° 22′–78° 35′.. The average elevation is 602 m. The geographical area is 150.3 km2 Gundlapochampally Village Total population is 9009 (as per Cencus 2011) and the rainfall is around 812.3805 mm.
II. MATERIALS AND METHODS
The hydro-geochemical analysis explores the groundwater problem of the MedchalMandal using GIS, and remote sensing techniques. In this regard, groundwater samples were collected in December month in MedchalMandal.
Eugene Brown has recommended standards for safety precautions, security, and feasible site access that became the basis for our safety protocols. The following precautions were taken while collecting groundwater samples. They include:
- Labeling of the bottles before collecting water.
- Demarcation of exact GPS coordinates.
- BIS standard gloves to be used.
- Avoiding jewelry and other accessories to avoid contamination of Samples.
The samples were collected from different locations like land meant for cultivation, residential complexes, construction land, land where pump sets were installed, and all other possible regions where groundwater can be accessed. In the semi-urban region, few places such as motor bore wells in apartments, temples, and parks were used as sources for groundwater.
Thus, 27 groundwater samples were collected in water bottles in Gundlapochampally and analyzed in a geochemical laboratory. A total of 14 elements have been calculated in ppm or mg/l. These parameters are pH, EC, TDS, TH, Ca, Mg, Na, K HCo3,Alkalinity, Acidity, Cl-, NO3, Floride.
Tabulated form of total water parameters values is documented in an excel sheet and was run through the Quantum GIS Software where each column had relevant details such as sample number, latitude, longitudes, and values of elements as per ppm or mg/L.
The results of each water parameter were then spread on the raster image based on the variable sample location. Attribute values are segregated by using the reclassification method with equal distance.
III. STATISTICAL ANALYSIS
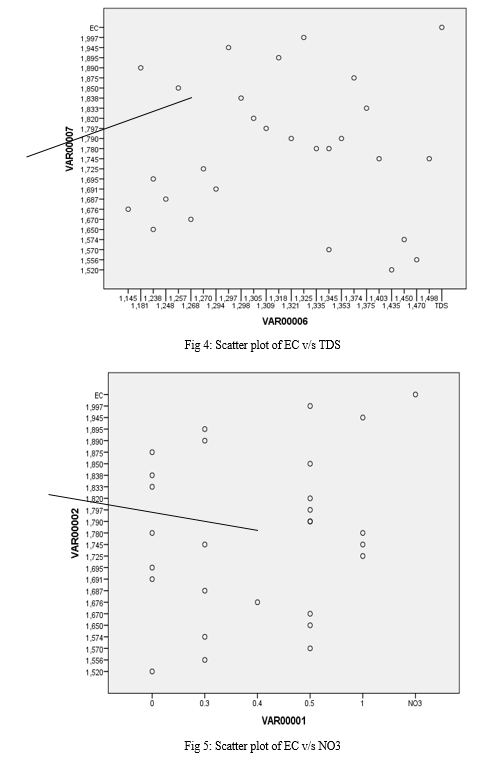
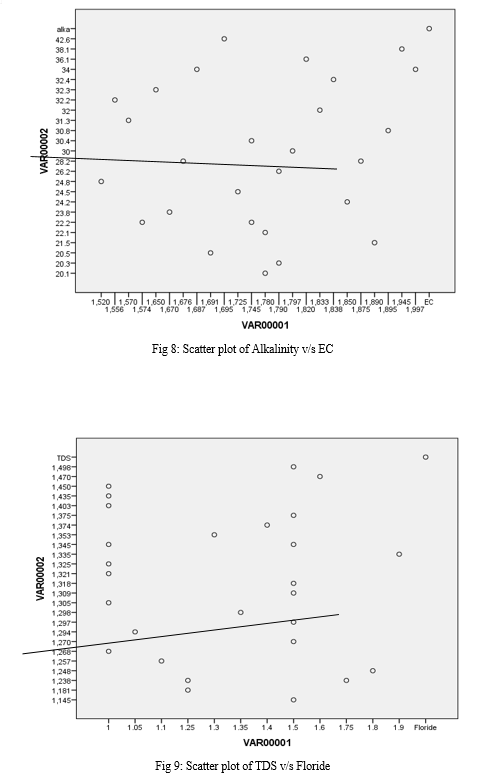
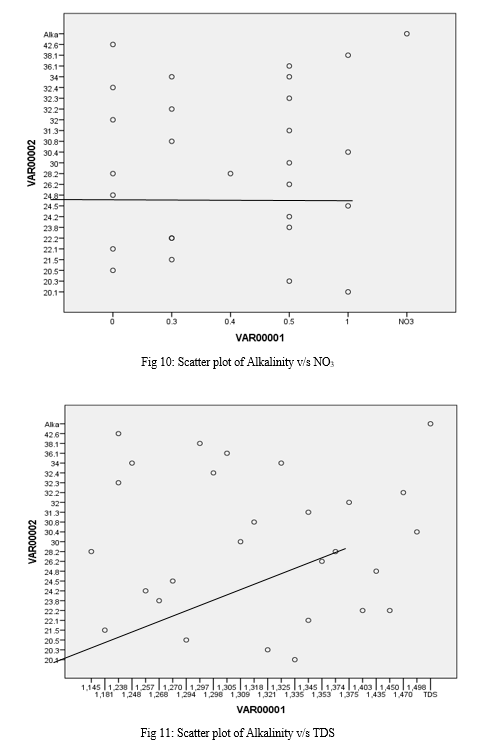
The statistical analyses and Water quality index were applied to further comprehend the geochemical processes and anthropogenic influences. It comprises a Hierarchical cluster analysis, Pearson statistical correlation matrix and Scatter plots. The hierarchical cluster analysis usually uses a dendrogram, showing data in a possible comparable group of variables or associations, known as Q mode cluster. Graphical representation of scatter plots shows a correlation between two elements in geochemical data of highly positive and negative bonding. A pair of elements correlated with each other and formed a scatter plot. Scatter plots have a group of density and active simultaneous variables. Positive graphs indicate an increase in the concentration of one element with respect to another element. Highly positive and highly negative plots are a good indication to understand the dominance of water elements in groundwater.


IV. RESULTS AND DISCUSSION
The pH of water is a very important indication of its quality and provides important piece of information regarding types of geochemical equilibrium. The pH of the analyzed samples varies from 6.47 to 8.03 witha mean value of 7.09 in the study area, indicating alkaline nature. pH values of all the collected samples are well within the safe limit as prescribed by WHO (1990). Though pH has no direct effect on human health, all biochemical reactions are sensitive to variation of pH . The electric conductivity (EC) values for study area ranges from 235 to 2118 µS/cm at 25 °C with an average value of 595.24 µS/cm. The higher EC may be attributed to high salinity and high mineral content at the sampling site. It depends upon temperature, concentration and type of ions present in groundwater and also concentration of EC increases with the concentration of TDS. Total dissolved solids (TDS) in water comprise all inorganic salts including carbonate, bicarbonate, chloride, fluoride, sulfate, phosphate, nitrate, calcium.
Magnesium, sodium, and potassium (Sawyer 1994). Total dissolved solids of the ground water, in the study area, vary from 150 to 1355 mg/L with an average of 377.82 mg/L. The groundwater of the study area has been classifed based on TDS values, according to the procedure suggested by US Geological Survey 2000. It is clear from Table 4 that 94.11% of groundwater samples fall into freshwater category, whereas 5.88% of groundwater.
Samples fall into slightly saline category (Table 4). The acceptable limit of total hardness (TH) (as CaCO3) is 300 mg/L, which can be extended up to 600 mg/L in case of non-availability of any alternate water source (WHO 1990). The total hardness as CaCO3 equivalents in the study area ranges from 35 to 850 mg/L with mean value of 197.35 mg/L (Tables 2, 3). Sawyer et al. (2003) classified groundwater is given in Table 4, according to which 35.29% of samples belongs to moderate–hard type, and 38.23 and 17.64% of water belong to hard and very hard type, respectively.


V. ACKNOWLEDGEMENTS
We express our thanks to Ch. Gopal Reddy, Secretary, CMRGI, Major .Dr. V.A Narayana, Principal and Dr. A. Krishna Rao HOD, CMR College of Engineering and Technology Hyderabad, for help and encouragement to publish this paper.
- Compliance with Ethical Standards Conflict of Interest: The authors declare that they have no conflict of interest.
- Ethical Approval: The authors declare that this article does not contain any studies with human participants or animals.
- Informed Consent: This type of study does not require formal consent
Conclusion
Groundwater is an important water resource in southern India, because of low precipitation. Groundwater quality and quantity have witnessed a decline in the area of our research. This is due to excessive extraction, anthropogenic activity, and geological conditions of the region. According to the water quality index map, in the Medchal Mandal. Physico-chemical characterization of groundwater samples are taken from Dundigal town. 23 groundwater samples were collected from different parts of Dindigul town and analyzed for pH, EC, TDS, CO3, HCO3, Cl, Na, K, Ca, Mg, NO3, SO4, PO4, F, DO, BOD and COD using standard procedures. The values of all the groundwater samples are compared with the standard permissible value. Fluoride, dissolved oxygen, biochemical oxygen demand and chemical oxygen demand are exceeding the permissible limit in most of the groundwater samples. From the obtained results, it is suggested to monitor the groundwater quality and assess periodically in this study area to prevent the further contamination.
References
[1] Liou SM, Lo SL, Wang SH (2004) A generalized water quality index for Taiwan. Environ Monit Assess 96:32–35. [2] Prasad P. Chaurasia M., Sohony R. A., Gupta I. and Kumar R. (2013).Water quality analysis of surface water: A web approach. CSIR-NEERI,Environmental Monitoring and Assessment, 18:5987– 5992. [3] Musini Venkateshwarlu, Suresh Merugu, T. Rohini Reddy.(2020).“Information System Used to Study on Effect of Groundwater Quality”.Advances in Cybernetics, Cognition, and Machine Learning for Communication Technologies pp 531-542. https://doi.org/10.1007/978 981-15-3125-5_53. [4] M. Venkateshwarlu, K.Rajagopal and Y.S.Reddy (2020), Geochemical studies on the Groundwater of kistapur village, Medchal district, Telangana. Indian J. Environmental protection, Vol.40.No.8, PP.887-891 [5] M Bagyaraj, T Ramkumar, G Gnanachandrasamy, (2013), A GIS Analysis for Assessing Groundwater Quality in Kodaikanal Hill, Western Ghats, Southern India. Inventi Rapid: Water & Environment, Vol. 2013(4), pp-1-9. [6] Venkateshwarlu, M., Merugu, S. ., & Asari, V. K. (2021). Computational Assessment of Ion Distribution On Applying Multivariate Analysis Using Geographic Information Systems. Helix- The Scientific Explorer | Peer Reviewed Bimonthly International Journal, 11(6), 32-37.Retrieved from https://helixscientific.pub/index.php/home/article/view/380. [7] Venkateshwarlu M, Reddy MN (2017) .A case study on assessment of groundwater quality parameters in and around Lambapur area, Nalgonda District, Telangana state. Int J Civ Eng Technol (IJCIET) 8(7):563–566. [8] BIS (Bureau of Indian Standards) 10500 (1991). Indian Standard drink- ing water specification (1st rev., pp 1–8). [9] WHO (1983). Guidelines for drinking water quality. Geneva: world Health Organization. [10] Sawyer CN (1994) Chemistry. McGraw Hill, New York, pp 103–104. [11] US Geological Survey (2000) Classification of natural ponds and lakes. US Department of the Interior, US Geological Survey, Washington, DC. [12] Al-Harbi M, AL-Ruwaih FM, Alsulaili A (2014) Statistical and ana- lytical evaluation of groundwater quality in Al-Rawdhatain field. Environ Prog Sustain 33:895–904. [13] Umar M, Waseem A, Sabir MA, Kassi AM, Khan AS (2013) The impact of the geology of recharge areas on groundwater quality: a case study of Zhob River Basin, Pakistan. Clean: Soil, Air, Water 41:119–12. [14] Saikrishna, K., Purushotham, D., Sunitha, and V. et al (2023). Geochemical processes of groundwater for drinking purposes in Dharwar craton of Mallampalli area, Telangana, South India. Int J Energ Water Res 7, 15–28. https://doi.org/10.1007/s42108-021-00146-0. [15] Saxena VK, Ahmed S (2001) Dissolution of fluoride in groundwater: a water-rock interaction study. Environ Geol 40(8):1084–1087. [16] Venkatayogi S (2015) Geochemistry of fluoride bearing groundwater in parts of Telangana State, India. J Water Resour Hydraul Eng 4(4):380–387. [17] Venkateshwarlu, M., Merugu, S. ., & Asari, V. K. (2021). Computational Assessment of Ion Distribution On Applying Multivariate Analysis Using Geographic Information Systems. Helix- The Scientific Explorer | Peer Reviewed Bimonthly International Journal, 11(6), 32-37.Retrieved from https://helixscientific.pub/index.php/home/article/view/380. [18] Venkateshwarlu M, Rasheed MA, Reddy UVB, Kumar AK (2014) Assessment of groundwater quality in and around Miryalaguda area, Nalgonda district of Andhra Pradesh. Int J Plant Animal Environ Sci 4(2):259–26
Copyright
Copyright © 2024 Musini Venkateshwarlu, Padamata Yeswanth Babu, Dosilla Jashuva, K. Sravya, K Prudvi Raj . This is an open access article distributed under the Creative Commons Attribution License, which permits unrestricted use, distribution, and reproduction in any medium, provided the original work is properly cited.

Download Paper
Paper Id : IJRASET59521
Publish Date : 2024-03-28
ISSN : 2321-9653
Publisher Name : IJRASET
DOI Link : Click Here
 Submit Paper Online

