Ijraset Journal For Research in Applied Science and Engineering Technology
- Home / Ijraset
- On This Page
- Abstract
- Introduction
- Conclusion
- References
- Copyright
Pushover Analysis of G+20 RCC Structure with Horizontal Irregularity
Authors: Vinod G Vawadra, Prof. Roshni John
DOI Link: https://doi.org/10.22214/ijraset.2024.63415
Certificate: View Certificate
Abstract
In the last decade, four devastating earthquakes in the world have occurred in India, and low to mild intensities earthquakes are shaking our land frequently. It has raised questions about the adequacy of framed structures to resist strong motions since many buildings suffered great damage or collapsed. Therefore, existing reinforced concrete buildings can be analyzed to determine the strength or capacity to resist seismic loads. Performance-based design is used to assess the performance level of buildings subjected to earthquakes. Push-over analysis is one of the seismic methods to determine the performance level of the building. On the basis of pushover analysis whether damage occurs at member or structure level can be identified. Fiber-reinforced polymer wrapping is a composite material made of a polymer matrix reinforced with fibers. It has good ductility strength which can work effectively in earthquake-prone areas. In the present study, 20 story structures with horizontal irregularity have been analyzed with aramid fiber-reinforced polymer, glass fiber-reinforced polymer, and carbon fiber-reinforced polymer with the Pushover analysis method as per ATC- 40 [5]. The analysis is carried out for seismic Zone III with hard soil conditions. The parameters considered for the study are pushover curve, target displacement, story shear, time period, maximum story displacement, and story drift based on pushover analysis separately to find out the most suitable configuration of fiber-reinforced polymer.
Introduction
I. INTRODUCTION
An earthquake is the shaking of the earth’s surface that follows a sudden release of energy in the crust. It creates the random ground motion in any directions, which emerges from the epicenter, which causes the surface to vibrate. RCC structures are at risk of collapse due to the earthquake. Due to this, there is a large number of deaths, injuries, and economic losses. Mostly buildings or high-rise structure get affected due to by lateral movements caused by earthquake which ultimately disturb the stability of the structure, leading to collapse sideways. Since buildings are normally constructed to resist gravity loads, many conventional systems of construction are not much resistant to lateral forces. Strengthening of such buildings has been proved as a more economical and viable immediate shelter solution rather than replacement of buildings. Thus, to analyse the performance of RCC framed buildings under future unpredictable earthquakes, a pushover analysis has been conducted. The major challenge in performance-based engineering is to develop simple, yet accurate methods for estimating seismic demand on structures considering their inelastic behavior: the use of pushover analyses cannot be avoided over complex, impossible for widespread professional use, nonlinear time-history methods. The procedure consists of applying loads until the weak link in the structure is found and then revising the model to incorporate the changes in the structure caused by the weak link. In second iteration the structure is “pushed” again until the second weak link is discovered. This process continues until the whole structure reaches its yielding point.
II. PUSHOVER ANALYSIS
- Seismic analysis is a subset of structural analysis that seeks to determine the response of structures to earthquakes. It's a crucial process, especially for regions prone to seismic activities. Ensuring that structures can withstand the forces of an earthquake can save lives and reduce the economic impact of a seismic event.
- Non-linear Static Seismic analysis can be done by pushover method.
- Pushover analysis is a series of incremental analyses carried out to build up a capacity curve for the building. Fig2.1 illustrates pushover analysis. This procedure needs the execution of a nonlinear static analysis of structure that allows monitoring of progressive yielding of the structure component. The building is subjected to a lateral load. The load magnitude increases until the building reaches the target displacement. This target displacement is used to represent the top displacement when the building is subjected to design-level seismic criteria.
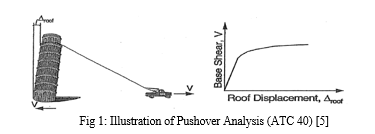
4. Pushover analysis produces a pushover curve or capacity curve that presents a relationship between base shear (V) and roof displacement (?). The Pushover curve depends on the deformation and strength capacities of the structure and describes how the structure act beyond the elastic limit.
5. Structural response to ground motion during an earthquake cannot be accurately predicted due to the complexity of the structural properties and ground motion parameters. In pushover analysis, a set of lateral displacements is used directly as a design condition. The displacement is an estimate of the maximum expected response of the structure during seismic activity. Once pushover analysis is defined, the performance level can be determined using demand displacement. The performance verifies that the structure is adequate to the acceptable limits of performance level.
6. Recently, there are some codes such as ATC-40 [5], FEMA 256, and FEMA 440 adopted standards and guidance provisions regarding the assessment of existing structures. Some programs are also developed for pushover analysis such as ETABS and Staad.Pro.
III. CAPACITY SPECTRUM METHOD
Building performance level can be determined by target displacement using the capacity spectrum method (ATC 40) [5]. Using capacity spectrum method, we get a graphical comparison between the the seismic demand and structure capacity. Response spectrum curve represents the seismic demand and pushover curve represents the horizontal resisting capacity of the structure. The capacity spectrum method, which is given in Figure 4, is started by producing a force-displacement curve that considers inelastic conditions. The obtained result is then plotted together into ADRS format (Acceleration Displacement Response Spectrum). Demand is also converted into ADRS format so that the capacity curve and demand curve are in the same format.
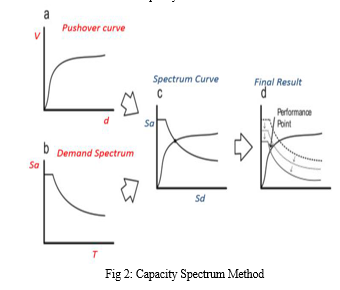
In Capacity spectrum method we get performance point by superimposing the demand spectrum on the capacity curve into spectral coordinates or ADRS format. The capacity spectrum method has been built in the ETABS program.
Table 3.1: Performance levels of buildings as per ATC-40 [5].
|
Operational |
Very light damage, no permanent drift, structure retains original strength and stiffness, all systems are normal. |
|
Immediate Occupancy |
Light damage, no permanent drift, structure retains original strength and stiffness, elevator can be restarted, Fire protection operable. |
|
Life Safety |
Moderate damage, some permanent drift, some residual strength and stiffness left in all stories, damage to partition, building may be beyond economical repair. |
|
Collapse Prevention |
Severe damage, large displacement, little residual stiffness and strength but loading bearing column and wall function, building is near collapse. |
IV. FIBER REINFORCED POLYMER
Fiber-reinforced polymer is a composite material made of a polymer matrix reinforced with fibers. Mostly used fibers are Carbon, Glass, and Aramid. Ultimate Strength and Elastic Modulus of these FRP’s are really higher than any other material which ultimately increases the ductility of structure without increasing much dead weight of the existing structure.
A. Application of Fiber Reinforced Polymer
FRP’s exceptional properties make it an ideal choice for structural strengthening structure. Here are some of the key advantages and applications of FRP in the construction industry.
- FRP can be externally bonded to concrete, steel, or timber structures to enhance their load-bearing capacity. This method is mostly used to reinforce buildings, bridges, and other infrastructure that may have deteriorated over a period of time.
- FRP is highly effective in increasing the flexural capacity of structural elements such as beams and slabs bottom and sides of these elements to provide additional strength.
- Columns in buildings and bridges can be wrapped with FRP sheets to increase their axial load-carrying capacity and confinement.
- FRP can be used to repair and prevent the propagation of cracks in concrete structures. It helps maintain the durability and structural integrity of the deteriorated components.
- FRP is inherently resistant to corrosion, making it an excellent choice for structures exposed to harsh environmental conditions, such as marine or industrial environments.
V. DESCRIPTION OF BUILDING
Table 5.1. Configuration of models
|
Model Number |
Type of Configuration |
|
Model 1 |
RCC without FRP |
|
Model 2 |
RCC with AFRP |
|
Model 3 |
RCC with GFRP |
|
Model 4 |
RCC with CFRP |
Table 5.2. Input data for modeling
|
Height of building |
61.5 m |
|
Slab thickness |
150 mm |
|
Beam size |
230 X 600 mm |
|
230 X 325 mm |
|
|
230 X 450 mm |
|
|
Shear Wall |
300 mm |
|
Floor to floor height |
2.9 m |
Table 5.3. Material properties of structure
|
Grade of Concrete |
M30 |
|
Grade of Steel |
Fe500 |
|
Density of Reinforced Concrete |
25 kN/m3 |
|
Density of light weight block work |
10 kN/m3 |
|
Density of water |
10 kN/m3 |
Table 5.4. Seismic data for structure
|
Seismic parameter (as per IS 1893 part -1 2016) [4] |
|
|
Seismic Zone (Z) |
III |
|
Zone Factor |
0.16 |
|
Importance Factor (From Table 8) |
1.2 |
|
Soil category |
I |
|
Response reduction factor (R) (From Table 9) |
4 |
Table 5.5. Loading on structure
|
Loading (as per IS: 875: Part 2: 2018) [3] |
|
|
Live load |
Floor = 2 kN/m2. Terrace Floor = 3 kN/m2. |
|
Floor finish load |
Floor = 1.5 kN/m2. Terrace floor = 3 kN/m2. |
|
Wall load |
0.23*3*10 = 6.9 kN. |
Table 5.6. Wind data for structure
|
Loading (as per IS: 875: Part 2: 2018) [3] |
|
|
Wind speed |
44 m/s |
|
Terrain category |
3 |
Table 5.7. Physical and mechanical properties of different FRPs from Gudonis et al. (2013) [6].
|
Properties |
CFRP |
GFRP |
AFRP |
|
Elastic Modulus (Gpa) |
250 |
72.4 |
62 |
|
Fabric Weight (kg/m3) |
1700 |
2500 |
1440 |
|
Ultimate Strength (Mpa) |
3700 |
3450 |
2760 |
|
Poisson ratio |
0.2 |
0.22 |
0.35 |
|
Coefficient of thermal expansion 10–6/°C |
1.2 |
5 |
2 |
Conclusion
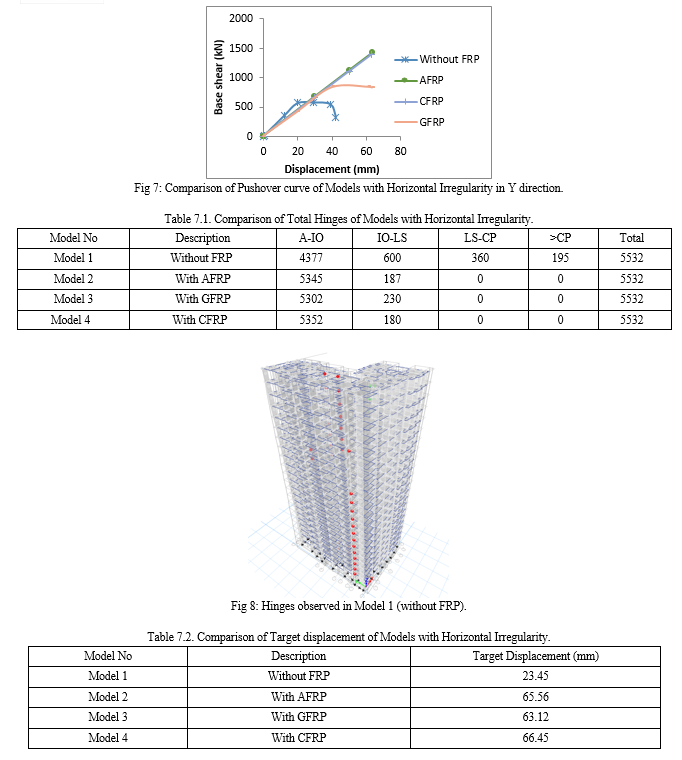
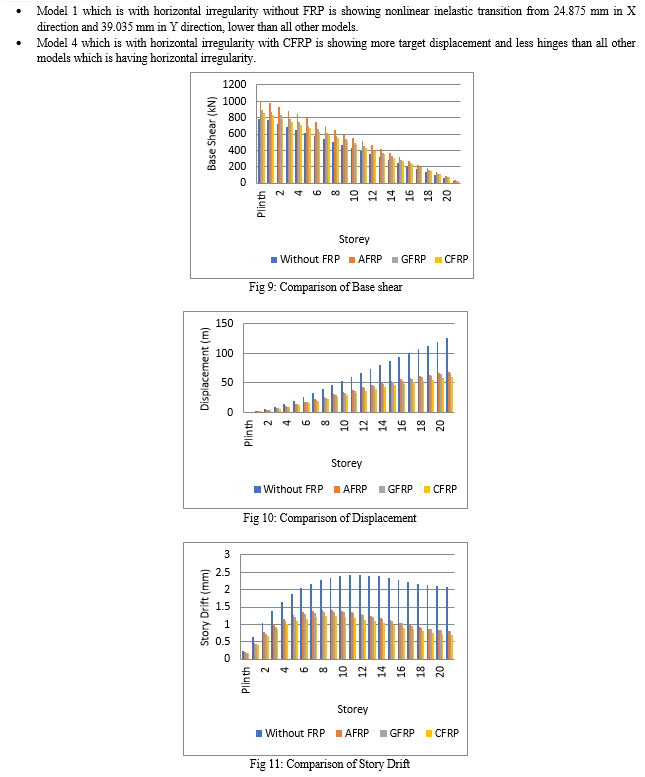
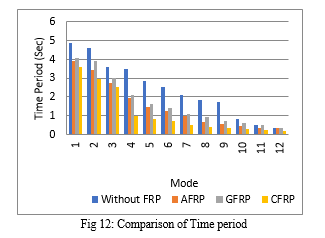
1) Model 4 which is RCC structure with CFRP is showing more target displacement and less hinges among all the models having horizontal irregularity. 2) Model 2 which is RCC structure with AFRP is showing more storey shear among all the models having horizontal irregularity. 3) Model 4 which is RCC structure with carbon fibre reinforced polymer (CFRP) shows 236.53% less storey displacement and 195.77% less storey drift in X direction and wrt to Model 1 which is without FRP having horizontal irregularity. 4) Model 4 which is RCC structure with CFRP is showing less time period among all the models having horizontal irregularity. 5) Models with CFRP are showing better results in horizontal irregularity. 6) Performance level of models without FRP is at collapse prevention level and all models with FRP are at immediate occupancy level.
References
[1] IS 456: 2000, “Indian Standard Code of Plain and reinforced Concrete-Code of Practice”, Bureau of Indian Standards, New Delhi. [2] IS: 875: Part 1: 2018, “Indian Standard Code of Practice for Design Loads (Other Than Earthquake) For Buildings and Structures”, Part 1: Dead Loads – Unit Weights of Building Materials and Stored Materials. [3] IS: 875: Part 2: 2018, “Code of Practice for Design Loads (Other Than Earthquake) For Buildings and Structures”, Part 2: Imposed Loads. [4] IS: 1893: Part 1: 2016, “Criteria for earthquake resistant design of structure” Bureau of Indian Standards, New Delhi. [5] Applied Technology Council (ATC)-40, “Seismic evaluation and retrofit of concrete buildings” Volume 1, Nov 1996. [6] Eugenijus Gudonis, Aleksandr K. Arnautov, Edgaras Timinskas, Viktor Gribniak, Gintaris Kaklauskas, Vytautas Tamul?nas, “FRP Reinforcement for Concrete Structures: State-of-the-art review of Application and Design” Taylor and Francis Group, 4, May 2013. [7] Dhiraj D. Ahiwale, Rushikesh R. Khartode, Kaustubh V. Raut, “Seismic Response for Rc Frames on Sloping Ground using Pushover Analysis” Journal of Structural Engineering and Management (JoSEM), vol: 07, Issue: 02, 2020
Copyright
Copyright © 2024 Vinod G Vawadra, Prof. Roshni John. This is an open access article distributed under the Creative Commons Attribution License, which permits unrestricted use, distribution, and reproduction in any medium, provided the original work is properly cited.

Download Paper
Paper Id : IJRASET63415
Publish Date : 2024-06-22
ISSN : 2321-9653
Publisher Name : IJRASET
DOI Link : Click Here
 Submit Paper Online

