Ijraset Journal For Research in Applied Science and Engineering Technology
- Home / Ijraset
- On This Page
- Abstract
- Introduction
- Conclusion
- References
- Copyright
Assessment of RC Frame Structure under Different Seismic Condition
Authors: Ankita Janardan, Srishti Verma
DOI Link: https://doi.org/10.22214/ijraset.2024.61930
Certificate: View Certificate
Abstract
Structures in seismic zones are especially prone to collapse during significant ground motion occurrences. This susceptibility is sometimes linked to flaws in seismic design principles, notably in the selection of suitable structural systems. Equivalent static analysis, which is often employed in seismic design, may not accurately account for the structure\'s strength and stiffness. As a result, ground floor columns may become highly reinforced, thereby lowering ductility, and causing poor performance. This thesis offers a parametric study of an RC frame structure developed for various seismic zones. The finite element software is used to model the structure to investigate performance levels. Pushover analysis was performed to determine the structure\'s seismic capacity and behavior under various seismic conditions. Parametric research employing RC Frames with demand variation was done to investigate the structure\'s behavior in different seismicity zones across the country.
Introduction
I. INTRODUCTION
Reinforced concrete (RC) structures, constructed according to contemporary building regulations as moment-resisting space frames, shear walls, or combinations thereof, are intended to withstand large earthquake stresses by flexibly deforming into the inelastic region and releasing energy via stable hysteretic behavior. Given that inelastic deformations tend to concentrate in certain important parts of the structure, forecasting its mechanical response during earthquakes requires trustworthy analytical models and a variety of analysis approaches. Accurate analytical methodologies are essential for understanding the structure's behavior. For seismic performance evaluation, a structural study of the structure's mathematical model is necessary to estimate force and displacement demands in various structural components.
There are several elastic and inelastic analytic methods available for predicting the seismic performance of structures. Various elastic analysis methods, such as the code static lateral force process, the code dynamic procedure, and the demand/capacity ratio (DCR) procedure, are used to analyse the force demand on structural components in relation to their capabilities during earthquakes. These approaches, known as force-based procedures, are predicated on the assumption that the structural reaction is elastic. In the code static lateral force technique, structures are exposed to scaled-down lateral forces obtained from elastic response spectra, with the assumption that real strength is greater than design strength. The code dynamic process involves elastic dynamic analysis, which considers the response spectrum or time history analysis. The DCR technique compares force actions and capabilities while accounting for gravity effects.
Elastic approaches anticipate structural capacity, but they may overlook weaknesses and fail to account for force redistribution. As a result, displacement-based approaches, which focus on inelastic deformations and nonlinear analysis, have evolved to improve seismic performance by explicitly considering seismic demands and capacity. Structures experience considerable inelastic deformation during powerful earthquakes, necessitating inelastic analytical approaches to appropriately measure their performance. These approaches, which include inelastic time history analysis and inelastic static analysis (pushover analysis), aid in the identification of failure mechanisms and probable progressive collapse. Inelastic time history analysis is the most precise approach, but it is restricted by its sensitivity to modeling and ground motion features, necessitating correct representation of cyclic load deformation and the availability of a wide range of ground motion recordings. Furthermore, its computing requirements render it unsuitable for seismic performance evaluation.
In contrast, inelastic static analysis, such as pushover analysis, is recommended because it is simple and directly incorporates nonlinear material behavior. Inelastic static analysis methods include the Capacity Spectrum Method, the Displacement Coefficient Method, and the Secant Method.
Objective of the present study is to study principles, procedures, and applications of pushover analysis in RC frame structures and to evaluate structural performance through systematic pushover analysis implementation.
II. BACKGROUND OF THE STUDY
The literature review is a crucial initial phase in research, shaping the study's objectives. Researchers focus on pushover analysis, a method assessing structures' seismic performance via gradual lateral loading. They examine various studies and methodologies related to pushover analysis, exploring approaches addressing lateral load patterns and mode shape effects. This review reveals the evolution of techniques aimed at enhancing pushover analysis accuracy. By evaluating prior research, researchers identify strengths, weaknesses, and areas for improvement, informing their study objectives and guiding its direction.
Fajfar et al. (1989) used the uniform and inverted triangular load distributions to perform nonlinear static analyses of the structure. The pushover curves were compared to the dynamic experimental and analytical results showing considerable differences in their shapes. It was noted that the inverted triangular distribution was conservative in estimating base shear demands due to the effect of higher modes.
Baik et al. (1988) proposed a simplified analysis model for the seismic response prediction of steel frames that was based on the pushover analysis concept but included cumulative damage parameters using the Park-Ang damage model (Park et al. 1985). It was noted, that the prediction of damage using the equivalent SDOF model ‘deteriorated’ with increasing structure height, and in the presence of irregularities. The authors suggested though that the ESDOF nonlinear model could provide better estimation of damage parameters than an elastic multi-storey model.
Kilar and Fajfar (1996) applied the N2 method to the standard seven-storey reinforced concrete building tested in Tsukuba, Japan in the joint U.S. – Japan collaboration, which had been tackled in previous studies, Fajfar et al. (1988), and Gaspersic et al. (1992). The conclusions drawn from the study were that for structures which vibrated primarily in the fundamental mode the method could provide reliable estimates of global seismic demand. In most cases the demands at the local level in terms of deformation, dissipated energy and damage indices could be adequate to be used in practice. The method could detect weaknesses such as storey mechanisms or excessive demands.
Kunnath et al. (1996) performed a seismic evaluation of a 4-storey reinforced concrete building subjected to five strong ground motions. The prediction of displacements from pushover analyses and nonlinear time-history analyses showed fairly good agreement – with a tendency for pushover analyses to be on the unconservative side. The authors recognized the considerable differences in the time and computational effort required, for the types of analyses. In terms of time management pushover analysis appeared to be superior.
Tso and Moghadam (1998) proposed an extension of pushover analysis that included torsional effects, to compute the seismic response of two 7-storey reinforced concrete structures; one being symmetrical and the other asymmetrical. The method included the use of 3D elastic dynamic analyses of the models to provide the maximum target displacements for the lateral-load resisting elements. The force distributions across the structures derived from the dynamic analyses were used as static force distributions to carry-out a series of 2D pushover analyses. The results showed good estimates of floor displacements, inter-storey drifts and ductility demands for both types of structures.
Kilar and Fajfar (1997) tested the effectiveness of their proposed method (Kilar et al. 1996) on an asymmetric 21-storey reinforced concrete structural wall building. Some additional results for the symmetric and asymmetric 7-storey structures discussed in Kilar et al. (1996) were also provided.
Kunnath and Gupta (1999a) introduced a spectrum-compatible pushover analysis method. The main differences between the conventional pushover analysis and the proposed method were that the latter included site-specific ground motion characteristics and secondly the applied load pattern changed depending on the instantaneous dynamic properties of the system. The proposed method was evaluated using a 14-storey moment-resisting frame.
Kunnath and Gupta (1999b) compared the responses of an 8-storey building derived from the spectra-compatible pushover method and the conventional pushover method. The superiority of the spectra-compatible method to the conventional pushover method for capturing upper-storey demands was pointed out, when results were compared with nonlinear dynamic analysis results.
Albanesi et al. (2000) proposed the use of variable-damping response spectra in the pushover method proposed in ATC-40 document to evaluate seismic response of nonlinear structures in terms of the maximum displacement and acceleration, given the structural initial elastic period, the yielding acceleration, and the hardening ratio in the plastic range.
Mwafy and Elnashai (2001) studied the seismic response of twelve reinforced concrete buildings using nonlinear static and nonlinear dynamic analyses. The buildings were divided into three general groups: four 8-storey irregular frames, four 12-storey regular frames and four 8-storey dual frame-wall structures. It was found out that in all cases the responses of the buildings were sensitive to the shape of the lateral load pattern. Also, the multi-mode pattern did not appear to provide enhanced results with respect to the other conventional load patterns. The latter conclusion confirmed findings of Krawinkler et al. (1998).
Goel and Chopra (2004) carried out an evaluation study of Modal and FEMA pushover procedures on three 9-storey and three 20-storey buildings subjected to twenty ground motions. The ‘exact’ dynamic response of the buildings was computed using nonlinear time-history analyses. For the FEMA pushover procedure, the authors used four different load patterns and for the Modal Pushover method the first three modes of vibration were considered. The results showed that the FEMA load distributions underestimated story drifts by up to 75% and failed to estimate reasonably the plastic rotations at the upper storeys for all buildings. Mehmet et al. (2006) explained that due to its simplicity of Push over analysis, the structural engineering profession has been using the nonlinear static procedure or pushover analysis. Pushover analysis is carried out for different nonlinear hinge properties available in some programs based on the FEMA-356 and ATC-40 guidelines and he pointed out that Plastic hinge length (Lp) has considerable effects on the displacement capacity of the frames. The orientation and the axial load level of the columns cannot be considered properly by the default-hinge properties (Program Default). Shuraim et al. (2007) studied the nonlinear static analytical procedure (Pushover) as introduced by ATC-40 for the evaluation of existing design of a new reinforced concrete frame. Potential structural deficiencies in reinforced concrete frame, when subjected to a moderate seismic loading, were estimated by the pushover approaches. In this method the design was evaluated by redesigning under selected seismic combination to show which members would require additional reinforcement. Most columns required significant additional reinforcement, indicating their vulnerability when subjected to seismic forces. The nonlinear pushover procedure shows that the frame can withstand the presumed seismic force with some significant yielding at all beams and one column.
III. METHODOLOGY
Modeling of an eight-story RC frame structure is detailed in this chapter, encompassing considerations of computational models, basic assumptions, and building geometry. Precise representation of nonlinear properties in structural elements is crucial for accurate nonlinear analysis, where frame elements are depicted with nonlinear flexural hinges. The chapter concludes by outlining significant parameters employed for nonlinear seismic evaluation of the structure.
A. Computational Model
When modeling a structure, the load-bearing components are assembled to precisely reflect mass distribution, strength, stiffness, and deformability. A complete study requires that the model be consistent with the material attributes and structural features under consideration. The current study focuses on detailing the careful modeling of material properties and structural elements used, reflecting a careful consideration of properties such as material strength, stiffness, and deformability to create a robust and reliable representation of the structure for analysis.
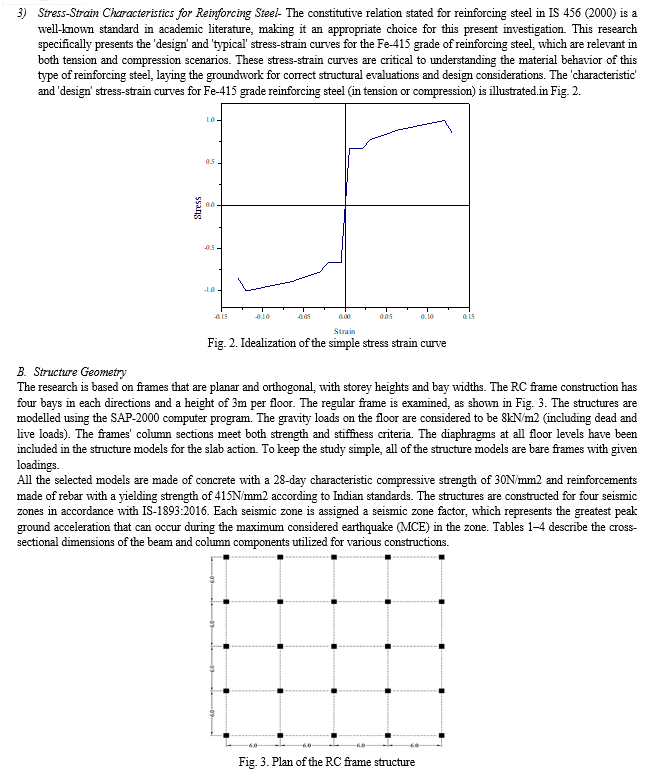
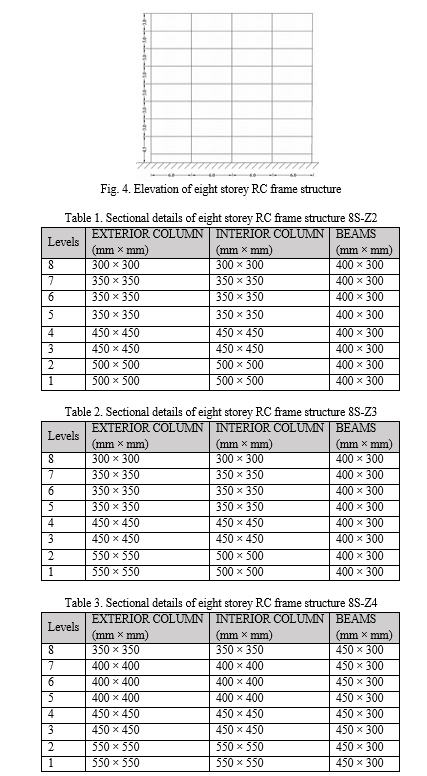
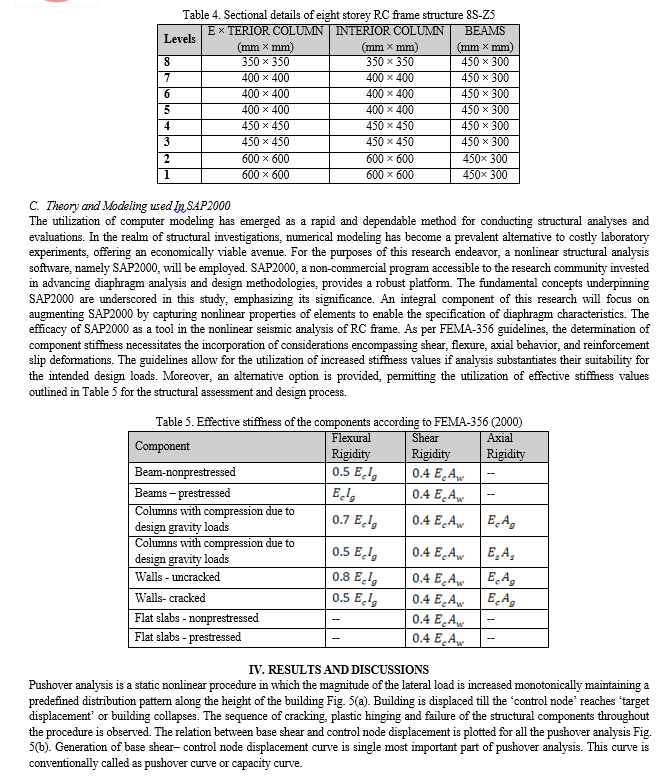
1) Material Properties - M-30 grade of concrete and Fe-415 grade of reinforcing steel are used for all the frame models used in this study. Elastic material properties of these materials are taken as per Indian Standard IS 456 (2000).
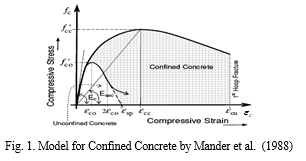
2) Stress-Strain Characteristics for Concrete - The stress-strain curve of concrete in compression forms the basis for analysis of any reinforced concrete section. The characteristic and design stress-strain curves specified in most of design codes (IS 456: 2000) do not truly reflect the actual stress-strain behavior in the post-peak region, as (for convenience in calculations) it assumes a constant stress in this region (strains between 0.002 and 0.0035). In reality, as evidenced by experimental testing, the post-peak behavior is characterized by a descending branch, which is attributed to ‘softening’ and micro-cracking in the concrete. Also, models as per these codes do not account for strength enhancement and ductility due to confinement. However, the stress-strain relation specified in ACI 318M-02 consider some of the important features from actual behavior. The model is a modified version of Mander’s model (Mander et al. 1988) where a single equation can generate the stress fc corresponding to any given strain Fig. 1 shows a typical plot of stress-strain characteristics for M-30 grade of concrete as per Mander’s model.
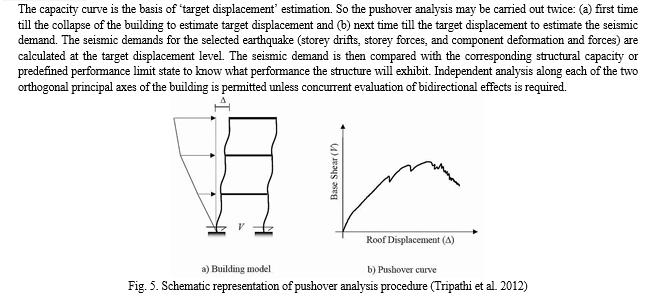
The analysis results are sensitive to the selection of the control node and selection of lateral load pattern. In general, the center of mass location at the roof of the building is considered as control node. For selecting lateral load pattern in pushover analysis, a set of guidelines as per FEMA 356 (2000) is explained. The lateral load generally applied in both positive and negative directions in combination with gravity load (dead load and a portion of live load) to study the actual behavior.
The process involved in examining the RC frames through pushover analysis was comprehensive and insightful. It included a thorough investigation that entailed plotting data, comparing inter-storey drifts, understanding how hinges form within the structures, and constructing capacity curves to visualize structural behavior under seismic forces. These analyses collectively revealed notable differences in how the structures performed across various seismic zones, providing valuable insights into their seismic resilience and performance levels.
A. Capacity Curve
One of the most important steps in post-processing of nonlinear structural analysis is to achieve the capacity curve (base shear versus top displacement). According to ATC-40 (1996), capacity curve is plot of total base shear on the structure against the lateral deflection of the roof of the structure. It is often called pushover curve. The capacity curve can reveal important features of structural response, includes yield displacement, total strength and initial stiffness estimation of the structure. This curve represents the capacity of the structure uniquely and independent of the seismic demand. When earthquake displaces the structure laterally, its response is plotted on this curve. A point on curve specifically defines the state of damage to the structure. The capacity curve of different models have been shown and described below.
In capacity curves several performance levels have been shown. The description of the performance levels are as follows:
P – Represents the performance point of the structure under given seismic demand.
A – Represents the Immediate Occupancy Level (IO) of the structure.
B – Represents the Life Safety Level (LS) of the structure.
C – Represents the Collapse Prevention Level (CP) of the structure.
Fig. 6 shows the capacity curve of the eight storey RC frame structures along with the variation in the performance for the low seismic demand i.e. for zone-II seismic demand. The capacity curves of different eight storey structures have been plotted and displacement demand and base shear capacity have been marked on capacity curve of structures for seismicity of zone-II. Figure also shows the attainment of the different performance levels of the eight storey structures.
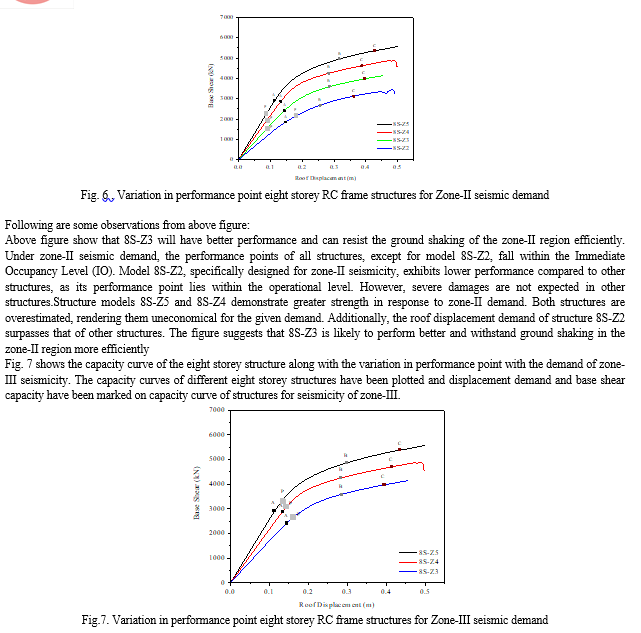
The observations from above figure are as follows: All the structures have approximated same displacement demand at the performance point but the strength of the 8S-Z3 is lesser than that of the 8S-Z4 and 8S-Z5. The structure 8S-Z3 will have greater element damages than other structures. Structure models 8S-Z5 has greater strength for zone-III seismic demand. The displacement demand of the structure 8S-Z3 is also larger than that of other structures. Above figure shows that 8S-Z4 will have better performance and can resist the ground shaking of the zone-III region efficiently.
Fig. 8 shows the capacity curve of the eight storey RC frame structure 8S-Z4 and 8S-Z5. The comparison of the performance of the both structures for zone-IV demand has been also shown in Fig. 8. The capacity curves of different eight storey structures have been plotted and displacement demand and base shear capacity have been marked on capacity curve of structures for seismicity of zone-IV.
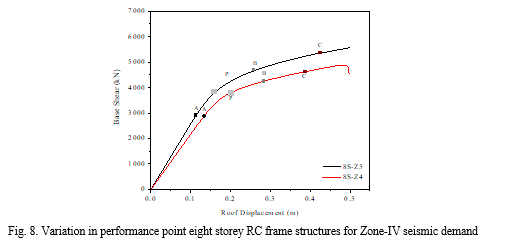
The observations from above figure are as follows: 8S-Z4 will have higher damages as compared to structure 8S-Z5. The strength of the structure 8S-Z5 is more than 8S-Z4 for zone-IV demand. 8S-Z5 will be safer and functional than that of structure 8S-Z4. The displacement demand of the structure 8S-Z4 is also larger than that of other structures. Above figure show that 8S-Z5 will have better performance and can resist the ground shaking of the zone-III region efficiently.
??????????????B. Summary
The pushover analysis of eight storey RC frame structure designed for different seismic zones have been done and the results are discussed in terms of capacity curve, roof displacement, inter-storey drift and hinge formation patterns. The structure models have been compared for the different seismicity and the performance of the structure models have been analyzed in this chapter. It has been seen that the structures designed for higher demands will perform well for lower demands and damages will be less. The structures designed for higher demand will be more stable and will have more resistance to damage for lower seismic demands.
Conclusion
The most important conclusion drawn from the study by pushover analysis of RC frame structures designed for different seismic zones is as follows: 1) Overestimation of RC Frame Structures: The eight-storey RC frame structures designed for seismic zones V and IV exhibit an overestimation when applied to zone-II seismic conditions. Surprisingly, these structures demonstrate very high-performance levels in zone-II compared to those designed specifically for zones III and II. This suggests that the design specifications intended for higher seismic zones may result in structures that are overly robust for lower seismic demands. Despite this overestimation, these structures perform relatively well in zone-II, outperforming those designed for less severe seismic conditions. 2) Need for Optimized Design: To achieve desired performance levels, an optimized design approach is essential. Designing structures that are appropriately tailored to the specific seismic demands of a given region is crucial for achieving optimal performance and ensuring structural integrity during earthquakes. 3) Higher Capacity for Better Performance: Structures with higher capacity exhibit better performance under the given seismic demand. This highlights the importance of designing structures with sufficient strength and resilience to withstand the forces exerted by seismic events. Higher capacity enables these structures to better withstand seismic forces and minimize potential damage. 4) Impact of Seismic Capacity on Structural Performance: Structures designed for lower seismic capacity are prone to early collapse and demonstrate poor performance under the corresponding seismic demand. This underscores the critical role of seismic design in ensuring structural safety and resilience. Structures inadequately designed for the expected seismic forces are at greater risk of failure, leading to potentially catastrophic consequences during earthquakes. Therefore, the study concludes that for better performance of the structures in respective seismic zones the structures should be designed for higher demands. A. Recommendations For Future Work The seismic assessment was done on medium-rise RC frame structure. More studies for other concrete and steel structures systems are recommended. As for the widespread application of irregularities in structures at height, for more comprehensive review, it is recommended to be the goal of future research. Due to the existing complexity, further research is required to achieve more comprehensive information about the selection and scaling of the ground motion.
References
[1] Albanesi, T., Nuti, C. & Vanzi, I., 2000. A simplified procedure to assess the seismic response of nonlinear structures. Earthquake Spectra, Vol. 16(4), pp.715–734. [2] Alimoradi, 2005. Fuzzy Pattern Classification of Strong Ground Motion Records. Journal of Earthquake Engineering, Vol. 9(3), pp.307–332. [3] Antoniou S., Rovithakis A. and Pinho R. ( 2016). Development and verification of a fully adaptive pushover procedure, Proceedings Twelfth European Conference on Earthquake Engineering, London, UK, pp. 822. [4] Applied Technology Council, ATC-40, 1996. Seismic Evaluation and Retrofit of Concrete Buildings, Vol. 1-2, Redwood City, California. [5] Baik S.W., Dong-Geun Lee H.K., 1988. A simlified model for seismic response prediction of steel frame structures. In Ninth Conference on Earthquake Engineering. [6] Bertero V. V., 1977. Strength and deformation capacities of buildings under extreme environments, Structural Engineering and Structural Mechanics, K. S. Pister, ed., Prentice Hall, Englewood Cliffs, NJ, pp. 211–215. [7] Bihar-Nepal earthquake. August 20, 1988, Special Publication No. 31, Geology Survey of India, Calcutta, 1993. [8] Bureau of Indian Standards, 2016. IS 1893 (Part 1): 2016 Indian Standard Criteria for Earthquake Resistant Design of Structures Part 1 General Provisions and Buildings (Fifth Revision). [9] Bracci J.M., Kunnath S.K. and Reinhorn A.M., 1997. Seismic Performance and Retrofit Evaluation of Reinforced Concrete Structures, Journal of Structural Engineering, ASCE, Vol. 123, pp. 3-10. [10] Chintanapakdee C. and Chopra A.K., 2003. Evaluation of Modal Pushover Analysis Using Generic Frames, Earthquake Engineering and Structural Dynamics, Vol. 32, pp. 417-442. [11] Chopra A.K., 1995. Dynamics of Structures-Theory and Application to Earthquake Engineering, Prentice Hall, New Jersey. [12] Chopra A.K. and Goel R.K. 2003. A Modal Pushover Analysis Procedure to Estimate Seismic Demands for Buildings: Summary and Evaluation. Proceeding of 5th National Conference on Earthquake Engineering, Istanbul. [13] Clough R.W. and Johsnton S.B., 1996. Effect of Stiffness Degradation on Earthquake Ductility Requirements, Proceedings of Japan Earthquake Engineering Symposium, Tokyo, Japan, pp. 227-231 [14] Computers and Structures Inc. (CSI), 1998. SAP2000 Three Dimensional Static and Dynamic Finite Element Analysis and Design of Structures V7.40N, Berkeley, California. [15] Faella G., 1996. Evaluation of the rc frame structures seismic response by means of nonlinear static pushover analyses. In Eleventh World Conference on Earthquake Engineering. [16] Fajfar P. and Fischinger M., 1989. Seismic demand in medium-and long-period structures. Earthquake Engineering and Structural Dynamics, Vol. 18(8), pp. 1133-1144. [17] Fajfar P., Gaspersic P. and Drobnic D. 1997. A simplified nonlinear method for seismic damage analysis of structure. Proceedings Workshop on Seismic Design Methodologies for the Next Generation of Codes, Rotterdam; Balkema. [18] Fajfar P., 2000. A Nonlinear Analysis Method for Performance-Based Seismic Design. Earthquake Spectra, Vol. 16(3), pp. 573–592. [19] FEMA-356, 2000. Prestandard and Commentary for the seismic rehabilitation of buildings. American Society of Civil Engineers (ASCE), Reston, VA. [20] Freeman S.A., Nicoletti J.P. and Tyrrell J.B., 1975. Evaluations of existing buildings for seismic risk – a case study of Puget Sound naval shipyard, Bremerton, Washington. Proceeding of the U.S. National Conference on Earthquake Engineering, pp. 113-122. [21] Freeman S.A., 1978. Prediction of Response of Concrete Buildings to Severe Earthquake Motion. Douglas McHenry International Symposium on Concrete and Concrete Structures, SP-55, American Concrete Institute, Detroit, Michigan, pp. 589-605. [22] Gaspersic P., Fajfar P. and Fischinger M., 1992. An approximate method for seismic damage analysis of buildings. Proc. 10th world conference in earthquake engineering, Balkema, Rotterdam, Vol. 7, pp. 3921-3926. [23] Girgin K. and Dar?lmaz K., 2007. Seismic Response of Infilled Framed Buildings Using Pushover Analysis. Istanbul Technical University, Maslak, Istanbul, Turkey, Vol. 54(5). [24] Goel R.K. and Chopra A.K., 2004. Evaluation of modal and FEMA pushover analyses: SAC buildings. Earthquake Spectra, Vol. 20(1), pp. 225–54. [25] Goel R.K., 2008. Evaluation Of Current Nonlinear Static Procedures For Reinforced Concrete Buildings. 14th World Conference on Earthquake Engineering (14WCEE), (December). [26] Gulkan, P. and Sozen, M.A., 1974. Inelastic Response Reinforced Concrete Structures to Earthquake Motions, Journal of ACI, Vol. 71(12). [27] Gupta H.K., 2001. Bhuj earthquake of 26 January, 2001. Journal-Geological Society Of India, Vol. 57.3, pp. 275-278. [28] Gupta B. and Kunnath S.K., 1999. Pushover analysis of isolated flexural reinforced concrete walls. Structural Engineering in the 21st Century, Proc. Structures Congress, New Orleans.
Copyright
Copyright © 2024 Ankita Janardan, Srishti Verma. This is an open access article distributed under the Creative Commons Attribution License, which permits unrestricted use, distribution, and reproduction in any medium, provided the original work is properly cited.

Download Paper
Paper Id : IJRASET61930
Publish Date : 2024-05-10
ISSN : 2321-9653
Publisher Name : IJRASET
DOI Link : Click Here
 Submit Paper Online

