Ijraset Journal For Research in Applied Science and Engineering Technology
- Home / Ijraset
- On This Page
- Abstract
- Introduction
- References
- Copyright
Real Estate Price Prediction: A Comprehensive Review
Authors: Yashraj Singh, Vivek Kumar, Asim Ahmad
DOI Link: https://doi.org/10.22214/ijraset.2024.58428
Certificate: View Certificate
Abstract
The document below outlines the execution of a price prediction project for housing and real estate markets. A multitude of algorithms have been employed to enhance the accuracy of predictions. Various researchers have undertaken this project and implemented algorithms such as hedonic regression, artificial neural networks, AdaBoost, and J48 tree, which are deemed as the optimal models for price prediction. These models serve as the foundation, and with the aid of sophisticated data mining tools, algorithms like random forest, gradient boosted trees, multilayer perceptron, and ensemble learning models are utilized to achieve a higher rate of prediction accuracy. The results and evaluation of these models, facilitated by machine learning and advanced data mining tools like Weka and Rapid Miner, significantly impact price prediction.
Introduction
I. INTRODUCTION
A. Machine Learning Overview
Machine Learning can be leveraged to forecast student performance and detect potential risks at an early stage, thereby enabling timely interventions to boost their performance. ML methodologies could assist students in enhancing their performance based on projected grades and empower educators to pinpoint those who may require additional support in their courses. The fundamental motivation for undertaking this project is to simplify student preparations by predicting their future academic results based on their past performance.
Machine Learning techniques can be primarily divided into:
- Supervised Learning: In this approach, the model is trained using a pre-existing dataset. The learning process is guided, and the model, once trained, is capable of making predictions or decisions when new data is introduced.
- Unsupervised Learning: This method involves the model learning through observation and identifying patterns in the data. When a dataset is given to the model, it automatically identifies relationships and creates clusters. For example, if images of bananas, mangoes, and apples are given to the model, it forms clusters based on certain relationships and patterns, and segregates the images into these clusters. Hence, when new images are introduced to the trained model, it can categorize them into one of the existing clusters.
- Reinforcement Learning: This pertains to an agent’s ability to interact with its environment and learn the optimal outcome. It operates on a trial-and-error basis where the agent is either rewarded or penalized with points for each correct or incorrect action respectively. The model then guides itself based on the positive reward points obtained. Once trained, it is prepared to predict the outcome of new data introduced to it.
II. METHODOLOGY AND IMPLEMENTATION
The following sections detail the methodology employed for predicting real estate house prices,and an architectural flow diagram is provided.
.
A. Data Collection
Data collection is a systematic method of gathering information on specific variables. It aids in answering various questions, testing hypotheses, and evaluating results. Data collection involves the accumulation and measurement of data on targeted variables within a structured system, which then allows one to answer relevant questions and assess outcomes. This process is a component of research across all fields of study, including physical and social sciences, humanities, and business.
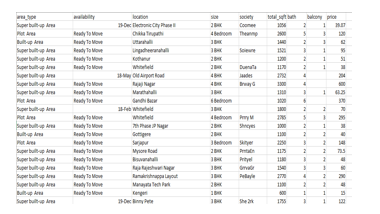
While the methods may vary across disciplines, the emphasis on ensuring accurate and honest collection remains constant. This process has been carried out for multiple datasets on Kaggle that align with our project objective. After examining numerous datasets, we found a suitable one. It is a dataset on house pricing in the city of Ames. This dataset is a well-known machine learning dataset with a lesser scope for errors and variations.
B. Data Visualization Data
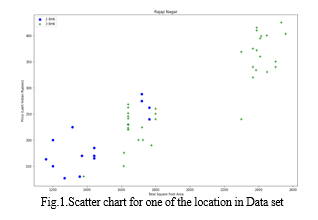
Visualization is the graphical or pictorial representation of data, which aids in understanding complex concepts and identifying new patterns. Data Visualization is viewed by many disciplines as a modern equivalent of visual communication. It involves the creation and study of the visual representation of data. To convey information clearly and efficiently, data visualization uses statistical graphics, plots, information graphics, and other tools. Effective visualization helps users to analyze and reason about data and evidence. It makes complex data more accessible, understandable, and usable. Users may have specific analytical tasks, such as making comparisons or understanding causality, and the design principle of the graphic(i.e., showing comparisons or showing causality)follows the task.
Data Visualization is both an art and a science. It is considered a branch of descriptive statistics by some, but also as a grounded theory development tool by others. Increased amounts of data created by internet activity and an increasing number of sensors in the environment are referred to as “big data” or the Internet of Things. Processing, analyzing, and communicating this data present ethical and analytical challenges for data visualization. The field of data science and professionals known as data scientists help address this challenge.
C. Data Pre-Processing
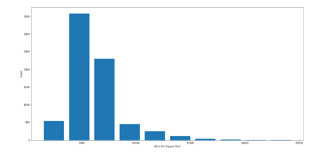
Data Pre-processing is the method of modifying data prior to inputting it into the algorithm. It is used to convert raw data into a refined dataset. This data mining technique involves transforming raw data into an understandable format. The outcome of data preprocessing is the final dataset used for training and testing purposes. Data preprocessing is a data mining process used to transform raw data into a useful and efficient format. In any Machine Learning process, Data Preprocessing is the step where the data is transformed or encoded to bring it to a state that the machine can easily parse. Pre-processing refers to the changes applied to our data before feeding it to the algorithm. Data Preprocessing is a technique used to convert raw data into a clean dataset. In other words, when data is gathered from various sources, it is collected in raw format which is not feasible for analysis. Actual data usually contains noise, missing values, and possibly in an unusable format which cannot be directly used for Machine Learning models. Data preprocessing is a necessary task for cleaning the data and making it suitable for a Machine Learning model, which also increases the accuracy and efficiency of a Machine Learning model.
D. Data Cleaning
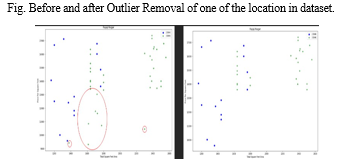
Data cleaning is the procedure of identifying and rectifying errors to enhance the quality of data. This process is facilitated with the aid of data wrangling tools. It involves spotting and correcting inaccurate records from a dataset table or database. It identifies incomplete data and replaces the unclean data. The data is modified to ensure its accuracy and correctness. Data cleaning is the process of spotting and rectifying incorrect records from a dataset table or database. It involves identifying incomplete data and then replacing the unclean data. The data is modified to ensure that it is accurate and correct. It is used to make a dataset consistent. The primary goal of data cleaning is to identify and eliminate errors to increase the value of data in decision-making. The main focus should be on identifying the correct values and finding connections between various data artifacts such as trends and records.
E. Algorithms Utilized
Linear Regression
Linear regression is the most basic technique for forecasting. It employs two variables, namely the predictor variable and the most significant variable, which is the first one, whether the predictor variable and su.
These regression estimates are utilized to elucidate the relationship between one dependent variable and one or more independent variables. The formula defines the equation of the regression equation with one dependent and one independent variable.

where,b is the estimated dependent variable score, yis the constant, xis the regression coefficient, andais the score on the independent variable.
III. MODELING AND EVALUATION
A. Real Estate Price Prediction
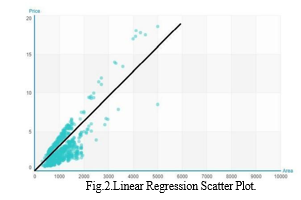
Additionally, once the dataset is finalized, it will undergo a process called data cleaning. This process involves removing unnecessary data and converting the raw data into a.csv file.
Furthermore, the data will undergo data preprocessing, where missing data will be addressed, and label encoding will be performed if necessary.
Subsequently, the data will undergo a transformation where it will be converted into a NumPy array, preparing it for model training.
During the training phase, various machine learning algorithms will be utilized to train the model. Their error rates will be calculated, and based on these rates, an algorithm and model will be selected that can provide accurate predictions.
- Employing Machine Learning for House Price Prediction
a. Data Refinement: Data refinement involves ensuring that the data fed into a data analytics platform is relevant, standardized and categorized. This allows users to derive meaningful results and identify discrepancies. The data refinement process is a crucial step in building a data-driven organization and maintaining good practices.
b. Regression: Regression analysis is a potent statistical technique that enables you to investigate the relationship between two or more variables of interest. Despite the existence of various types of regression analysis, they all fundamentally examine the impact of one or more independent variables on a dependent variable.
c. Classification: Classification is a process in machine learning where the computer program learns from the input given to it and then uses this learning to classify new observations. It categorizes the data into given classes.
d. Clustering: Clustering is an unsupervised learning method that organizes data into groups based on their similarities.It identifies the inherent groupings in the data such that data points in the same group are more similar to each other than those in other groups.
2. Prediction of House Pricing Using Machine Learning with Python
a. Data Collection: Data collection is the systematic acquisition of information on specific variables within a defined system. This process allows for the answering of relevant questions and the evaluation of outcomes. Data collection is a fundamental aspect of research across all fields, including physical and social sciences, humanities, and business.
b. Data Visualization: Data visualization is the process of representing data or information visually using elements such as charts, graphs and maps. This technique makes it easier to perceive and comprehend trends outliers and patterns in the data.
c. Data Pre-Processing: In Machine Learning, data preprocessing refers to the process of preparing the raw data(cleaning and organizing)to make it suitable for constructing and training Machine Learning models.
d. Data Cleaning: Data cleaning involves rectifying or eliminating incorrect, corrupted, improperly formatted, duplicate or incomplete data within a dataset. When integrating multiple data sources, there are numerous opportunities for data duplication or mislabeling.
3. House Price Prediction Using Machine Learning and Neural Networks
a. Linear Regression: In statistics, linear regression is a linear approach for modelling the relationship between a scalar response and one or more explanatory variables(also known as dependent and independent variables).
b. Forest Regression: Forest regression uses the technique called as Bagging of trees. The main idea here is to decorrelate the several trees. We then reduce the Variance in the Trees by averaging them. Using this approach, a large number of decision trees are created
4. Machine Learning based Predicting House Prices using Regression Techniques
Several techniques including Linear Regression Support Vector Machine,K-Nearest Neighbors(KNN),and Random Forest Regression as well as an ensemble approach that combines KNN and Random Forest have been utilized for predicting property prices.
The ensemble approach yielded the least prediction error of 0.0985,and the application of Principal Component Analysis(PCA)did not enhance the prediction accuracy.
Numerous studies have concentrated on feature collection and extraction procedures. Wu and Jiao Yang have compared various feature selection and extraction algorithms in conjunction with Support Vector Regression.
Several researchers have devised neural network models for house price prediction.
Limsombunchai has compared the hedonic pricing structure with an artificial neural network model for house price prediction.
Cebula has employed the hedonic price model to forecast housing prices in Savannah, Georgia.
Jirong, Mingcang and Liuguangy an have used Support Vector Machine(SVM)regression to predict housing prices in China from 1993 to 2002.They have utilized a genetic algorithm to fine-tune the hyperparameters in the SVM regression model.
Tay and Ho compared the pricing prediction between regression analysis and artificial neural network in predicting apartment’s prices.
5. Predicting the Housing Price Direction using Machine Learning Techniques
a. Feature Definition: The present study makes use of data sourced from the online platform Kaggle. com, specifically from a dataset used in a competition hosted on the site.
b. Feature Selection: This study employs various feature selection techniques such as variance influence factor, Information value, and principal component analysis. Additionally data transformation techniques like outlier and missing value treatment, as well as box-cox transformation techniques, are used for the selection and subsequent transformation of features.
IV. RESULTS AND DISCUSSION
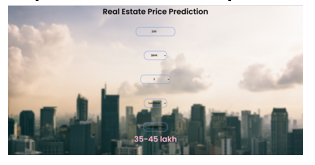
The objective of this system is to estimate the price of a property based on various features provided by the user. These features are inputted into the ML model and the model generates a prediction based on how these features influence the label. The first step involves searching for a suitable dataset that meets the requirements of both the developer and the user. Once the dataset is finalized it undergoes a process known as data cleaning, where all unnecessary data is removed and the raw data is converted into a.csv file.
Furthermore the data undergoes preprocessing where missing data is addressed, and label encoding is performed if necessary. The data then undergoes a transformation where it is converted into a NumPy array readying it for model training. During training various machine learning algorithms are used, their error rates are calculated and an algorithm and model are ultimately selected that can provide accurate predictions.
Users and companies will have the ability to log in and fill out a form detailing various attributes of their property for which they want to predict the price. After a careful selection of attributes, the form is submitted. The data entered by the user is then fed into the model and within seconds the user can view the predicted price of the property they inputted.
References
[1] A. Adair, J. Berry, W.McGreal,Hedonic modeling, housing submarkets and residential valuation, Journal of Property Research,13(1996)67-83. [2] O. Bin, A prediction comparison of housing sales prices by parametric versus semi-parametric regressions, Journal of Housing Economics,13(2004)68-84. [3] T. M. Oshiro, P.S. Perez,and J.A.Baranauskas,“How many trees in a random forest?” In Lecture Notes in Computer Science(including subseries Lecture Notes in Artificial Intelligence and Lecture Notes in Bioinformatics),vol.7376 LNAI,2012,pp.154–168,ISBN:9783642315367.DOI:10.1007/978-3-642-31537-4\\13 [4] J. Schmidhuber,“Multi-column deep neural networks for image classification,” in Proceedings of the 2012 IEEE Conference on Computer Vision and Pattern Recognition(CVPR),ser.CVPR’12,Washington,DC,USA:IEEE Computer Society,2012,pp.3642–3649,ISBN:978-1-4673-1226-4.[Online]. [5] T. Kauko, P. Hooimeijer, J. Hakfoort, capturing housing market segmentation: An alternative approach based on neural network modeling, Housing Studies,17(2002)875-894. [6] R.J.Shiller,“Understanding recent trends in house prices and home ownership,” National Bureau of Economic Research, Working Paper 13553,Oct.2007.DOI:10.3386/w13553.[Online]. [7] The elements of statistical learning, Trevor Hastie-Random Forest Generation [8] C.M.Bishop, Pattern Recognition and Machine Learning,Springer,2006 [9] S.Yin,S.Ding,X.Xie,and H.Luo,“A review on basic data-driven approaches for industrial process monitoring,” IEEE Transactions on Industrial Electronics,2014. [10] Friedman,J.2001.Greedy function approximation:a gradient boosting machine. Annals of Statistics 29(5):1189–1232. [11] R.T.Azuma et al., “A survey of augmented reality,”Presence,vol.6,no.4,pp.355–385,1997
Copyright
Copyright © 2024 Yashraj Singh, Vivek Kumar, Asim Ahmad. This is an open access article distributed under the Creative Commons Attribution License, which permits unrestricted use, distribution, and reproduction in any medium, provided the original work is properly cited.

Download Paper
Paper Id : IJRASET58428
Publish Date : 2024-02-13
ISSN : 2321-9653
Publisher Name : IJRASET
DOI Link : Click Here
 Submit Paper Online

