Ijraset Journal For Research in Applied Science and Engineering Technology
- Home / Ijraset
- On This Page
- Abstract
- Introduction
- Conclusion
- References
- Copyright
Reassessment of Geophysical Investigation of Zinc(Z), Cupper (Cu) and Lead (Pb) Potential Mineralization Deposits using Aeromagnetic Data in Wase Middle Benue Trough, Nigeria
Authors: Mustapha Babagana, Abubakar Adamu, El-Yakub A. Idris, Shehu M. Fatima, Wase Muhammad M, Ibrahim M.. Muhammad, Tanko U. Abba, Hussain Ahmed
DOI Link: https://doi.org/10.22214/ijraset.2023.49327
Certificate: View Certificate
Abstract
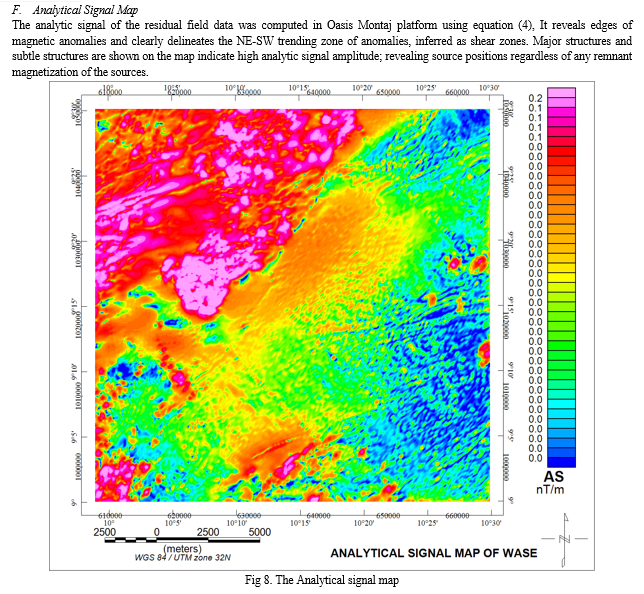
This effort aims to delineate structures responsible for exploring mineral resources in the Wase middle Benue trough area of Northcentral, Nigeria by evaluating the aeromagnetic data over that region. Oasis Montaj version 6.4 was used to qualitatively and quantitatively evaluate the aeromagnetic data. Techniques for Source Parameter Imaging (SPI) interpretation, including First Vertical Derivative, Analytical Signal, Upward Continuation, and Tilt Derivative, were used in the study. Analytic signal and tilt derivative maps showed different patterns of magnetic signatures independent of magnetization direction with amplitude ranging from 0.1 to 0.2nT/m and -1.3 to 1.4nT/m. They also showed qualitative interpretation applied aids enhance linear features at the expense of deep intrusive bodies like lineaments, fractures, and fault zones which trend Northeast Southwest (NE- SW) in the map of the study area. The boundaries of the geologically interesting anomalies were noticeably accentuated by the upward continuation done at 2 km. Nonetheless, this provides an approximation of the depth of the source of magnetic signatures in the area. The depth measured by SPI ranged from 103.9 to 1473.0 m. In the Eastern and Western regions of the region, respectively, shallow and deep-seated bodies are seen. The depth of the analysis was about 2000m, in conclusion, it was believed that the linear characteristics in the area that are trending northeast to southwest are possible structures for the prospecting of mineral deposits like zinc, copper, and lead.
Introduction
I. INTRODUCTION
The richest state in India, Rajasthan is the sole producer of base metal deposits, accounting for 95% of resources for zinc (Zn), 85% for lead (Pb), and 20% for copper (Cu) (GSI, 2011). The demand for base metals in India is rising steadily as a result of the country's booming steel and galvanizing industries. Find new resources of economic significance in order to decrease reliance on imports and attain self-sufficiency in the production of Zn, Pb, and Cu metals (MECL, 2005; IBM, 2018; GSI, 2018). From the late Albian through the end of the Turonian, lead-zinc mineralization in Nigeria has been documented (Farrington, 1952), principally as epigenetic deposits within the Cretaceous strata of the Upper, Middle, and Lower Benue Troughs (Fatoye et al., 2014; Haruna, 2017). Controversy has persisted on the origins of the lead-zinc mineralization in Nigeria (Ogundipe, 2018). According to epigenetic traits and the closeness of some of the lodes to mafic-intermediate igneous rocks, one of the three hypotheses on the origin considered by Olade and Morton (1985) is magmatic-hydrothermal (Farrington 1952; Nwachukwu, 1974). (2) circulating heated connate fluids (brines) derived from evaporitic shales of the Asu River Group deposited contemporaneous with or before the mineralization processes (Haruna, 2017); According to fluid inclusion studies and the geologic settings of the Benue Valley lead-zinc deposits, intense heat flow associated with mantle plume activity and continental rifting may have likely enhanced the leaching characteristics of the ore fluids and promoted active circulation through dilated fractures; (Olade and Morton, 1985; Haruna, 2017); (3) Without a magmatic spatial link, mixing of juvenile and connate waters (Offodile & Reyment 1976) may not be the only potential source of mineralizing fluids. Nonetheless, a magmatic intrusion could result in a localized, shallow convective system (Olade and Morton, 1985). According to Fatoye et al. (2014), fractures and shear zones or saline water intrusion are related to mineralization.
While the connection between their genesis and that is believed to be hydrothermal is not yet established. Obaje's (2009) hypothesis that Lead-zinc mineralization may have formed as a result of chemical interaction between upwelling ore-bearing hydrothermal fluids and the host rock in the saliferous or evaporitic zone is still a viable possibility.
The role of aeromagnetic method in mineral exploration varies from delineating structures like faults, folds, contacts, shear zones and intrusions to automated detection of porphyry and favorable areas of ore deposits. These structures play important roles in the localization of mineralization, first as conduits for the mineralization solution and second, as loci of deposition of mineralization (Abubakar 2013). Magnetic and Electromagnetic methods offer rapid means of providing subsurface information about rock’s magnetic susceptibility and conductivity/resistivity, which can be used to delineate geologic structures, zones of water saturation and in determining the occurrence of metal-based deposits (Osinowo and Falusofi, 2018).
A. Location, Accessibility, And Climate Of The Study Area
The research location is in the Wase local government area of Plateau State (Wase NE Sheet 191; and Bashar NW, Sheet 192) and lies between Latitudes 0859'00" N and 0921'00" N, and longitudes 0958'00"E and 1038'00"E. But in this research, we only used sheet192 i.e. Bashar because the license area or mining site fall on Bashar sheet192. The license area is approximately about 1.08 square kilometers and is located about 40 km southeast of Bashar, 44 km southeast of Wase, and 32 km southwest of Zurak (Figure 1). The area is mainly accessible from Dengi through Bashar - Gajin Bashar -Safiyo-Dogon Ruwa to Tapga settlement or from Wase through the Wase- Mavo- Gimbi Road to Tapga. Since the area is relatively flat, it is accessible through footpaths and cattle-rearing paths. Its climate is Northern Guinea Savannah, with an average annual rainfall of 1,941 mm. The average annual temperature is 26.5 degrees Celsius, with a relative humidity of 23 per cent (NIMET, 2015; Adedeye et al., 2019).

B. Regional Geological Setting
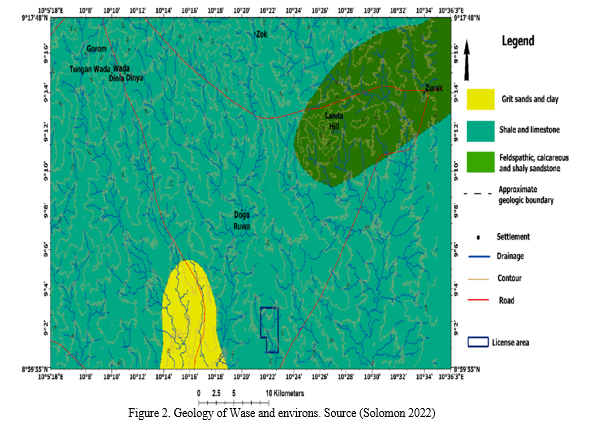
A beneficial interaction of stratigraphic profiling and their tectonic juxtaposition emerged from the creation, formation, and evolution of the Benue Trough (Figure 2) as a component of the West and Central African Rift System (WCARS). Rich deposits of economically viable minerals resulted from this combination (Abubakar et al., 2014). The Benue Trough shares similarities with other oil and gas-reserved WCARS basins in that it is a rifted basin that was altered by strike-slip (transcurrent) faulting and subsequent inversion. The Muglad Basin in Sudan, the Termit and Doba Basins in Chad and Niger, and the Doba Basin in Niger all have comparable stratigraphic arrangements. According to Ogungbesan and Akaegbobi (2011), the Benue Trough in Nigeria is an intracratonic rift basin that spans 800 km from north to south. It is 90–150 km broad and is divided into a lower, middle, and upper part (Obaje, 2009).
C. Local Geology Of The License Area
Although rock exposures are uncommon in the study area, they can still be found in or near river channels, road cuts, erosional pathways, and steep cliffs in the form of the Lower Albian Bima Sandstone, which is made up of feldspathic, calcareous, and shelly sandstones and is frequently highly indurated. The sandstone's colors range from white to reddish when viewed petrographically (El-Nafaty, 2015). The color is influenced by weathering, alterations, and the coloring of the cementing substance. The Pindiga Formation of the Turonian era is next to be found as outcrops, especially in the vicinity of stream channels.
Following the Palaeocene Kerri-Kerri Formation, which is composed of recent sediments of sand grits and clays and is exposed at stream channels as sub crops, the Pindiga Formation, which is composed of shales and limestones, is attributed to the beginning of marine incursion in the late Cenomanian period. Moreover, a lot of duricrust (ferricrete) is seen in the region's western regions (Figure 2). They have a ferruginous appearance, no stratification, are void- and pore-filled, and are very iron-rich in the form of red and yellow ochres. These duricrusts evolved during periods of low or no tectonic activity and lengthy subaerial exposure in a contrasting hot and dry climate, and their evolution is tied to the climate of the studied area.
II. MATERIALS AND METHOD
The materials used in this research were;
- Aeromagnetic data sheet (WASE)
- Oasis Montaj 6.3 and Surfer 16 ArcGIS 10.4 software’s
A. Data Acquisition
The High Resolution Aeromagnetic (HRAM) data between. 9 30’N to 1000’N latitudes and 90’E to 9030’E longitudes sheet (WASE) which covered the study area and beyond, was sourced from Nigerian Geological Survey Agency (NGSA), Abuja. The data was obtained as part of nationwide aeromagnetic survey sponsored by the geological survey of Nigeria. The data were acquired at a flight altitude of 80m along with a series of NW – SE flight lines with a spacing of 500m. The data were made available in half degree sheets that are on scale 1:100,000 when produced in map
B. Methodology
In potential field investigations, data improvement methods like filtering, continuations, computing derivatives, etc. are utilized as interpretational aids. Enhancement seeks to draw attention to specific anomaly traits in order to make them more noticeable. In order to estimate the shape outlines of anomaly sources of interest, such as isolated structures at relatively shallow depths or larescale structures at greater depth, qualitative visual analysis is the main application of the improvd potential field anomalies (Sharma, 2002).
C. Upward Continuation Of Residual Field
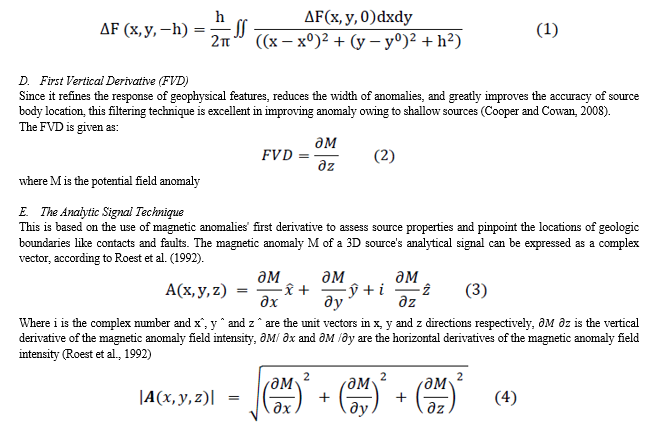
It was utilized in this study because it is a filtering method that removes noise caused by high frequency while projecting data collected at one elevation to a higher elevation. The upward continued ΔF (the total field magnetic anomaly) at a higher level (z = - h) is given by: (Dobrin, 1997)
C. The Residual Map
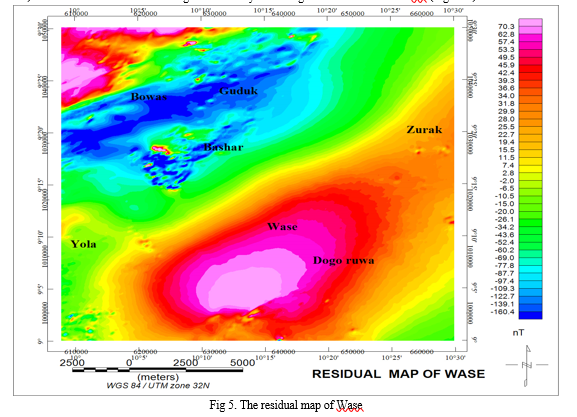
A magnetic anomaly's amplitude is closely correlated with its magnetization, which depends on the rocks' magnetic susceptibility According to Gunn et al. (1997), in low magnetic latitude areas like Nigeria, low susceptible magnetic features can look as high magnetic anomalies and vice versa. Hence, the residual magnetic intensity image depicts fewer magnetically susceptible areas as high magnetic values indicated at Dogo ruwa which is the license area where mining activities taken place depicted on the local geological map figure (1) according to Solomon (2022). And more magnetically susceptible areas as low magnetic values (blue) (pink color). The research area's residual magnetic intensity level ranges from -160.4 to 70.3 nT. (Figure 5).
D. First Vertical Derivative Map
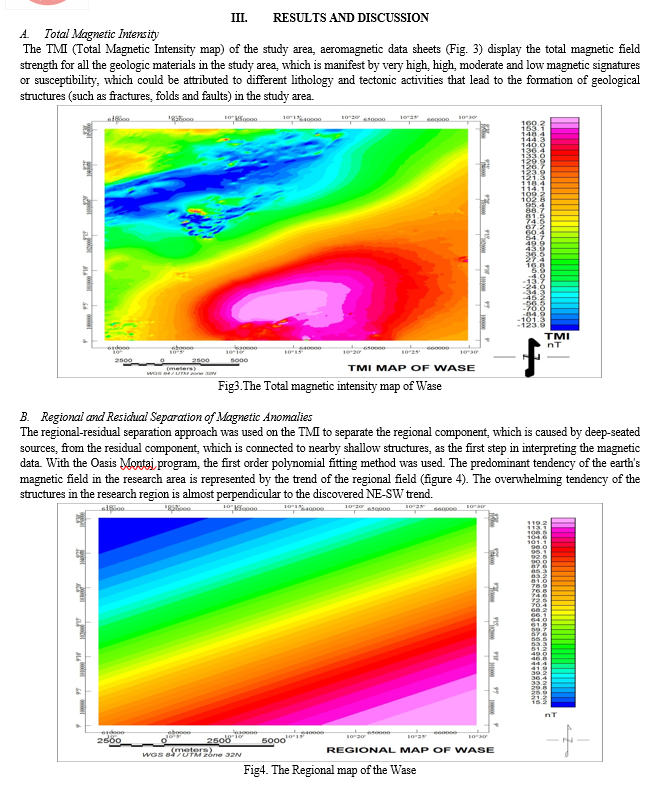
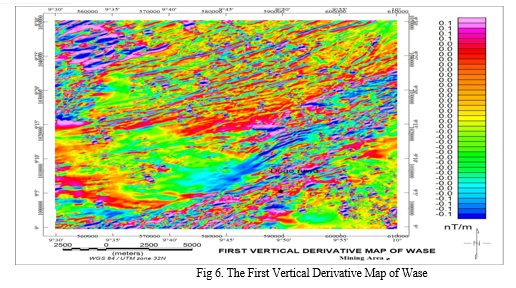
The computation of the first vertical derivative is an important step in the interpretation of Aeromagnetic data, in particular in the study of narrow and shallow anomalies. It decreases the impact of regional (generally deeper) long-wavelength anomalies and increases the higher frequency shallow anomalies. The enhanced map (figure 6) is the First vertical derivative of the upward continued residual field form. The map was produced with equation (2) in Oasis Montaj platform. The map discovered prominent NE-SW trending lineament region suspected of being a shear zone with various E-W trending subsidiary lineaments to ESE-WNW and ENE-WSW, northwestern trending lineaments to E-w-E, and many subtle random-oriented anomalies depicting major structural and lithologic details. Linear magnetic anomalies with local magnetic responses that is associated with geologic structures. A major NE-SW trending lineament, part of Zurak fault; which is situated at the western part of the mining license area, correspond to major fault, that might have acted as conduit through which the suspected Zinc, Copper and Lead as well as other mineralization flow to settle at the subsidiary fault that underlay the mining site. This subsidiary fault is also revealed as NE-SSW trending short liner feature amongst many of such. These lineaments translate deep fractures, local faults, river channels, ridges and vein systems which are oriented NNE-SSW, NE-SW, NW-SE, E-W with low magnetic susceptibility on the ground. The areas with the higher magnetic signals due to high susceptibility are characterized by values ranging from 0.0-0.1nT and the areas with lower magnetic susceptibility have values between -0.1-0.0nT.
E. Upward Continuation Map
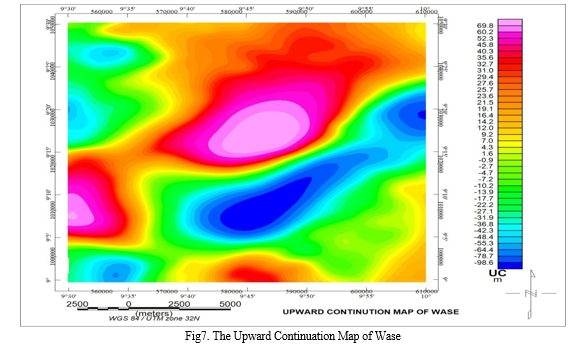
The Oasis Montaj software was used to upward continuation of the residual field to a distance of 2km. Equation (2.7) was used to achieve this with the aid of Magmap tool software. According to Ahmed (2019) In physical terms, as the continuation distance is increased, the effects of smaller, narrower and thinner magnetic bodies gradually disappear relative to the effects of larger magnetic bodies of considerable depth extent. Since our interest is on relatively shallow structures that may be affected by noise that comes from resulting near-surface cultural features, an upward continuation of the field to a small elevation while removing noise can give us a clearer view of our anomalies of interest, which are near-surface features by removing the noise. The upward-continued map (figure 7) shows a smoother surface when related with the residual map revealing the indications of the main tectonic and crustal blocks in the area.
G. Derivative Of TILT
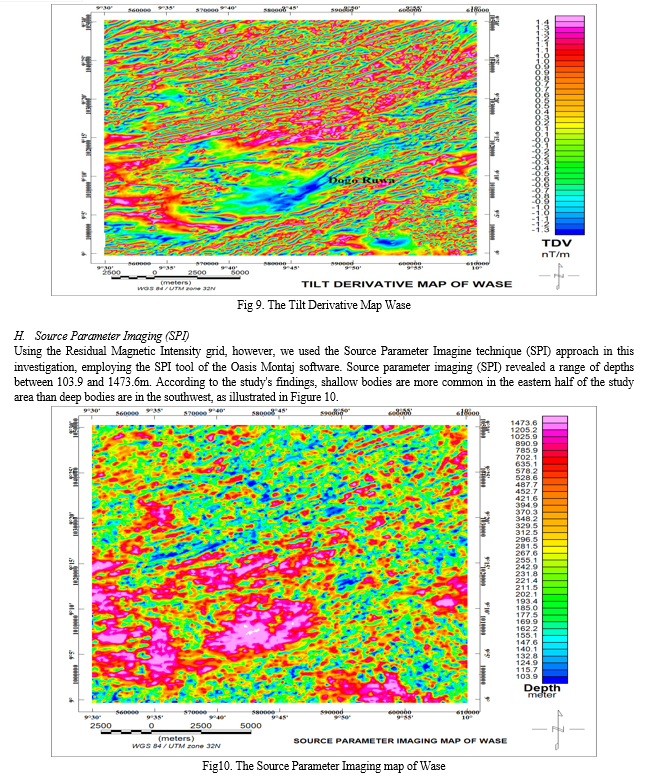
This technique amplifies shallow depth (residual) structures of the magnetic anomaly in addition to using the magnetic contrast to visualize features like faults and lineaments. The ratio of the vertical derivative to the absolute value of the total horizontal derivative is the tilt derivative, which is the tan inverse.
Tan-1 (VDR/THDR) = TDR
A vertical-sided source's TDR crosses through zero at or near its edges, is positive over its core, and is negative outside the source region. As seen in Figure 5.15, regardless of the magnitude of the VDR and THDR, all tilt amplitudes are constrained to values between +/2 and -/2 due to the nature of the arctan trigonometric function. Verduzco and others (2004). However figure( 9) the tilt derivative revealed that lineament also there at Dogo ruwa which is the license area for the mining activities going on so this indicate that the trend of lineament extended to the other non-mining area and there is possibilities of other potential minerals deposit.
Conclusion
Aeromagnetic methods have always been successful in identifying primary and secondary linear structures. Analytical signals and the first vertical derivative (FVD) were applied to define the geological features or lineaments (showing faults, vein system) that are home to fractures and contacts in the investigated area. Inferred to be a component of the Zurak fault system, the main trend of these lineaments is in the NE-SW direction and may be found at the study area\'s center. The majority of depths in the study area range from 103.9 to 1473.6 meters, which indicates that the major structures are deeply seated and serve as migratory routes for mineralizing fluids as they are channeled to subsidiary fractures where they are trapped. The depth to subsurface structures within the study area was determined using the Source Parameter Imaging(SPI) method. The research area\'s potential zinc, copper, and lead mineralization deposit is structurally regulated along the subsidiary (lineament), which acts as a conduit for the transport of the mineralizing solutions and the deposit of those solutions in the shear zones connected to it.
References
[1] MECL, 2005. Geological Report on Exploration for Zinc Ore, Calabar Block, Pali and Ajmer Districts, Rajasthan. Publ. Mineral Exploration Corporation Ltd. (MECL), Central Zone, Nagpur, p. 15 [2] GSI, 2018. Mineral Exploration in India at a Glance. Mission-II Natural Resources Assessment, Geological Survey of India (GSI), Nagpur, Miscellaneous Publication No. 67–80. [3] GSI, 2011. Detailed Information Dossier on Base metal Deposits / Occurrences in India. Geological Survey of India, Government of India, pp. 1–337 [4] Farrington, J.L., 1952. A preliminary description of the Nigerian lead-zinc field. Econ. Geol. 47 (6), 583–608. [5] Fatoye, F.B., Ibitomi, M.A., Omada, J.I., 2014. Lead-Zinc-Barytes mineralization in the Benue Trough, Nigeria: their geology, occurrences and economic perspective. Adv. Appl. Sci. Res. 5 (2), 86–92. [6] Haruna, I.V., 2017. Review of the basement geology and mineral belts of Nigeria. J. Appl. Geol. Geophys. 5 (1), 37–45 [7] Olade, M.A., Morton, R.D., 1985. Origin of lead-zinc mineralization in the southern Benue Trough, Nigeria-Fluid inclusion, and trace element studies. Miner. Deposita 20 (2), 76–80. [8] Ogundipe, I.E., Obasi, R.A., 2016. Geology and mineralisation in the albian sediments of the Benue Trough, Nigeria. British J. Earth Sci. Res. 4 (3), 1–15. [9] Offodile, M.E., Reyment, R.A., 1976. Stratigraphy of the keana-awe area of the middle Benue, Nigeriak, university of Uppsala. Bull. Geology Inst 7, 36–66. [10] Obaje, N.G., 2009. Geology and mineral Resources of Nigeria, 120. Springer, Berlin, p. 221p. [11] El-Nafaty, J.M., 2015. Geology and petrography of the rocks around Gulani area, northeastern Nigeria. J. Geol. Min. Res. 7 (5), 41–57 [12] Abubakar, M.B., Maigari, A.S., Babangida, S.Y.D., Abdullah, W.H., Ahmed, I.H., John, S.J., Bappah, U.A., Abdulkarim, H.A., 2014. A Re-focus on the tectonostratigraphic evolution of the upper Benue Trough, north-eastern Nigeria: implications on petroleum exploration. NAPE Bulletin 26 (1/27). [13] Ogungbesan, G.O., Akaegbobi, I.M., 2011. Petrography and geochemistry of Turonian Eze-Aku sandstone Ridges, lower Benue trough, Nigeria implication for provenance and tectonic settings. IFE J. Sci. 13 (2), 263–277. [14] Cooper, G.R.J., Cowan, D.R., 2008. Edge enhancement of potential-field data using normalized statistics. Geophysics 73 (3), H1–H4 [15] Sharma, P.V., (2002): Environmental and Engineering Geophysics. Cambridge University Press, United Kingdom. 32, 221. [16] McCurry, P. (1976). The geology of the Precambrian to Lower Palaeozoic Rocks of Northern Nigeria – A Review. In: Kogbe CA (ed) Geology of Nigeria. Elizabethan Publishers, Lagos, pages 15–39 [17] Gunn, P., Maidment, D., and Milligan, P. (1997): Interpreting aeromagnetic data in areas of limited outcrop. AGSO Journal of Australian Geology & Geophysics, 17(2), 175–185. [18] Roest, W.R., Verhoef, J. and Pikington, M. (1992): Magnetic interpretation using the 3-D [19] Osinowo, O. O. and Falusofi, M. O., (2018): Magnetic and Very Low Frequency Electromagnetic (VLF-EM) investigations for gold exploration around Ihale in Bunnu-Kabba Area of Kogi, north-central Nigeria, Geophysics and Geodesy, Vol. 48: 191–205. [20] Abubakar Y. I. (2013): An Integrated Technique in Delineating Structures. Journal of Applied Science and Technology.
Copyright
Copyright © 2023 Mustapha Babagana, Abubakar Adamu, El-Yakub A. Idris, Shehu M. Fatima, Wase Muhammad M, Ibrahim M.. Muhammad, Tanko U. Abba, Hussain Ahmed. This is an open access article distributed under the Creative Commons Attribution License, which permits unrestricted use, distribution, and reproduction in any medium, provided the original work is properly cited.

Download Paper
Paper Id : IJRASET49327
Publish Date : 2023-02-28
ISSN : 2321-9653
Publisher Name : IJRASET
DOI Link : Click Here
 Submit Paper Online

