Ijraset Journal For Research in Applied Science and Engineering Technology
- Home / Ijraset
- On This Page
- Introduction
- Conclusion
- References
- Copyright
Reduction of Chemical Oxygen Demand, Oil and Grease from Dairy Effluent using Unmodified Agricultural By-products as Adsorbents
Authors: Aditya P. Mankar, Dr. S. R. Bhagat
DOI Link: https://doi.org/10.22214/ijraset.2024.64243
Certificate: View Certificate
Abstract
Introduction
I. INTRODUCTION
The escalating need for water globally results from swift growth in population and industry. Simultaneously, the levels of groundwater and surface water are dwindling due to overuse. This has led to exploring alternative water sources, with the treatment and reuse of industrial wastewater emerging as a key solution.
In the context of the dairy industry, the wastewater generated is complex due to the variety of products, including pasteurized and sterilized milk, yogurt, cheese, ice cream, butter, and more. The wastewater contains high levels of organic materials like proteins, carbohydrates, fats, grease, and minerals, which increase the Biological Oxygen Demand (BOD) and Chemical Oxygen Demand (COD).
Direct discharge of untreated dairy wastewater into water bodies is not advisable as it can lead to various pollution issues. These include rapid depletion of dissolved oxygen due to high organic loading, leading to anaerobic conditions, emission of volatile toxic substances, destruction of aquatic life, and subsequent environmental damage.
Therefore, it’s crucial to treat dairy wastewater appropriately to mitigate these environmental issues. Among the various treatment techniques, adsorption has shown promise in efficiently removing contaminants. This technique involves the capture of pollutants on the surface of an adsorbent material, making it a viable solution for wastewater treatment. The adsorption technique emerges as a promising technique in the removal efficiency.
Adsorption is the adhesion of atoms, ions or molecules from a gas, liquid or dissolved solid to a surface. This process creates a film of the adsorbate on the surface of the adsorbent. Adsorption is distinctly a surface phenomenon, wherein the adsorbate does not penetrate through the material surface and into the bulk of the adsorbent. It normally involves the molecules, atoms or even ions of a gas, liquid or solid in a dissolved state that is attached to the surface. Adsorption is mainly a consequence of surface energy. Generally, the surface particles which can be exposed partially tend to attract other particles to their site. The substance being concentrated or adsorbed is known as the adsorbate, while the phase that adsorbs it is called the adsorbent.
Various methods are currently employed to treat dairy wastewater. This study explores the use of affordable adsorbents derived from coconut husk, sugarcane bagasse, and banana peels to treat the effluent from Amul Virar dairy located in Virar, Tal. Vasai, Dist. Palghar.
A significant amount of Coconut Husk, Sugarcane Bagasse, and Banana Peels are often discarded as waste. Given the growing concern over waste management, it’s crucial to find practical uses for these materials. These waste products are inexpensive, non-toxic, and eco-friendly, making them suitable for use as adsorbents in wastewater treatment.
The adsorbents were prepared using dehydration and carbonisation methods. The study also evaluated the impact of dosage and particle size on removing pollutants from dairy wastewater. This approach not only addresses the issue of waste management but also contributes to the treatment of dairy wastewater, thereby mitigating environmental damage.
II. NEED OF STUDY
The adsorption of metal ions, oil, and grease is influenced by the porosity, surface area, and nature of the adsorbent’s surface. Achieving a higher adsorption capacity requires appropriate physical and chemical activation procedures. Activated carbon is employed to remove heavy metal ions from wastewater through adsorption. However, due to its high cost, there is a need for a more affordable and readily available alternative. Given that agriculture is the primary occupation in India, a substantial amount of agricultural waste is produced. This waste can be effectively utilized to create low-cost adsorbents. Bio-adsorbents are non-toxic, possess higher mechanical strength, and have superior regenerative abilities, which further reduce the cost of the wastewater treatment process. This research focuses on utilizing dehydrated and carbonized Coconut Husk Powder, Sugarcane Bagasse Powder, and Banana Peel Powder.
III. OBJECTIVE OF RESEARCH
- The objectives of treating dairy wastes are, to investigate the organic waste pollution from the dairy industry that may pollute fresh water and influence the aquatic environment.
- Reducing COD and Oil and Grease of Dairy Effluent collected from the outlet of Fat removal Tank (DECOFRT) using low-cost agricultural adsorbents.
- Determining the effect on pH of DECOFRT when it is mixed with dehydrated and carbonized Coconut Husk Powder, Sugarcane Bagasse Powder, and Banana Peel Powder before and after the filter.
- Reduce the organic content of the wastewater, removing organic matter by adsorption techniques and optimization of operating parameters such as adsorbents dosage and particle size.
IV. METHODOLOGY
Sugarcane bagasse was collected from a local sugarcane juice seller, Bananas were bought from a local banana shop and their peels were removed and coconut husk was collected from a local coconut vendor. The magnetic stirrer was used to stir the samples at 100 rpm. The pH of the samples was measured using a digital pH meter of Eutech instruments Ph 700 model. Chemical Oxygen Demand (COD) was calculated using the COD reactor of Hanna instruments model HI 839800 and the photometer model Spectroquant Pharo 100. Oil and Grease were measured using a separating funnel, with petroleum ether as a solvent and anhydrous sodium sulphate.
Two methods were used to reduce COD and Oil and Grease of Dairy Effluent: -
A. De-hydrated Method
The banana peels, sugarcane bagasse, and coconut husk were allowed to dry under sunlight for 6 hours and a colour change of banana peel from yellow to brownish black was observed. No colour change was observed in sugarcane bagasse and coconut husk. These banana peels, sugarcane bagasse, and coconut husk were cut into small pieces with the help of scissor and hand, washed with distilled water to remove dirt and suspended impurities and then dried for 48 hours in an oven at 125oC to remove the moisture content from them. After the drying process, the banana peels, sugarcane bagasse, and coconut husk pieces were removed from the oven and kept in the desiccators for 30 minutes. The desiccators contain calcium chloride (CaCl2) which is used to cool and maintain a dry environment then the pieces were ground to a fine powder using a mixer grinder and sieved through 90μm, 150μm, 300μm sieves for different particle sizes and were collected in different boxes. These dehydrated powders were directly used as biosorbents in the experimental investigations.
B. Carbonization Method
The banana peels, sugarcane bagasse, and coconut husk were allowed to dry under sunlight for 6 hours. These banana peels, sugarcane bagasse, and coconut husk were cut into small pieces with the help of scissor and hand, washed with distilled water to remove dirt and suspended impurities, and then dried for 48 hours in an oven at 125oC to remove the moisture content from the peels. After the drying process, the peels, bagasse, and coconut husk were removed from the oven and kept in the desiccators for 30 minutes and then the dried pieces were kept in the furnace for 2 hours at 200oC to convert them into carbon. Ceramic pots were used to keep the dried peels, bagasse and coconut husk in the furnace to avoid burning them. After that, they were removed, cooled and ground to a fine powder using a mixer grinder and sieved through 90μm, 150μm, and 300μm sieves for different particle sizes and collected in different boxes. These carbonized powders were directly used as biosorbents in the experimental investigations.
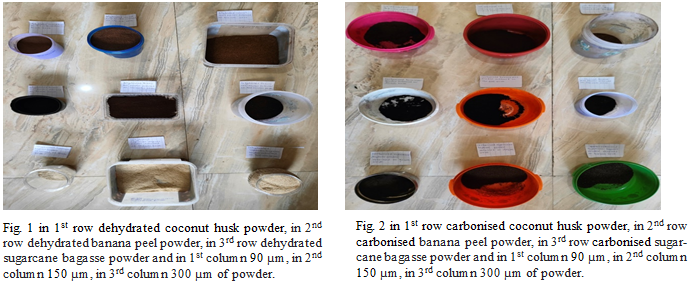
After the dehydrated powders and carbonized powders of 90μm, 150μm, and 300μm particle size were prepared these procedures were followed for experimental investigations: -
I took 2gm and 3gm powder from 90 µm DBPP (Dehydrated Banana Peel Powder). I took 2gm and 3gm powder from 150 µm DBPP, and 2 gm and 3 gm from 300 µm CBPP (Carbonised Banana Peel Powder). I took 2gm of 300 µm dehydrated banana peel powder and 2gm powder from 150 µm carbonised banana peel powder. I took 1gm and 2gm powder from 90 µm CBPP and 1 gm powder from 150 µm CBPP. I took 0.5gm and 0.8 gm powder from 90 µm CBPP. Then I took 0.5gm and 0.8 gm powder from 150 µm CBPP. Then I took 0.5gm and 0.8 gm powder from 150 µm CBPP. Then I took 0.5gm and 0.8 gm powder from 150 µm DBPP. Then I took 0.2 gm powder from 90 µm DBPP. I took 1gm and 0.6gm powder from 90 µm DSBP (Dehydrated Sugarcane Bagasse Powder), 1gm and 0.6gm from 150 µm DSBP and 1gm and 0.6gm from 300 µm DSBP. I took 0.5gm and 1gm powder from 90 µm CSBP (Carbonised Sugarcane Bagasse Powder), 0.5gm and 0.8gm powder from 150 µm CSBP, and 0.5gm and 0.8gm powder from 300 µm CSBP. I took 0.5gm and 0.8gm powder from 90 µm DCHP (Dehydrated Coconut Husk Powder), 0.5gm and 0.8gm powder from 150 µm DCHP and 0.5gm and 0.8gm powder from 300 µm DCHP. I took 0.5gm and 0.8gm powder from 90 µm CCHP (Carbonised Coconut Husk Powder), 0.5gm and 0.8gm powder from 150 µm CCHP, and 0.5gm and 0.8gm powder from 300 µm CCHP. I took 0.2gm CBPP + 0.2gm CSBP + 0.2gm CCHP of 90 µm and mixed them on petridish, 0.2gm DBPP + 0.2gm DSBP + 0.2gm DCHP of 90 µm and mixed them on petridish, 0.2gm CBPP + 0.2gm CSBP + 0.2gm CCHP of 150 µm and mixed them on petridish, 0.2gm DBPP + 0.2gm DSBP + 0.2gm DCHP of 150 µm and mixed them on petridish, 0.2gm CBPP + 0.2gm CSBP + 0.2gm CCHP of 300 µm and mixed them on petridish and 0.2gm DBPP + 0.2gm DSBP + 0.2gm DCHP of 300 µm and mixed them on petridish. Then I took 500 ml beakers and poured 250 ml of dairy effluent collected from the outlet of the fat removal tank into these beakers one by one. The above mentioned powders were added into these beakers one by one.
The solution from these beakers was mixed well using a magnetic stirrer for 10 minutes at 150 rpm. The pH of all these solutions was determined before and after they were filtered. 2.8 ml of the solution was used to find COD and 100 ml from these solutions was used to find Oil and Grease. Also, pH, COD, and Oil and Grease of Dairy Effluent Collected from the Outlet of Fat Removal Tank (DECOFRT) were determined.
V. RESULTS AND DISCUSSION
A. pH of Dairy Effluent collected from Outlet of Fat Removal Tank (DECOFRT) and after mixing DBPP (Dehydrated Banana Peel Powder) and CBPP (Carbonised Banana Peel Powder) into it before and after filtering it with filter paper.
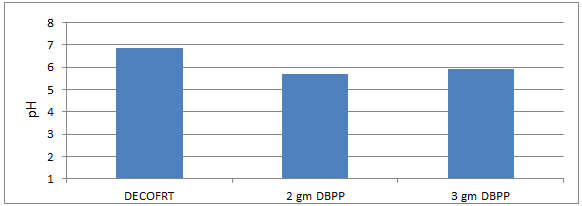
Fig. 5.1: Graph of pH of DECOFRT and after mixing 90 μm of DBPP into it and before filtering it with filter paper.
From Figure 5.1, we can observe that pH lowers when we mix 90 μm of DBPP into DECOFRT. For 2 gm DBPP pH was reduced to 5.68 and for 3 gm DBPP pH was reduced to 5.93 from pH 6.84 which is the pH of Dairy Effluent collected from the Outlet of Fat Removal Tank (DECOFRT).

Fig. 5.2: Graph of pH of DECOFRT and after mixing 150μm, 300μm of DBPP and CBPP into it and before filtering it with filter paper.
From Figure 5.2, we can observe that pH increased when 2 gm 150 μm DBPP was mixed with DECOFRT to 6.72, pH decreased when 3gm 150 μm DBPP was mixed with DECOFRT to 6.25, pH increased when 3gm 300 μm CBPP is mixed with DECOFRT to 7.13 from pH 6.36 which is the pH of DECOFRT.
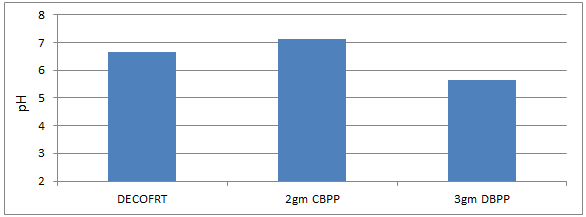
Fig. 5.3: Graph of pH of DECOFRT and after mixing 300μm of DBPP and CBPP into it before filtering it with filter paper.
From Figure 5.3, we can observe that pH increased when 2gm 300 μm CBPP was mixed with DECOFRT to 7.14, pH decreased when 3gm 300 μm DBPP was mixed with DECOFRT to 5.63 from pH 6.64 which is the pH of DECOFRT.
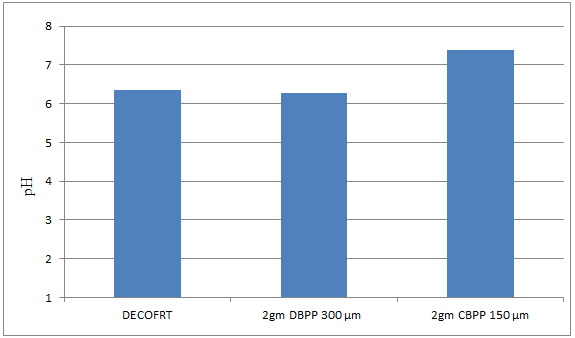
Fig. 5.4: Graph of pH of DECOFRT and after mixing 300μm of DBPP and 150 μm CBPP into it before filtering it with filter paper.
From Figure 5.4, we can observe that pH decreased when 2gm 300 μm DBPP was mixed with DECOFRT to 6.27, pH increased when 2gm 150 μm CBPP was mixed with DECOFRT to 7.39 from pH 6.36 which is the pH of DECOFRT.
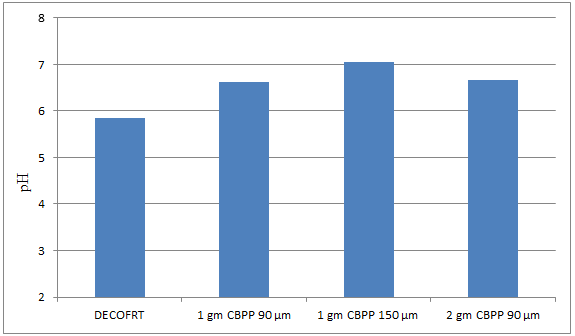
Fig. 5.5: Graph of pH of DECOFRT and after mixing 90 μm and 150 μm of CBPP into it before filtering it with filter paper
From Figure 5.5, we can observe that pH increased when 1 gm CBPP 90 μm is mixed with DECOFRT to 6.63, pH increased when 1 gm CBPP 150 μm is mixed with DECOFRT to pH 7.06, pH increased when 2 gm CBPP 90 μm is mixed with DECOFRT to 6.66 from pH 5.84 which is the pH of DECOFRT.
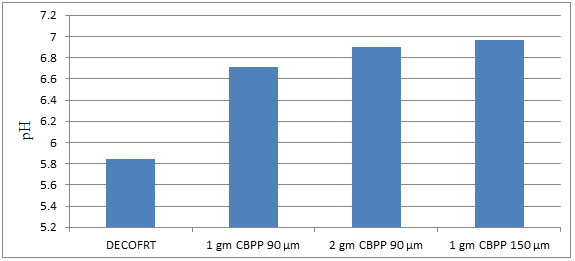
Fig. 5.6: Graph of pH of DECOFRT and after mixing 90 μm and 150 μm of CBPP into it after filtering it with filter paper.
From Figure 5.6, we can observe that pH increased when 1 gm CBPP 90 μm is mixed with DECOFRT to 6.71, pH increased when 1 gm CBPP 150 μm is mixed with DECOFRT to pH 6.97, pH increased when 2 gm CBPP 90 μm is mixed with DECOFRT to 6.90 from pH 5.84 which is the pH of DECOFRT. For these observations, the pH was checked of the mix after the mix was filtered through filter paper.
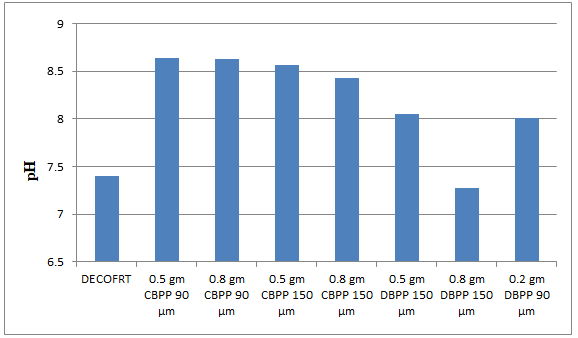
Fig. 5.7: Graph of pH of DECOFRT and after mixing 90 μm, 150 μm of CBPP and DBPP into it before filtering it with filter paper.
From Figure 5.7, we can observe that pH increased when 0.5 gm CBPP 90 μm is mixed with DECOFRT to 8.64, pH increased when 0.5 gm CBPP 150 μm is mixed with DECOFRT to pH 8.63, pH increased when 0.8 gm CBPP 90 μm is mixed with DECOFRT to 8.56, pH increased when 0.8 gm CBPP 150 μm is mixed with DECOFRT to 8.43, pH increased when 0.5 gm DBPP 150 μm is mixed with DECOFRT to 8.05, pH decreased when 0.8 gm DBPP 150 μm is mixed with DEOFRT to 7.28, pH increased when 0.2 gm DBPP 90 μm is mixed with DECOFRT to 8.01 from pH 7.40 which is the pH of DECOFRT. For these observations, pH was checked before the mix was filtered through filter paper.
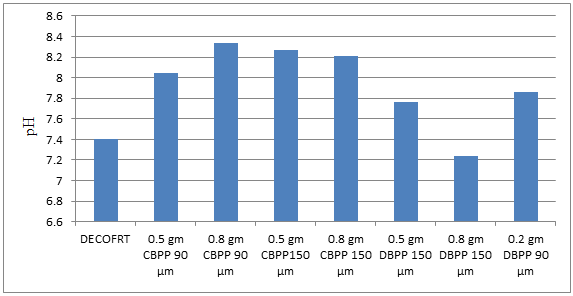
Fig. 5.8: Graph of pH of DECOFRT and after mixing 90 μm, 150 μm of CBPP and DBPP into it after filtering it with filter paper.
From Figure 5.8, we can observe that pH increased when 0.5 gm CBPP 90 μm is mixed with DECOFRT to 8.05, pH increased when 0.5 gm CBPP 150 μm is mixed with DECOFRT to pH 8.34, pH increased when 0.8 gm CBPP 90 μm is mixed with DECOFRT to 8.27, pH increased when 0.8 gm CBPP 150 μm is mixed with DECOFRT to 8.21, pH increased when 0.5 gm DBPP 150 μm is mixed with DECOFRT to 7.76, pH decreased when 0.8 gm DBPP 150 μm is mixed with DECOFRT to 7.24, pH increased when 0.2 gm DBPP 90 μm is mixed with DECOFRT to 7.86 from pH 7.40 which is the pH of DECOFRT. For these observations, pH was checked after the mix was filtered through filter paper.
B. pH of Dairy Effluent collected from Outlet of Fat Removal Tank (DECOFRT) and after mixing DSBP (Dehydrated Sugarcane Bagasse Powder) and CSBP (Carbonised Sugarcane Bagasse Powder) into it before and after filtering it with filter paper.
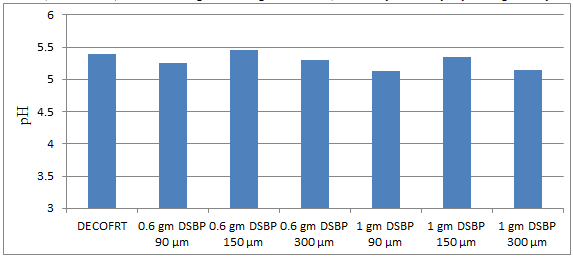
Fig. 5.9: Graph of pH of DECOFRT and after mixing 90 μm, 150 μm and 300 μm of DSBP into it before filtering it with filter paper.
From Figure 5.9, we can observe that pH decreased when 0.6 gm DSBP 90 μm is mixed with DECOFRT to 5.25, pH increased when 0.6 gm DSBP 150 μm is mixed with DECOFRT to pH 5.45, pH decreased when 0.6 gm DSBP 300 μm is mixed with DECOFRT to 5.30, pH decreased when 1 gm DSBP 90 μm is mixed with DEOFRT to 5.13, pH decreased when 1 gm DSBP 150 μm is mixed with DECOFRT to 5.34, pH decreased when 1 gm DSBP 300 μm is mixed with DECOFRT to 5.15 from pH 5.39 which is the pH of DECOFRT. For these observations, pH was checked after the mix was filtered through filter paper.
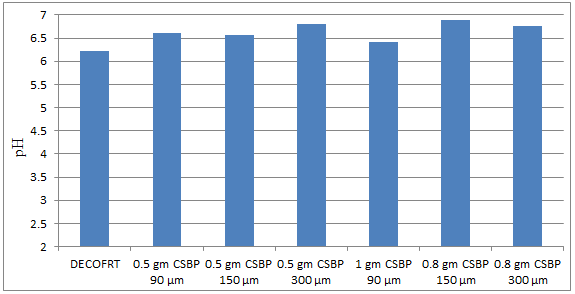
Fig. 5.10: Graph of pH of DECOFRT and after mixing 90 μm, 150 μm and 300 μm of CSBP into it before filtering it with filter paper.
From Figure 5.10, we can observe that pH increased when 0.5 gm CSBP 90 μm is mixed with DECOFRT to 6.60, pH increased when 0.5 gm CSBP 150 μm is mixed with DECOFRT to pH 6.56, pH increased when 0.5 gm CSBP 300 μm is mixed with DECOFRT to 6.80, pH increased when 1 gm CSBP 90 μm is mixed with DECOFRT to 6.42, pH increased when 0.8 gm CSBP 150 μm is mixed with DECOFRT to 6.88, pH increased when 0.8 gm CSBP 300 μm is mixed with DECOFRT to 6.77 from pH 6.22 which is the pH of DECOFRT.
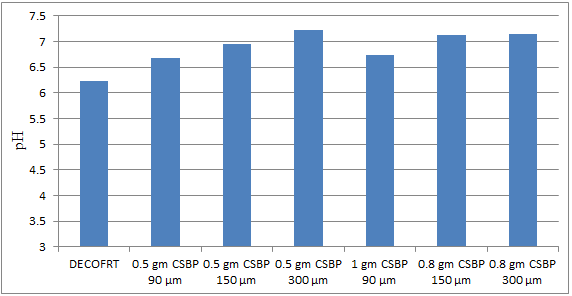
Fig. 5.11: Graph of pH of DECOFRT and after mixing 90 μm, 150 μm and 300 μm of CSBP into it after filtering it with filter paper.
From Figure 5.11, we can observe that pH increased when 0.5 gm CSBP 90 μm is mixed with DECOFRT to 6.68, pH increased when 0.5 gm CSBP 150 μm is mixed with DECOFRT to pH 6.95, pH increased when 0.5 gm CSBP 300 μm is mixed with DECOFRT to 7.22, pH increased when 1 gm CSBP 90 μm is mixed with DECOFRT to 6.73, pH increased when 0.8 gm CSBP 150 μm is mixed with DEOFRT to 7.12, pH increased when 0.8 gm CSBP 300 μm is mixed with DECOFRT to 7.14 from pH 6.22 which is the pH of DECOFRT. For these observations, pH was checked after the mix was filtered through filter paper.
C. pH of Dairy Effluent collected from Outlet of Fat Removal Tank (DECOFRT) and after mixing DCHP (Dehydrated Coconut Husk Powder) and CCHP (Carbonised Coconut Husk Powder) into it before and after filtering it with filter paper.
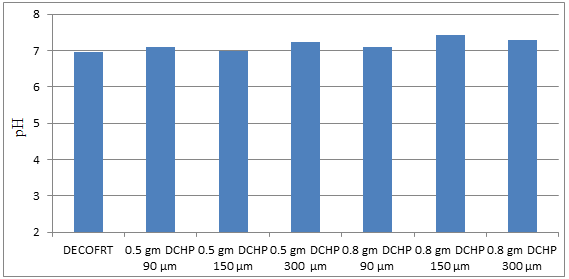
Fig. 5.12: Graph of pH DECOFRT and after mixing 90 μm, 150 μm and 300 μm of DCHP into it before filtering it with filter paper.
From Figure 5.12, we can observe that pH increased when 0.5 gm DCHP 90 μm is mixed with DECOFRT to 7.11, pH increased when 0.5 gm DCHP 150 μm is mixed with DECOFRT to pH 7.0, pH increased when 0.5 gm DCHP 300 μm is mixed with DECOFRT to 7.24, pH increased when 0.8 gm DCHP 90 μm is mixed with DEOFRT to 7.10, pH increased when 0.8 gm DCHP 150 μm is mixed with DECOFRT to 7.44, pH increased when 0.8 gm DCHP 300 μm is mixed with DECOFRT to 7.30 from pH 6.95 which is the pH of DECOFRT. For these observations, pH was checked before the mix was filtered through filter paper.
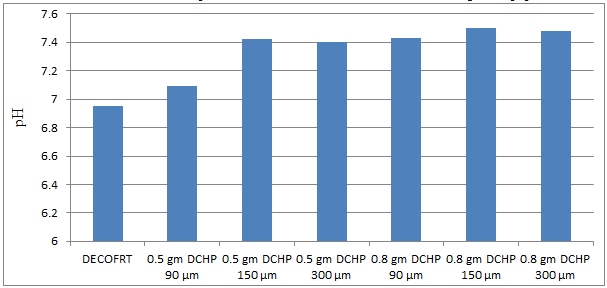
Fig. 5.13: Graph of pH of DECOFRT and after mixing 90 μm, 150 μm and 300 μm of DCHP into it after filtering it with filter paper.
From Figure 5.13, we can observe that pH increased when 0.5 gm DCHP 90 μm is mixed with DECOFRT to 7.09, pH increased when 0.5 gm DCHP 150 μm is mixed with DECOFRT to pH 7.42, pH increased when 0.5 gm DCHP 300 μm is mixed with DECOFRT to 7.40, pH increased when 0.8 gm DCHP 90 μm is mixed with DECOFRT to 7.43, pH increased when 0.8 gm DCHP 150 μm is mixed with DECOFRT to 7.50, pH increased when 0.8 gm DCHP 300 μm is mixed with DECOFRT to 7.48 from pH 6.95 which is the pH of DECOFRT. For these observations, pH was checked after the mix was filtered through filter paper.
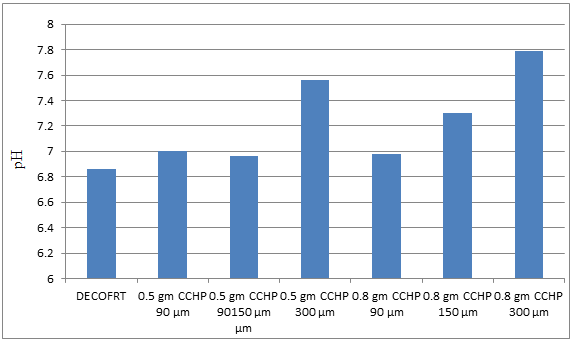
Fig. 5.14: Graph of pH of DECOFRT and after mixing 90 μm, 150 μm and 300 μm of CCHP into it before filtering it with filter paper.
From Figure 5.14, we can observe that pH increased when 0.5 gm CCHP 90 μm is mixed with DECOFRT to 7.0, pH increased when 0.5 gm CCHP 150 μm is mixed with DECOFRT to pH 6.96, pH increased when 0.5 gm CCHP 300 μm is mixed with DECOFRT to 7.56, pH increased when 0.8 gm CCHP 90 μm is mixed with DECOFRT to 6.98, pH increased when 0.8 gm CCHP 150 μm is mixed with DECOFRT to 7.30, pH increased when 0.8 gm CCHP 300 μm is mixed with DECOFRT to 7.30 from pH 6.86 which is the pH of DECOFRT. For these observations, pH was checked before the mix was filtered through filter paper.
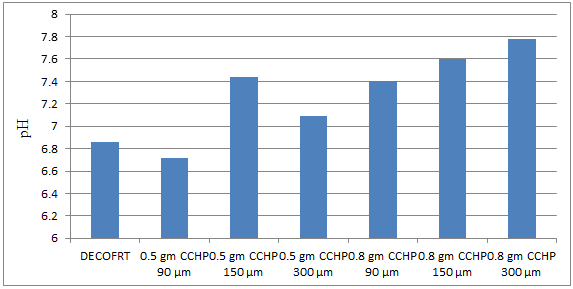
Fig. 5.15: Graph of pH of DECOFRT and after mixing 90 μm, 150 μm and 300 μm of CCHP into it after filtering it with filter paper.
From Figure 5.15, we can observe that pH decreased when 0.5 gm CCHP 90 μm is mixed with DECOFRT to 6.72, pH increased when 0.5 gm CCHP 150 μm is mixed with DECOFRT to pH 7.44, pH increased when 0.5 gm CCHP 300 μm is mixed with DECOFRT to 7.09, pH increased when 0.8 gm CCHP 90 μm is mixed with DECOFRT to 7.40, pH increased when 0.8 gm CCHP 150 μm is mixed with DECOFRT to 7.60, pH increased when 0.8 gm CCHP 300 μm is mixed with DECOFRT to 7.78 from pH 6.86 which is the pH of DECOFRT. For these observations, pH was checked after the mix was filtered through filter paper.
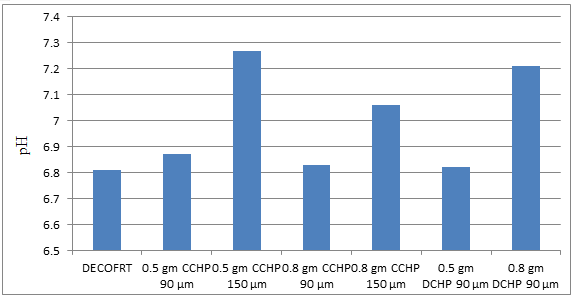
Fig. 5.16: Graph of pH DECOFRT and after mixing 90 μm, 150 μm of CCHP and DCHP into it before filtering it with filter paper.
From Figure 5.16, we can observe that pH increased when 0.5 gm CCHP 90 μm is mixed with DECOFRT to 6.87, pH increased when 0.5 gm CCHP 150 μm is mixed with DECOFRT to pH 7.27, pH increased when 0.8 gm CCHP 90 μm is mixed with DECOFRT to 6.83, pH increased when 0.8 gm CCHP 150 μm is mixed with DECOFRT to 7.06, pH increased when 0.5 gm DCHP 90 μm is mixed with DECOFRT to 6.82, pH increased when 0.8 gm DCHP 90 μm is mixed with DECOFRT to 7.21 from pH 6.81 which is the pH of DECOFRT. For these observations, pH was checked before the mix was filtered through filter paper.
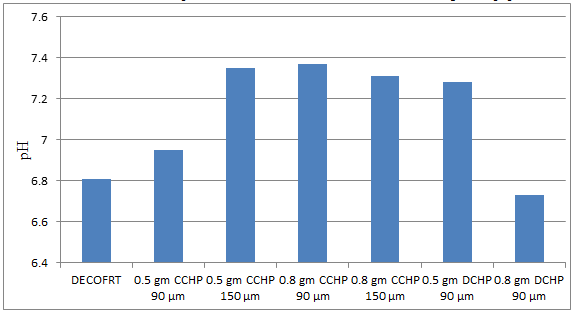
Fig. 5.17: Graph of pH of DECOFRT and after mixing 90 μm, 150 μm of CCHP and DCHP into it after filtering it with filter paper.
From Figure 5.17, we can observe that pH increased when 0.5 gm CCHP 90 μm is mixed with DECOFRT to 6.95, pH increased when 0.5 gm CCHP 150 μm is mixed with DECOFRT to pH 7.35, pH increased when 0.8 gm CCHP 90 μm is mixed with DECOFRT to 7.37, pH increased when 0.8 gm CCHP 150 μm is mixed with DECOFRT to 7.31, pH increased when 0.5 gm DCHP 90 μm is mixed with DEOFRT to 7.28, pH decreased when 0.8 gm DCHP 90 μm is mixed with DECOFRT to 6.73 from pH 6.81 which is the pH of DECOFRT. For these observations, pH was checked before the mix was filtered through filter paper.
D. pH of Dairy Effluent collected from Outlet of Fat Removal Tank (DECOFRT) and after mixing 0.2 gm CBPP + 0.2 gm CSBP + 0.2 gm CCHP and 0.2 gm DBPP + 0.2 gm DSBP + 0.2 gm DCHP into it before and after filtering it with filter paper
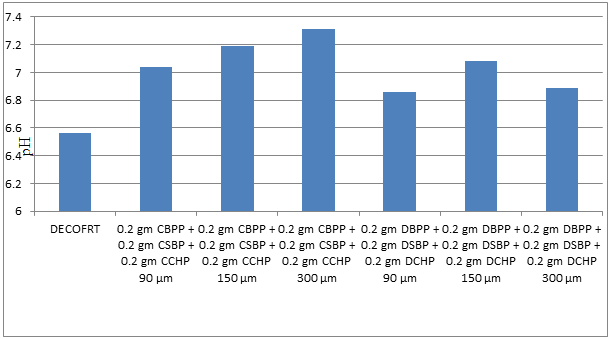
Fig. 5.18: Graph of pH of DECOFRT and after mixing 90 μm, 150 μm and 300 μm of CBPP, CSBP, CCHP and 90 μm, 150 μm and 300 μm of DBPP, DSBP, and DCHP into it after filtering it with filter paper.
From Figure 5.18, we can observe that pH increased when 0.2 gm CBPP + 0.2 gm CSBP + 0.2 gm CCHP 90 μm is mixed with DECOFRT to 7.04, pH increased when 0.2 gm CBPP + 0.2 gm CSBP + 0.2 gm CCHP 150 μm is mixed with DEOFRT to pH 7.19, pH increased when 0.2 gm CBPP + 0.2 gm CSBP + 0.2 gm CCHP 300 μm is mixed with DEOFRT to 7.31, pH increased when 0.2 gm DBPP + 0.2 gm DSBP + 0.2 gm DCHP 90 μm is mixed with DECOFRT to 6.86, pH increased when 0.2 gm DBPP + 0.2 gm DSBP + 0.2 gm DCHP 150 μm is mixed with DEOFRT to 7.08, pH increased when 0.2 gm DBPP + 0.2 gm DSBP + 0.2 gm DCHP 300 μm is mixed with DEOFRT to 6.89 from pH 6.56 which is the pH of DECOFRT. For these observations, pH was checked before the mix was filtered through filter paper.
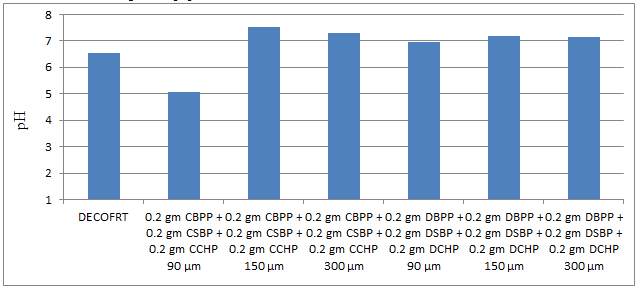
Fig. 5.19: Graph of pH of DECOFRT and after mixing 90 μm, 150 μm and 300 μm of CBPP, CSBP, CCHP and 90 μm, 150 μm and 300 μm of DBPP, DSBP, and DCHP into it after filtering it with filter paper.
From Figure 5.19, we can observe that pH decreased when 0.2 gm CBPP + 0.2 gm CSBP + 0.2 gm CCHP 90 μm is mixed with DECOFRT to 5.05, pH increased when 0.2 gm CBPP + 0.2 gm CSBP + 0.2 gm CCHP 150 μm is mixed with DECOFRT to pH 7.54, pH increased when 0.2 gm CBPP + 0.2 gm CSBP + 0.2 gm CCHP 300 μm is mixed with DECOFRT to 7.30, pH increased when 0.2 gm DBPP + 0.2 gm DSBP + 0.2 gm DCHP 90 μm is mixed with DECOFRT to 6.96, pH increased when 0.2 gm DBPP + 0.2 gm DSBP + 0.2 gm DCHP 150 μm is mixed with DEOFRT to 7.18, pH increased when 0.2 gm DBPP + 0.2 gm DSBP + 0.2 gm DCHP 300 μm is mixed with DECOFRT to 7.14 from pH 6.56 which is the pH of DECOFRT. For these observations, pH was checked after the mix was filtered through filter paper.
E. Oil and Grease of Dairy Effluent collected from the Outlet of Fat Removal Tank (DECOFRT) and after mixing DBPP (Dehydrated Banana Peel Powder) and CBPP (Carbonised Banana Peel Powder) into it after filtering it with filter paper
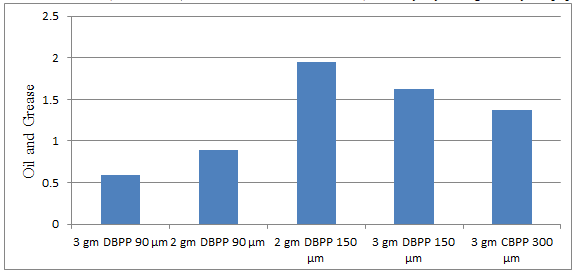
Fig. 5.20: Graph of Oil and Grease of DECOFRT after mixing 90 μm, 150 μm and 300 μm of DBPP and CBPP into it after filtering it with filter paper.
From Figure 5.20, we can observe the lowest that O & G i.e. 0.584 mg/lit. was observed when 3 gm DBPP 90 μm was used as compared to other powders in the graph. The O & G decreased by powder in descending order is as follows: - 3 gm DBPP 90 μm > 2 gm DBPP 90 μm > 3 gm CBPP 300 μm > 3 gm DBPP 150 μm > 2 gm DBPP 150 μm.
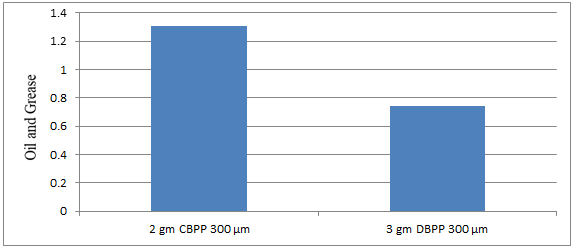
Fig. 5.21: Graph of Oil and Grease of DECOFRT after mixing 300 μm of DBPP and CBPP into it after filtering it with filter paper.
From Figure 5.21, we can observe that when 2 gm CBPP and 3 gm DBPP were mixed in DECOFRT the maximum O & G was removed by 3 gm DBPP.
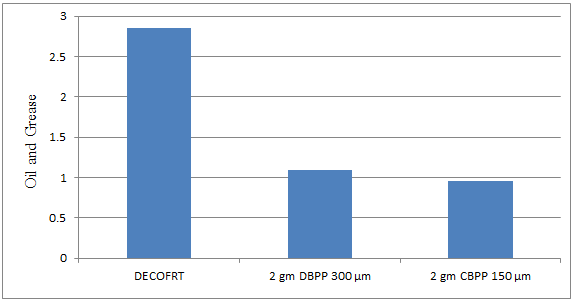
Fig. 5.22: Graph of Oil and Grease of DECOFRT and after mixing 150 μm, 300 μm of DBPP and CBPP into it after filtering it with filter paper.
From Figure 5.22, we can observe that when 2 gm DBPP 300 μm and 2 gm CBPP 150 μm was used O & G was reduced of DECOFRT from 2.85 mg/lit. to 1.098 and 0.953 mg/lit. respectively. 2 gm CBPP 150 μm reduced more O & G than 2 gm DBPP 300 μm.
The O & G reduced by 2 gm DBPP 300 μm is 61.403% and by 2 gm CBPP 150 μm is 69.1228%.
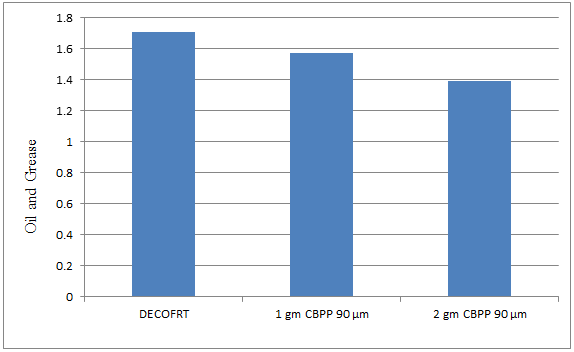
Fig. 5.23: Graph of Oil and Grease of DECOFRT and after mixing 90 μm of CBPP into it after filtering it with filter paper.
From Figure 5.23, we can observe that when 1 gm CBPP 90 μm and 2 gm CBPP 90 μm was used O & G was reduced of DECOFRT from 1.706 mg/lit. to 1.574 and 1.388 mg/lit. respectively. 2 gm CBPP 90 μm reduced more O & G than 1 gm CBPP 90 μm.
The O & G reduced by 1 gm CBPP 90 μm is 7.7374% and by 2 gm CBPP 90 μm is 18.64%.
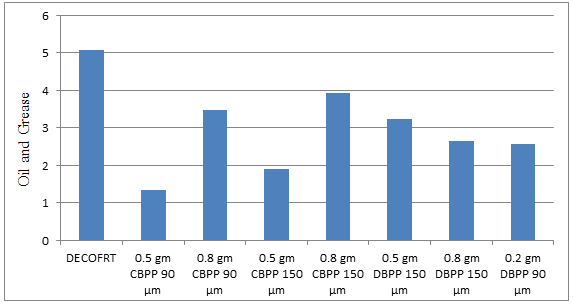
Fig. 5.24: Graph of Oil and Grease of DECOFRT and after mixing 90 μm, 150 μm of CBPP and DBPP into it after filtering it with filter paper.
From Figure 5.24 we can observe that maximum O & G is removed when 0.5 gm CBPP 90 μm is used. The O & G decreased by powder in descending order is as follows: - 0.5 gm CBPP 90 μm > 0.5 gm CBPP 150 μm > 0.2 gm DBPP 90 μm > 0.8 gm DBPP 150 μm > 0.5 gm DBPP 150 μm >0.8 gm CBPP 90 μm > 0.8 gm CBPP 150 μm.
The O & G reduced by 0.5 gm CBPP 90 μm is 73.6821%, by 0.8 gm CBPP 90 μm is 31.68%, by 0.5 gm CBPP 150 μm is 62.6279%, by 0.8 gm CBPP 150 μm is 22.6593%, by 0.5 gm DBPP 150 μm 36.369%, by 0.8 gm DBPP 150 μm is 48.013%, by 0.2 gm DBPP 90 μm is 49.5082%.
F. Oil and Grease of Dairy Effluent collected from Outlet of Fat Removal Tank (DECOFRT) and after mixing DSBP (Dehydrated Sugarcane Bagasse Powder) and CSBP (Carbonised Sugarcane Bagasse Powder) into it after filtering it with filter paper
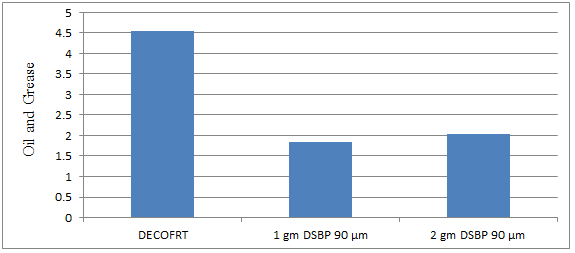
Fig. 5.25: Graph of Oil and Grease of DECOFRT and after mixing 90 μm of DSBP into it after filtering it with filter paper.
From Figure 5.25, we can observe that when 1 gm DSBP 90 μm and 2 gm DSBP 90 μm was used O & G was reduced of DECOFRT from 4.545 mg/lit. to 1.8369 and 2.046 mg/lit. respectively. 1 gm DSBP 90 μm reduced more O & G than 2 gm DSBP 90 μm.
The O & G reduced by 1 gm DSBP 90 μm is 59.5842% and by 2 gm DSBP is 54.9834%.
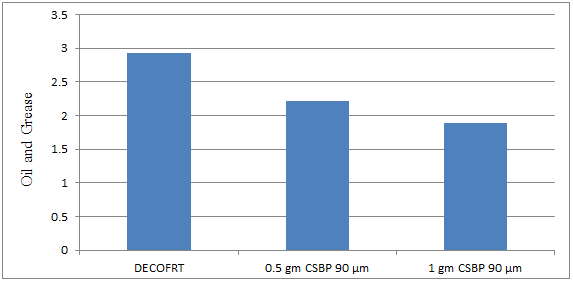
Fig. 5.26: Graph of Oil and Grease of DECOFRT and after mixing 90 μm of CSBP into it after filtering it with filter paper.
From Figure 5.26, we can observe that when 0.5 gm CSBP 90 μm and 1 gm CSBP 90 μm were used O & G was reduced of DECOFRT from 2.921 mg/lit. to 2.21 and 1.885 mg/lit. respectively. 1 gm CSBP 90 μm reduced more O & G than 0.5 gm CSBP 90 μm.
The O & G reduced by 0.5 gm CSBP 90 μm is 24.3409% and by 1 gm CSBP 90 μm is 35.467%.
G. Oil and Grease of Dairy Effluent collected from Outlet of Fat Removal Tank (DECOFRT) and after mixing DCHP (Dehydrated Carbonised Coconut Husk Powder) and CCHP (Carbonised Coconut Husk Powder) into it after filtering it with filter paper
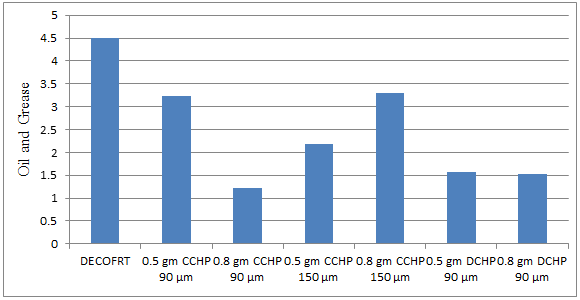
Fig. 5.27: Graph of Oil and Grease of DECOFRT and after mixing 90 μm, 150 μm of CCHP, DCHP into it after filtering it with filter paper.
From Figure 5.27, we can observe that when 0.5 gm CCHP 90 μm, 0.5 gm CCHP 150 μm, 0.8 gm CCHP 90 μm, 0.8 gm CCHP 150 μm, 0.5 gm DCHP 90 μm and 0.8 gm DCHP 90 μm was used O & G was reduced of DECOFRT from 4.49 mg/lit. to 3.232, 2.181, 1.217, 3.29, 1.567, and 1.533 mg/lit. respectively. The O & G decreased by powder in descending order is as follows: - 0.8 gm CCHP 90 μm > 0.8 gm DCHP 90 μm > 0.5 gm DCHP 90 μm > 0.5 gm CCHP 150 μm > 0.5 gm CCHP 90 μm > 0.8 gm CCHP 150 μm.
The O & G reduced by 0.5 gm CCHP 90 μm is 28.0178%, by 0.8 gm CCHP 90 μm is 72.8953%, by 0.5 gm CCHP 150 μm is 51.4254%, 0.8 gm CCHP 150 μm is 26.7261%, by 0.5 gm DCHP 90 μm is 65.1002%, 0.8 gm DCHP 90 μm is 65.8575%.
H. COD of Dairy Effluent collected from Outlet of Fat Removal Tank (DECOFRT) and after mixing DBPP (Dehydrated Banana Peel Powder) and CBPP (Carbonised Banana Peel Powder) into it after filtering it with filter paper
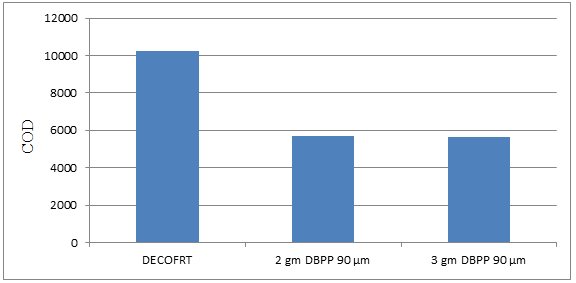
Fig. 5.28: Graph of COD of DECOFRT and after mixing 90 μm of DBPP into it after filtering it with filter paper.
From Figure 5.28, we can observe that when 2 gm DBPP 90 μm and 3 gm DBPP 90 μm were used COD was reduced of DECOFRT from 10250 mg/lit. to 5700 and 5665 mg/lit. respectively. 3 gm DBPP 90 μm reduced more COD than 2 gm DBPP 90 μm.
The COD reduced by 2 gm DBPP 90 μm is 44.3902% and by 3 gm DBPP 90 μm is 44.7317%.
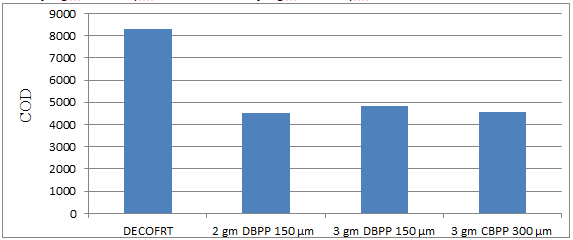
Fig. 5.29: Graph of COD of DECOFRT and after mixing 150 μm, 300 μm of DBPP and CBPP into it after filtering it with filter paper.
From Figure 5.29, we can observe the lowest COD i.e. 4525 mg/lit. was achieved when 2 gm DBPP 150 μm was used as compared to other powders in the graph. The COD decreased by powder in descending order is as follows: - 2 gm DBPP 150 μm > 3 gm CBPP 300 μm > 3 gm DBPP 150 μm.
The COD reduced by 2 gm DBPP 150 μm is 45.4819%, 3 gm DBPP 150 μm is 41.9277%, and 3 gm CBPP 300 μm is 44.7590%.
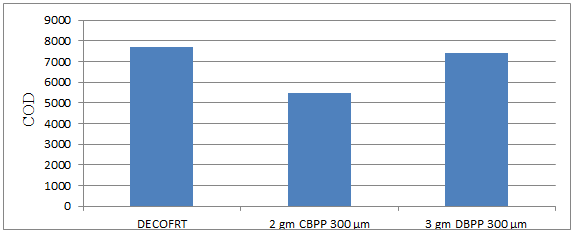
Fig. 5.30: Graph of COD of DECOFRT and after mixing 300 μm of DBPP and CBPP into it after filtering it with filter paper.
From Figure 5.30, we can observe that when 2 gm CBPP 300 μm and 3 gm DBPP 300 μm were used COD was reduced of DECOFRT from 7720 mg/lit. to 5470 and 7415 mg/lit. respectively. 2 gm CBPP 300 μm reduced more COD than 3 gm DBPP 300 μm. The COD reduced by 2 gm CBPP 300 μm is 29.1451% and by 3 gm DBPP 300 μm is 3.9508%.
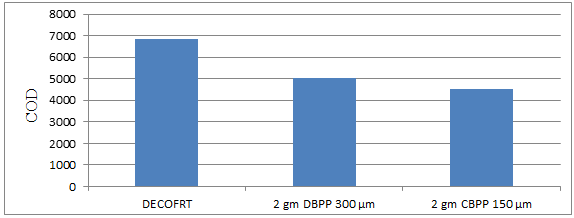
Fig. 5.31: Graph of COD of DECOFRT and after mixing 150 μm, 300 μm of DBPP and CBPP into it after filtering it with filter paper.
From Figure 5.31, we can observe that when 2 gm DBPP 300 μm and 2 gm CBPP 150 μm was used COD was reduced of DECOFRT from 6850 mg/lit. to 5050 and 4540 mg/lit. respectively. 2 gm CBPP 150 μm reduced more COD than 2 gm DBPP 300 μm.
The COD reduced by 2 gm DBPP 300 μm is 26.2774% and by 2 gm CBPP 150 μm is 33.7226%.
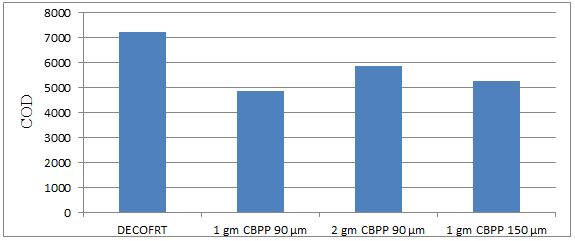
Fig. 5.32: Graph of COD DECOFRT and after mixing 90 μm, 150 μm of CBPP into it after filtering it with filter paper.
From Figure 5.32, we can observe that the lowest COD i.e. 4865 mg/lit. was achieved when 1 gm CBPP 90 μm was used as compared to other powders in the graph. The COD decreased by powder in descending order is as follows: - 1 gm CBPP 90 μm > 1 gm CBPP 150 μm > 2 gm CBPP 90 μm.
The COD reduced by 1 gm CBPP 90 μm is 32.4306%, by 2 gm CBPP 90 μm is 18.8194%, and by 1 gm CBPP 150 μm is 27.1528%.
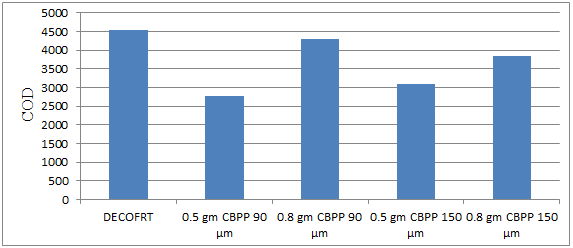
Fig. 5.33: Graph of DECOFRT and after mixing 90 μm, 150 μm of CBPP into it after filtering it with filter paper.
From Figure 5.33, we can observe that the lowest COD i.e. 2765 mg/lit. was achieved when 0.5 gm CBPP 90 μm was used as compared to other powders in the graph. The COD decreased by powder in descending order is as follows: - 0.5 gm CBPP 90 μm > 0.5 gm CBPP 150 μm > 0.8 gm CBPP 150 μm > 0.8 gm CBPP 90 μm.
The COD reduced by 0.5 gm CBPP 90 μm is 39.1639%, by 0.8 gm CBPP 90 μm is 5.2805%, by 0.5 gm CBPP 150 μm is 32.0132%, by 0.8 gm CBPP 150 μm is 15.6216%.
I. COD of Dairy Effluent collected from Outlet of Fat Removal Tank (DECOFRT) and after mixing DSBP (Dehydrated Sugarcane Bagasse Powder) and CSBP (Carbonised Sugarcane Bagasse Powder) into it after filtering it with filter paper
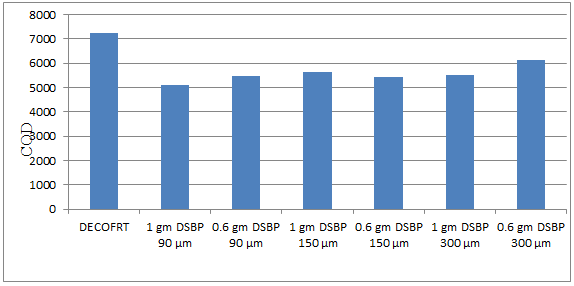
Fig. 5.34: Graph of COD of DECOFRT and after mixing 90 μm, 150 μm, 300 μm of DSBP into it after filtering it with filter paper.
From Figure 5.34, we can observe that the lowest COD i.e. 5085 mg/lit. was achieved when 1 gm DSBP 90 μm was used as compared to other powders in the graph. The COD decreased by powder in descending order is as follows: - 1 gm DSBP 90 μm > 0.6 gm DSBP 150 μm > 0.6 gm DSBP 90 μm > 1 gm DSBP 300 μm > 1 gm DSBP 150 μm > 0.6 gm DSBP 300 μm.
The COD reduced by - 1 gm DSBP 90 μm is 29.910%, 0.6 gm DSBP 150 μm is 25.224%, 0.6 gm DSBP 90 μm is 24.7416%, 1 gm DSBP 300 μm is 23.7491%, 1 gm DSBP 150 μm is 22.1227%, 0.6 gm DSBP 300 μm is 15.2998%.
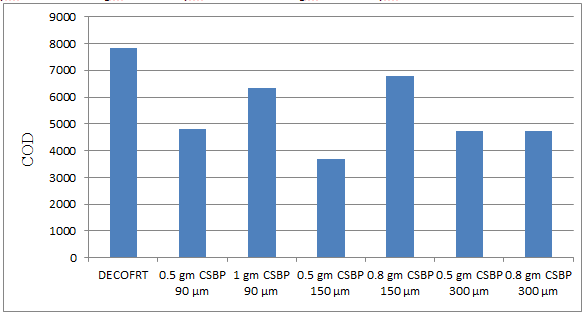
Fig. 5.35: Graph of COD of DECOFRT and after mixing 90 μm, 150 μm, 300 μm of CSBP into it after filtering it with filter paper.
From Figure 5.35, we can observe that the lowest COD i.e. 3680 mg/lit. was achieved when 0.5 gm CSBP 150 μm was used as compared to other powders in the graph. The COD decreased by powder in descending order is as follows: - 0.5 gm CSBP 150 μm > 0.5 gm CSBP 300 μm > 0.8 gm CSBP 300 μm > 0.5 gm CSBP 90 μm > 1 gm CSBP 90 μm > 0.8 gm CSBP 150 μm.
The COD reduced by 0.5 gm CSBP 150 μm is 52.9773%, by 0.5 gm CSBP 300 μm is 39.5604%, by 0.8 gm CSBP 300 μm is 39.4965%, by 0.5 gm CSBP 90 μm is 38.3465%, by 1 gm CSBP 90 μm is 18.7963%, by 0.8 gm CSBP 150 μm is 13.4935%.
J. COD of Dairy Effluent collected from Outlet of Fat Removal Tank (DECOFRT) and after mixing DCHP (Dehydrated Coconut Husk Powder) and CCHP (Carbonised Coconut Husk Powder) into it after filtering it with filter paper
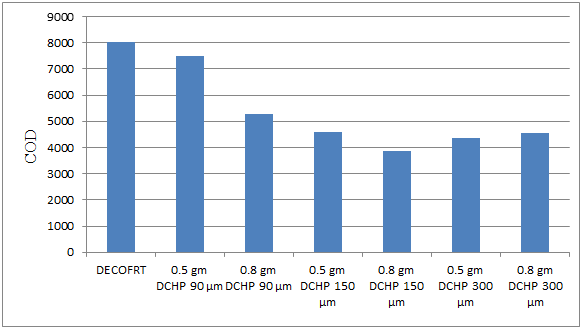
Fig. 5.36: Graph of COD of DECOFRT and after mixing 90 μm, 150 μm, 300 μm of DCHP into it after filtering it with filter paper.
From Figure 5.36, we can observe that the lowest COD i.e. 3875 mg/lit. was achieved when 0.8 gm DCHP 150 μm was used as compared to other powders in the graph. The COD decreased by powder in descending order is as follows: - 0.8 gm DCHP 150 μm > 0.5 gm DCHP 300 μm > 0.8 gm DCHP 300 μm > 0.5 gm DCHP 150 μm > 0.8 gm DCHP 90 μm > 0.5 gm DCHP 90 μm. The COD reduced by 0.8 gm DCHP 150 μm is 51.7735%, by 0.5 gm DCHP 300 μm is 45.7996%, by 0.8 gm DCHP 300 μm is 43.3105%, by 0.5 gm DCHP 150 μm is 42.6882%, by 0.8 gm DCHP 90 μm is 34.2253% and by 0.5 gm DCHP 90 μm is 6.7206%.
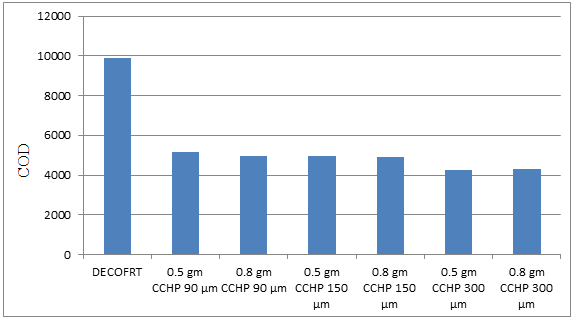
Fig. 5.37: Graph of COD of DECOFRT and after mixing 90 μm, 150 μm, 300 μm of CCHP into it after filtering it with filter paper.
From Figure 5.37, we can observe that the lowest COD i.e. 4260 mg/lit. was achieved when 0.5 gm CCHP 300 μm was used as compared to other powders in the graph. The COD decreased by powder in descending order is as follows: - 0.5 gm CCHP 300 μm > 0.8 gm CCHP 300 μm > 0.8 gm CCHP 150 μm > 0.8 gm CCHP 90 μm > 0.5 gm CCHP 150 μm > 0.5 gm CCHP 90 μm.
The COD reduced by 0.5 gm CCHP 300 μm is 56.8389%, by 0.8 gm CCHP 300 μm is 56.3323%, by 0.8 gm CCHP 150 μm is 50.5066%, by 0.8 gm CCHP 90 μm is 49.9493%, by 0.5 gm CCHP 150 μm is 49.4934% and by 0.5 gm CCHP 90 μm is 47.4671%.
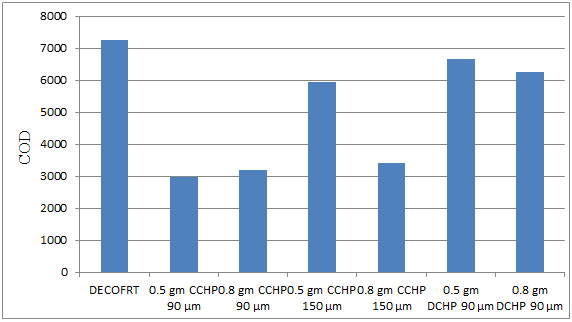
Fig. 5.38: Graph of COD of DECOFRT and after mixing 90 μm, 150 μm of CCHP and 90 μm of DCHP into it after filtering it with filter paper.
From Figure 5.38, we can observe that the lowest COD i.e. 2960 mg/lit. was achieved when 0.5 gm CCHP 90 μm was used as compared to other powders in the graph. The COD decreased by powder in descending order is as follows: - 0.5 gm CCHP 90 μm > 0.8 gm CCHP 90 μm > 0.8 gm CCHP 150 μm > 0.5 gm CCHP 150 μm > 0.8 gm DCHP 150 μm > 0.5 gm DCHP 90 μm.
The COD reduced by 0.5 gm CCHP 90 μm is 59.1724%, by 0.8 gm CCHP 90 μm is 56%, by 0.8 gm CCHP 150 μm is 53.1034%, by 0.5 gm CCHP 150 μm is 17.9310%, by 0.8 gm DCHP 90 μm is 13.9310%, by 0.5 gm DCHP 90 μm is 8%.
K. COD of Dairy Effluent collected from Outlet of Fat Removal Tank (DECOFRT) and after mixing 0.2 gm CBPP + 0.2 gm CSBP + 0.2 gm CCHP and 0.2 gm DBPP + 0.2 gm DSBP + 0.2 gm DCHP into it after filtering it with filter paper
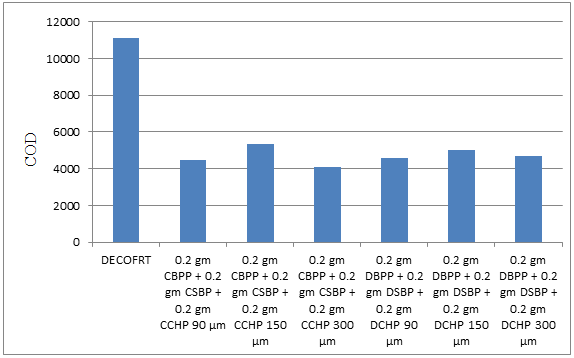
Fig. 5.39: Graph of COD of DECOFRT and after mixing 90 μm, 150 μm, 300 μm of DBPP, DSBP, DCHP and 90 μm, 150 μm, 300 μm of CBPP, CSBP, CCHP into it after filtering it with filter paper.
From Figure 5.39, we can observe that the lowest COD i.e. 4090 mg/lit. was achieved when 0.2 gm CBPP + 0.2 gm CSBP + 0.2 gm CCHP 300 μm was used as compared to other powders in the graph. The COD decreased by powder in descending order is as follows: - 0.2 gm CBPP + 0.2 gm CSBP + 0.2 gm CCHP 300 μm > 0.2 gm CBPP + 0.2 gm CSBP + 0.2 gm CCHP 90 μm > 0.2 gm DBPP + 0.2 gm DSBP + 0.2 gm DCHP 90 μm > 0.2 gm DBPP + 0.2 gm DSBP + 0.2 gm DCHP 300 μm > 0.2 gm DBPP + 0.2 gm DSBP + 0.2 gm DCHP 150 μm > 0.2 gm CBPP + 0.2 gm CSBP + 0.2 gm CCHP 150 μm.
The COD reduced by 0.2 gm CBPP + 0.2 gm CSBP + 0.2 gm CCHP 300 μm is 63.1532%, by 0.2 gm CBPP + 0.2 gm CSBP + 0.2 gm CCHP 90 μm is 59.5495%, 0.2 gm DBPP + 0.2 gm DSBP + 0.2 gm DCHP 90 μm is 58.6486%, by 0.2 gm DBPP + 0.2 gm DSBP + 0.2 gm DCHP 300 μm is 57.7027%, 0.2 gm DBPP + 0.2 gm DSBP + 0.2 gm DCHP 150 μm is 54.9099%, 0.2 gm CBPP + 0.2 gm CSBP + 0.2 gm CCHP 150 μm is 51.8018%.
VI. OBSERVATION
- When 2 gm CBPP 300 μm is used the colour of DECOFRT changed from white to light brown after filtering the mix with filter paper.
- When 3 gm DBPP 300 μm is used the colour of DECOFRT changes from white to dark brown after filtering the mix with filter paper.
- When 2 gm DBPP 300 μm is used the colour changed from white to light brown after filtering the mix with filter paper.
- When 1 gm CBPP 150 μm is used the colour changed from white to light brown after filtering the mix with filter paper.
- When used CSBP not much colour change was observed. When used 0.5 gm CSBP 90 μm the colour changed from white to very light whitish brown after filtering the mix with filter paper. When used 1 gm CSBP 90 μm the colour changed from white to light brown after filtering the mix with filter paper. When used less quantity i.e. 0.5 gm very less colour change was observed and when used more quantity slightly more colour change was observed.
- Not much colour change was observed when DCHP of 0.5gm, 0.8 gm of 90, 150, and 300 μm were added into DECOFRT after the filter. When 0.5 gm DCHP 90 μm were mixed colour changed from white to very light brownish white. When 0.8 gm DCHP was mixed colour change from white to brownish white was observed. When used less quantity i.e. 0.5 gm very less colour change was observed and when used more quantity slightly more colour change was observed.
- When used 0.5 gm CCHP 90 μm colour change from whitish to whitish light brown i.e. not much colour change was observed. When used 0.8 gm from white to light brown colour was observed.
- When used 0.5 gm CCHP 150 μm not much colour change was observed colour changed from white to light brown but it was darker than when used 90 μm CCHP 0.5 gm.
- When used 0.2 gm CBPP + 0.2 gm CSBP + 0.2 gm CCHP i.e. when used carbonized not much colour change was observed. The colour changed from whitish black to light brown.
- When used 0.2 gm DBPP + 0.2 gm DSBP + 0.2 gm DCHP i.e. when used dehydrated more colour change was observed the colour changed from whitish black to brown.
- When used dehydrated powder darker colour change was observed as compared to when used carbonised powder. When used carbonised powder not much colour change was observed.
- When more quantity was used darker colour change was observed as compared to when used less quantity of powder in both dehydrated and carbonised powder.
Conclusion
A. Summary and Conclusion The removal of organic substances from dairy wastewater using de-hydration and carbonization methods for banana peels; sugarcane bagasse and coconut husk was studied by investigating the effect of adsorbent dosage and particle size. The carbonization method is found to be more efficient than the de-hydration method in reducing both COD and Oil and Grease. The carbonization method is considered to be better since carbon is a strong oxidant and has a unique pores structure which adsorbs the organic substances to its surface easily The Coconut Husk Powder was found to be more efficient in reducing COD in both methods. The optimum pH for both methods, banana peels, sugarcane bagasse and coconut husk are found to be in a range between pH 6-8. The optimum adsorbent dosage for COD reduction for the dehydration method of Coconut Husk Powder is 0.8 gm/250 ml, for sugarcane bagasse is 1 gm/250 ml, and for banana peel is at 2gm/250 ml. The optimum adsorbent dosage for COD reduction for the carbonization method of Coconut Husk Powder is 0.5 gm/250 ml, for sugarcane bagasse is 0.5 gm/250 ml, and for banana peel is 0.5gm/250 ml. The optimum particle size for COD reduction for the dehydration method of Coconut Husk Powder is 150 ?m, for sugarcane bagasse is 90 ?m, and for banana peel is 150 ?m. The optimum particle size for COD reduction for the carbonization method of Coconut Husk Powder is at 90 ?m, for sugarcane bagasse is at 150 ?m, and for banana peel is 300 ?m. The optimum adsorbent dosage for Oil and Grease reduction for the dehydration method of Coconut Husk Powder is 0.8 gm/250 ml, for sugarcane bagasse is 1 gm/250 ml, and for banana peel is 2gm/250ml. The optimum adsorbent dosage for Oil and Grease reduction for the carbonization method of Coconut Husk Powder is 0.8 gm/250ml, for sugarcane bagasse is 1gm/250 ml, and for banana peel is at 0.5gm/250ml. The optimum particle size for Oil and Grease reduction for the dehydration method of Coconut Husk Powder is 90 ?m, for sugarcane bagasse is at 90 ?m, and for banana peel is 150 ?m. The optimum particle size for Oil and Grease reduction for the carbonization method of Coconut Husk Powder is 90 ?m, for sugarcane bagasse is 90 ?m, and for banana peel is at 90 ?m. Dehydrated Coconut Husk Powder of 90 ?m 0.8 gm was found to be more efficient while reducing Oil and Grease in the dehydration method while in the carbonization method, 0.5 gm CBPP 90 ?m was found to be more efficient. The highest percentage removal of COD was found when mixed all powder is 63.1532% which was obtained when used 0.2 gm CBPP + 0.2 gm CSBP + 0.2 gm CCHP 300 ?m. The highest percentage removal of COD in the dehydration method was found when used 0.8 gm DCHP 150 ?m which is 51.7735% and in the carbonization method was found when used 0.5 gm CCHP 90 ?m which is 59.1724%. The highest percentage removal of Oil and Grease in the dehydration method was found when used 0.8 gm DCHP 90 ?m which is 65.8575% and in the carbonization method was found when used 0.5 gm CBPP 90 ?m which is 73.6821%. Thus, from this study, it is observed that we can use low-cost adsorbents such as Coconut Husk, Sugarcane bagasse and Banana peels for the treatment of Dairy Effluent and reduce COD and Oil and Grease of effluent significantly. B. Scope for Future Works In this study, we mixed DECOFRT with dehydrated and carbonised Banana Peel Powder, Sugarcane Bagasse Powder, and Coconut Husk Powder for 10 min. at 150 rpm with the help of a magnetic stirrer in future work we can change the mixing time, rpm to get optimum contact time and optimum rpm to reduce Oil and Grease and COD. We can experiment to check the effect on BOD of DECOFRT due to various agricultural adsorbents. Also, we can physically or chemically modify agricultural byproducts as adsorbents by using a modifying agent such as Citric acid, KMnO4, HCl, NaOH, etc to check the effect of them on reducing COD, BOD, Oil and Grease of Dairy Effluent.
References
[1] Abass O. Alade (2011). “Removal of oil and grease as emerging pollutants of concern (EPC) in wastewater stream.” IIUM Engineering Journal, Special Issue on Biotechnology: Vol. 12, No. 4. [2] Abdur Rahman, F., Akter, M. and Abedin, M.Z., International Journal of Scientific & Technology Research., 2013,2(9), 47 – 50. [3] Acharya, J., Kumar, U. & Rafi, P.M. 2018 Removal of heavy metal ions from wastewater by chemically modified agricultural waste material as potential adsorbent-a review. Int. J. Curr. Eng. Technol. 8, 526–530. [4] Ajith Hebbar H, Jayantha K.S (2013). “Oil and Grease Removal from Wastewater Using Laterite as an Adsorbent Material.” International Journal of Emerging Technology and Advanced Engineering, Volume 3, Issue [5] Baisali Sarkar, PP Chakrabarti, A Vijaykumar (2006). “Wastewater Treatment in Dairy Industries-Possibility of reuse”, www.sciencedirect.com/science,volume 195, issues 1-3 [6] Bhatnagar, A., Vilar, V.J.P., Botelho, C.M.S., Boaventura, R.A.R., 2010. Coconut-based biosorbents for water treatment – a review of the recent literature. Advances in Colloid and Interface Science 160, 1–15. [7] C. Namasivayam, M.V. Sureshkumar, Removal of chromium (VI) from water and wastewater using surfactant modified coconut coir pith as biosorbent, Bioresource Technology 99 (2008) 2218–2225. [8] Dubey ES, Joshi YP. Characterization and treatment of ice cream industry wastewater using UASB reactor. Int J New Technol Sci Eng 2015; 2:69 77. [9] D. Mohan, K.P. Singh, Single and multi-component adsorption of cadmium and zinc using activated carbon derived from bagasse-an agricultural waste, Water Res. 36 (2002) 2304–2318. [10] Kanawade, S.M. & Gaikwad, R.W., International Journal of Chemical Engineering and Applications, 2011, 2(3):202 – 206. [11] Nouri, L., Ghodbane, I., Hamdaoui, O. & Chiha, M. 2007 Batch sorption dynamics and equilibrium for the removal of cadmium ions from aqueous phase using wheat bran. J. Hazard. Mater. 149, 115–125 [12] Sheetal S. Karale (2012). “Dairy Waste Water Treatment Using Coconut Shell Activated Carbon and Laterite as Low-cost Adsorbents” [13] Trevor J. Britz and Corne van Schalkwyk (2006). “Treatment of Dairy Processing Wastewaters”, Tailor and Francis group. [14] Uttarini Prathak (2015). “Treatment of Wastewater from a Dairy Industry using Rice Husk as Adsorbent” [15] World Health Organization, Environmental management. [Online]. Available from: http://www.who.int/denguecontrol/controlstrategies/environmentalmanagement/en/2014.
Copyright
Copyright © 2024 Aditya P. Mankar, Dr. S. R. Bhagat. This is an open access article distributed under the Creative Commons Attribution License, which permits unrestricted use, distribution, and reproduction in any medium, provided the original work is properly cited.

Download Paper
Paper Id : IJRASET64243
Publish Date : 2024-09-15
ISSN : 2321-9653
Publisher Name : IJRASET
DOI Link : Click Here
 Submit Paper Online

