Ijraset Journal For Research in Applied Science and Engineering Technology
- Home / Ijraset
- On This Page
- Abstract
- Introduction
- Conclusion
- References
- Copyright
Analysis of Reinforced Concrete Structure Subjected to Blast Load
Authors: Praneeth C, Dr. P. Anuradha
DOI Link: https://doi.org/10.22214/ijraset.2024.64240
Certificate: View Certificate
Abstract
The research focuses on a specific standoff distance of 15m & 20m , a critical parameter in blast analysis, to gain a understanding of the building\'s behavior under static loading conditions of blast load weight of 150kgs & 100kgs of TNT. To simulate realistic scenarios, the models are subjected to appropriate boundary conditions, including foundation constraints to account for the building\'s interaction with the ground. The blast load is assigned as joint loads, considering the standoff distance of the blast from the source. The standoff distance significantly influences the building\'s response to the blast, with profound implications for structural integrity and security. The Analysis of the Bare frame with blast load added as Joint Load, the deflection is controlled by adding Shear walls along various location along the periphery & core for 10 Story RCC Structures. The analysis is conducted using linear time history analysis (Response Spectrum Analysis) within ETABS, capturing the response of the building. Roof Displacement, Base Shear, Story Drift, Stiffness, Time period & Modal participation mass ratios are monitored during the analysis. The outcomes of this study contribute valuable insights into the structural responses of buildings to blast loads at specific standoff distances. This research advances our understanding of blast effects on buildings thereby enhancing the security and resilience of vital infrastructure in the face of evolving threats.
Introduction
I. INTRODUCTION
A blast load is the force applied to a structure or object by a blast wave. It includes overpressure, which is the increase in pressure above atmospheric pressure caused by the shock wave, and either impulse or duration, causing severe damage to both the exterior and interior of the building. The damage caused by the force of an explosive blast is referred to as the blast effect. Explosions generate large amounts of hot gases that compress surrounding gases, making them move away from the blast source rapidly. The stand-off distance, which is the distance between the blast source and the building, is crucial. The pressure or intensity of the blast wave decreases as it moves away from the source. Buildings with greater standoff distances experience less impact, and it takes less time for the blast wave to reach them. Blast wave propagation curves change based on the pressure and distance from the explosion source. When an explosion's blast wave spreads into the air, it produces a shock front or wave. The entire building faces blast pressure due to the formed shock wave. Analyzing reinforced concrete frame structures is challenging because the impulsive load from an explosion is highly
A. Need of the Present Study
The aim of this research is to establish hypothesis that seismic design of structure could with stand blast. Nevertheless, the outcomes of these studies strongly suggest that a building initially designed or subsequently upgraded to address high seismicity inherently offers a substantial degree of blast resistance. While cost limitations may pose challenges for building owners striving to attain higher protection levels at conventional construction methods, the study's findings provide the approach for designing of the structures with capacity to withstand seismic and blast forces.
II. LITERATURE REVIEW
- Vasilis Karlos, George Solomos et al. (2013) The report provides a simplified procedure for calculating blast loads on structures due to external explosions, aimed at aiding preliminary designs for potential terrorist attacks. It introduces blast wave theory and uses empirical methods for load prediction, supported by graphs and diagrams from authoritative sources to ease understanding. Simplified case studies are also included to demonstrate the load calculation process.
- Megha S. Mahaladkar, Ramya K et al. (2019) A G+5 RCC building subjected to blast loads of 200, 400, and 600 kg of TNT at varying stand-off distances was analyzed in ETABS 2016. Structural responses like displacement, velocity, acceleration, story drift, and column forces were studied for bare frames, frames with shear walls, and braced frames. The building with corner shear walls showed a 53.51% reduction in displacement and a 30.04% reduction in drift, outperforming the braced frame, which reduced displacement by 23.6% and drift by 13%.
- Shreya Vedpathak, Prof. Ajay Hamane et al. (2022) Studied the response of the structure subjected the G+20 RCC building subjected the blast load of 100 & 200 kg of TNT with clear stand-off distance being 20m & 40m. The Story Displacement & Story Drift are studied for the G+20 Model by Increasing the Column and Beam Sizes, By placing Shear walls Along the corner bays, By Placing the Steel Bracing at corner Bays.
- Shobha R, Vinod B R, Anusha P Prabhu, Shubhashree G R, Yaksha V et al. (2020) studied the Response of the G+10 RCC building subjected to the blast load of about 700lbs(318kgs) & 1000lbs(455kgs) with stand-off distances as 5m & 10m. Total of 8 Models are developed with keeping the frame as Regular and Irregular Frame. The blast loads are considered using TM5-1300 Blast Manual, ATBLAST software (To Calculate the Blast Response at various story levels and ETABS is used to perform the Analysis. The paper suggest that the max Story Displacement occurs at Top story level. Irregular Buildings are susceptible to more damage than the Regular Building due to Increase in surface area of irregular buildings. The responses Joint Acceleration vs time, story drift and story displacement at each level are studied.
- Chintan Patel, Prof. Payal Patel et al.(2020) A G+17 story Building is analyzed using Etabs measures to story displacement and story drift are taken by increasing the size of Columns and Beams which only reduced story displacement by about 50% and story drift by about 53%.By adding shear walls to the initial failed building the story displacement has been reduced to 84% and story drift value reduced by 93% , by using steel bracing the story displacement value is reduced to 80% and story drift by 92% . The Paper suggest the usage of shear walls to suppress the blast loading is giving more favorable results compared to steel Bracing.
III. METHODOLOGY
A. General
This chapter deals with the procedures adopted to calculation of blast load and methodology adopted for carrying the dissertation. The steps involved in the Response spectrum analysis in ETABS 21 SOFTWARE is also mentioned in this chapter.
B. Procedure to calculate the Blast load
1) Assumptions
- The blast load assumed is applied on only front elevation of the structure
- The entire elevation is divided in element of size 3m x3m around each beam column joint in Plane of the elevation.
- The structure is analyzed for surface blast with considered weight of explosives as 100 kg of TNT & 150 kg of TNT, with assumed stand off distances being 15m & 20m. The combination of weight of Explosives & stand-off distance are used in calculation of design parameters for Analysis.
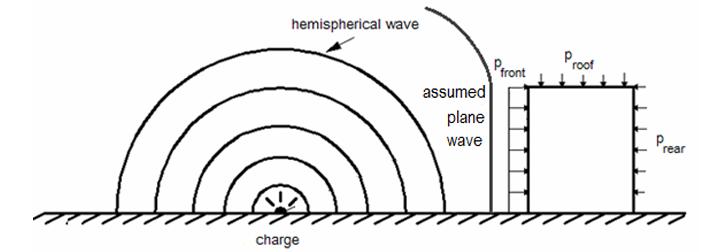
Fig 3.1 Illustration of the type of Blast that is applied on the structure.
Only Positive phase of Blast parameters are considered in study.
2) Calculation of Frontal Blast Parameters
a) Step-1: The charge should be decided.
b) Step-2: The surface is divided into as many small divisions and the loads are applied. It is always best to group the surface sections with common factors.
c) Step-3: Then the Scaled Distance ‘Z’ is found as per the weight of TNT for each finite element is calculated . Scaled Distance Z= Rh /(w)1/3 – (Eq 3.1)
- Rh is the distance of point of interest from source of blast.
- From fig 3.2 the following parameters can be calculated
Peak incident Pressure (Pso)
Reflected Pressure (Pr)
Incident Impulse (is)
Reflected Impulse (ir)
Wave front speed (U)
Duration of the positive phase (to)
Arrival time (tA)
Wave length (Lw).
Note: All these values (except for the pressures and velocities) are scaled to the W1/3. In order to produce their absolute values they should be multiplied by W1/3.
d) Step-4: The idealized Triangular pressure diagrams for the structural surface- sections.
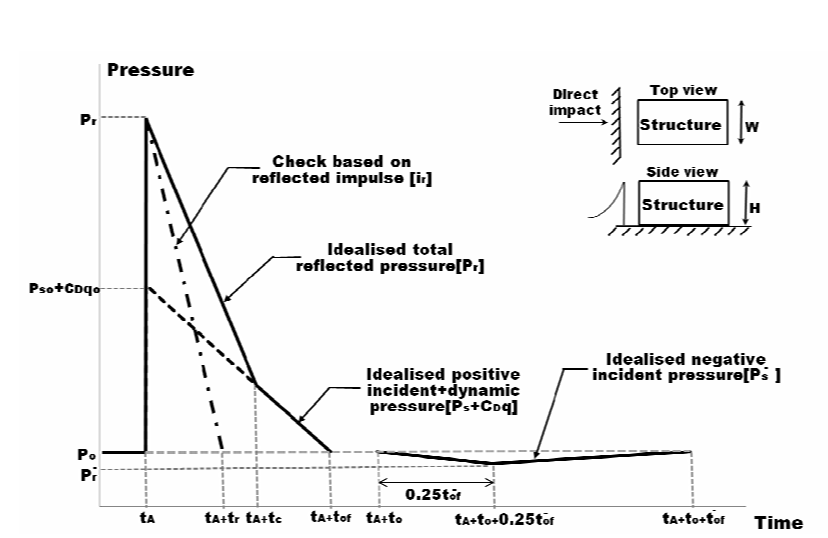
Fig 3.2 Idealized Triangular assumptions of pressure time history on front face of structure.
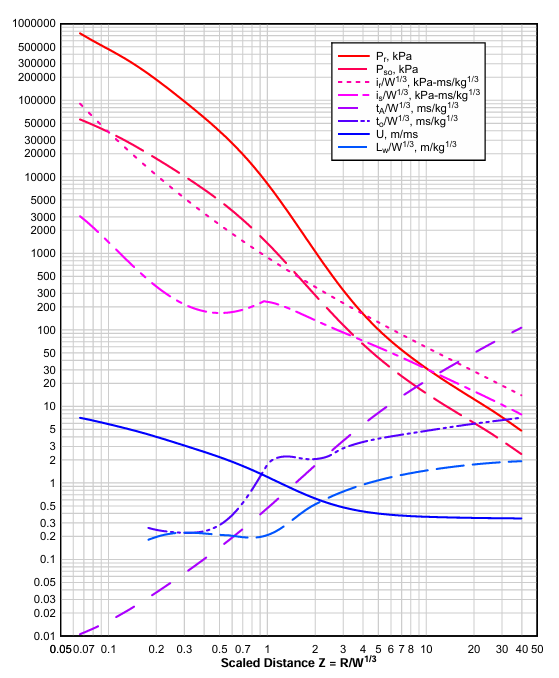
Fig 3.3 Parameters of Positive phase of shock hemispherical wave of TNT charges from surface blasts.
e) Step-5: The get parameters shown in Fig 3.2, tC (Clearing time) is computed.
Clearing Time: tc =4s(1+R)Cr – (Eq 3.2)
where, S is the smallest of the surface’s height H or half width W/2, Cr is the sound velocity in the reflected medium, shown in Figure 3.4 , and R is the ratio of S/G, where G is the largest of the surface’s height H or the half width W/2.
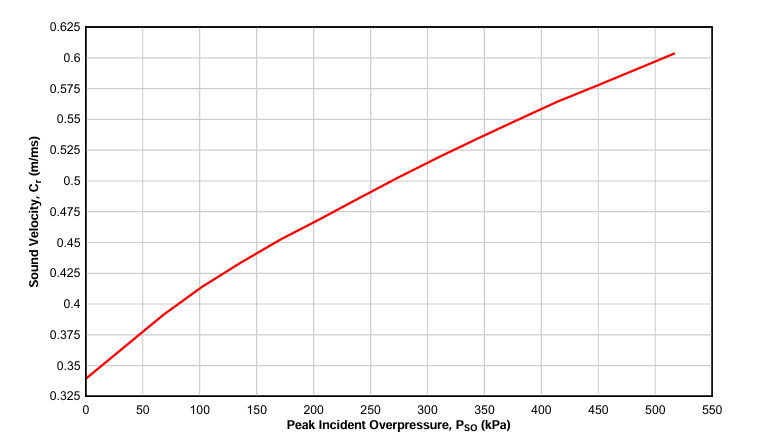
Fig 3.4 Sound Velocity Cr of Positive phase of shock hemispherical wave of TNT charges from surface blasts.
f) Step-6: The other parameters shown
- Fictitious Positive Phase Duration: tof =2isPso
 – (Eq 3.3)
 - Fictitious Duration of Reflected Pressure: trf =2irPro
 – (Eq 3.4)
 - Pso+CDqo is calculated from keeping CD=1 and calculating q0 (Peak Dynamic Pressure) from Fig 3.5.
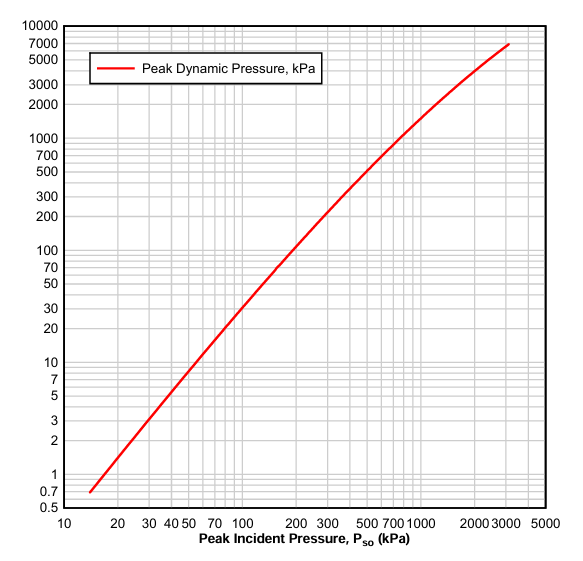
Fig 3.5 Variation of Peak Dynamic Pressure(qo) of shock hemispherical wave of TNT charges from surface blasts.
3) Calculation of Side & Rare Blast Parameters
a) Step-1: As the Blast wave travels first it interacts with the front surface and proceed to the adjacent side walls and roof. This pressures are calculated by considering the point where the side wall or Roof starts. The Reflected Pressure Pr is calculated depending on the formula
PR = CEPsof +CDqof – (Eq 3.5)
- Psof (Incident Over pressure) depends on the distance of source of Blast form starting point of terrace , side wall or Rare Wall. The value of this pressure can be found from Fig 3.3.
- CE (Equivalent Load Factor) is found from the fig 3.6 with corresponding LW/L ratio
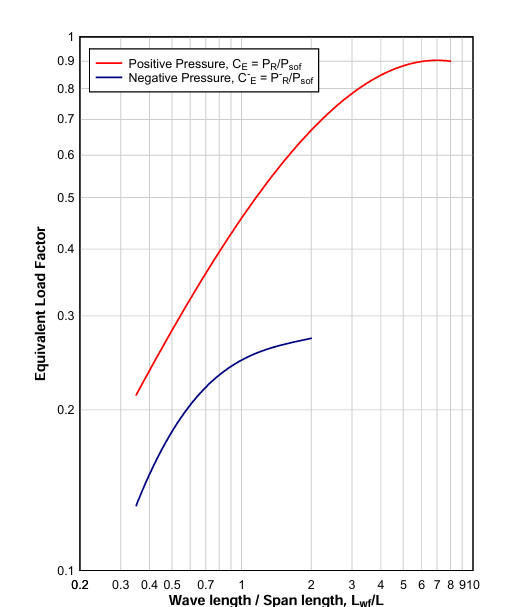
Fig 3.6 Variation of Peak Dynamic Pressure(qo) of shock hemispherical wave of TNT charges from surface blasts.
- qof (Peak Dynamic Overpressure) is calculated for the value of Peak incident over pressure from the Fig 3.5
- CD ( Drag Coefficient ) considered from following Table
|
Peak Dynamic Overpressure (kPa) |
Drag Coefficient |
|
0-170 |
-0.4 |
|
170-350 |
-0.3 |
|
350-900 |
-0.2 |
Table 3.1 CD value corresponding to qof.
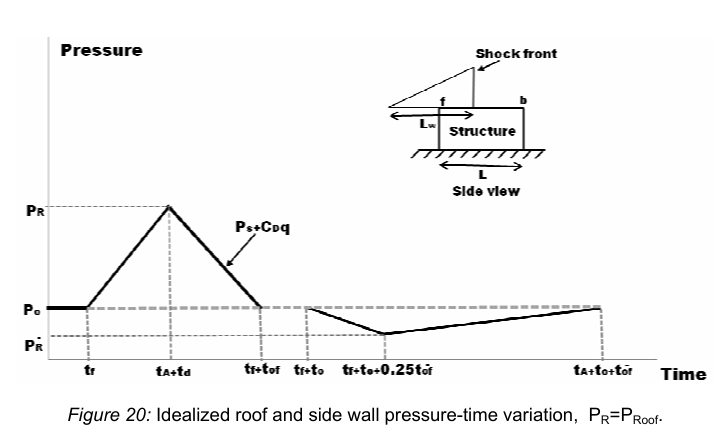
Fig 3.7 Idealized Roof and Side wall Pressure Time History
b) Step-2: Calculation of td (Scaled Rise Time) & tof (Total duration of Pressure)
- td (Scaled Rise Time) is calculated LW/L ratio from Fig 3.8
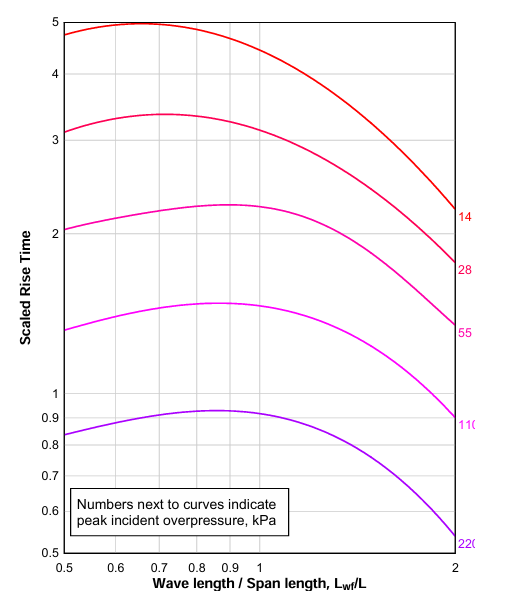
Fig 3.8 Scaled rise time td of positive phase pressure loading for the roof and side-walls of a structure
- tof (Total Duration of Pressure) is calculated LW/L ratio from Fig 3.9
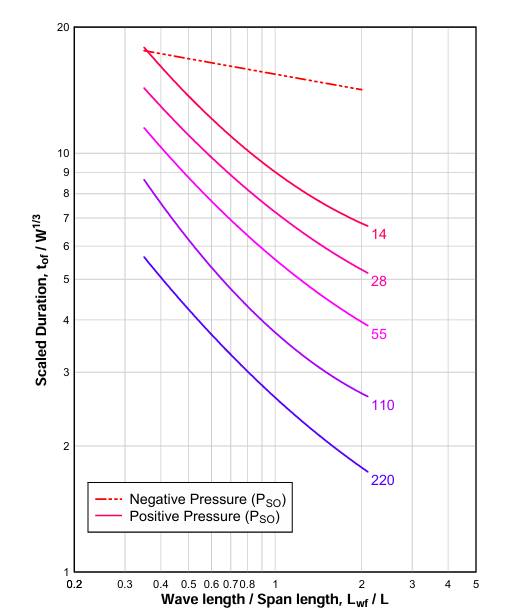
Fig 3.9 Total Duration of Pressure tof of positive phase pressure loading for the roof and side-walls of a structure
A detailed example of how to calculate the blast load parameter for 100kg of TNT at stand off distance of 15m is shown in Appendix section of dissertation.
C. Structural Analysis and Simulation
- Model the selected buildings using structural analysis software ETABS 21.
- The Blast load calculated is applied as static load along each story at every joint.
- Various shear wall orientations are designed as analyzed.
- Apply appropriate seismic parameters for Response Spectrum Analysis to evaluate the Torsional Irregularity, Story displacement, Story shear, Story drift, Time period & Structural stiffness.
D. Evaluation and Comparison
- Performance Assessment: Evaluate the structural performance of the buildings under seismic, blast under considered Dead Load &Live Load.
- Comparative Analysis: Compare the responses of buildings designed primarily for seismic resilience with those incorporating shear walls.
Assess the effectiveness of different design strategies in mitigating the effects of various loadings.
E. Recommendations
Propose possible orientations of shear walls that can commonly resist 100kg & 150kg of TNT.
F. Conclusion
Summarize the key findings and insights gained from the research, emphasizing the significance of building design considerations for seismic, blast Loads. Highlight the implications of the research for the field of structural engineering and the creation of safer, more resilient built environments.
IV. CASE STUDY
A. General
This Chapter provides structural specifications, different cases considered, Load assignments & Load combinations considered & modelling and analysis carried out in ETABS 21 software.
B. Structural Details
In the present study, the G+10 story building is analyzed for the Blast load of 100kg & 150kg of TNT is considered at a stand-off distance of 15m & 20m. The G+10 story building is analyzed for various possible orientations of shear walls. The Plan dimensions of structure considered is 36m x36m.
The material properties, structural details and loading details are considered as per table shown below
|
Materials |
Grade |
|
Concrete |
30 |
|
Rebar |
FE 500 |
|
Density of Concrete |
25 kg/m3 |
|
Density of steel |
78.5 kg/m3 |
Table 4.1 Material Properties
|
Building Type |
RCC |
|
Dimension of Building |
36m x 36m |
|
Story Height (Including bottom story) |
3m |
|
Number of bays along x & y |
6 bays |
|
Size of Beam |
400mm x 450 mm |
|
Size of Column |
700mm x 700 mm |
|
Thickness of Slab |
150mm |
|
Thickness of Shear wall |
250mm |
Table 4.2 Structural Specifications
|
Blast Load |
JRC 32253-2011 |
|
Dead Load |
Member Self Weight |
|
Live Load |
7 kN/m2 |
|
Roof Live Load |
7 kN/m2 |
|
Floor Finish Load |
1.5 kN/m2 |
|
External Wall Load |
14 kN/m |
|
Internal Wall Load |
7 kN/m |
Table 4.3 Loading Details
Load combinations considered as follows:
1) Strength Combinations
- DL+1.5LL
- 1.2 DL+1.2 LL+1.2RSX
- 1.2 DL+1.2LL+ 1.2RSY
- 1.2 DL+1.2 LL-1.2RSX
- 1.2 DL+1.2LL- 1.2RSY
- 1.2 DL+1.2LL+1.2 BLAST
- DL+1.5RSX
- DL+1.5RSY
2) Serviceability Combinations
- 1 DL+1 LL
- 1 DL+1 BL
- 1 DL+0.8 LL+0.8BL
- 0.9 DL+1.5RSX
- 0.9 DL+1.5RSY
- 0.9 DL-1.5RSX
- 0.9 DL-1.5RSY
Wind Loads are not considered as the research is focuses on the Blast & Seismic Loads.
C. Models
A total of 36 Models are considered, With combinations of shear walls and blast loads.
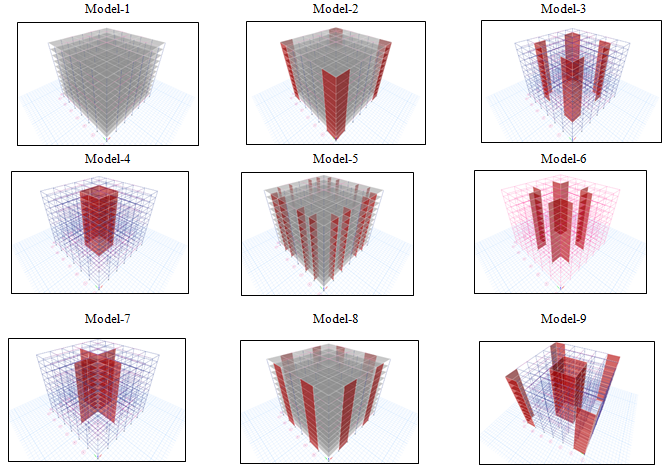
Blast weight as mentioned below
|
100kg of TNT with stand-off distance of 15m |
|
100kg of TNT with stand-off distance of 20m |
|
150kg of TNT with stand-off distance of 15m |
|
150kg of TNT with stand-off distance of 20m |
D. Modeling and Analysis in Etabs
A Grid, Material properties and Section properties
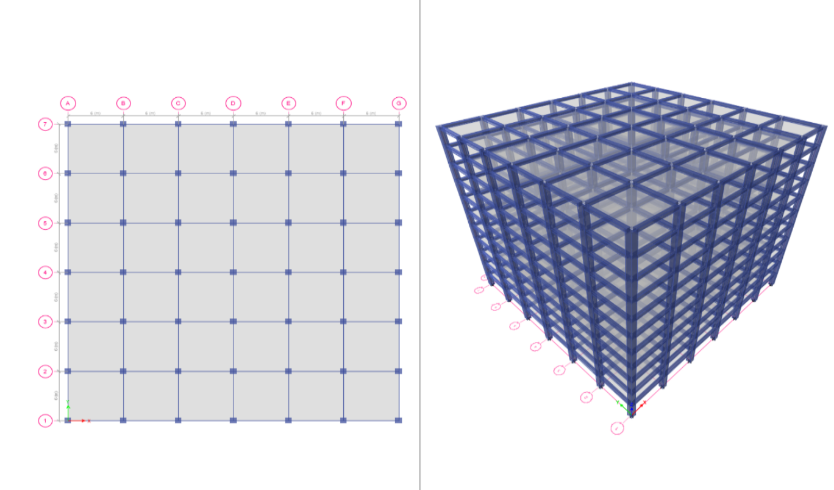
Fig 4.10 Grid considered for Models
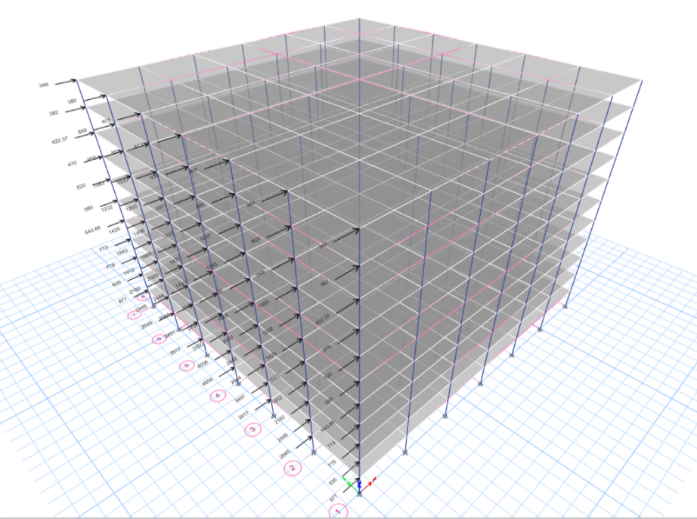
Fig 4.22 Blast load applied in Global-X direction (Frontal Face)
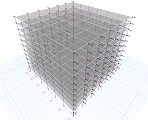
Fig 4.23 Blast load applied in Global-Y direction (Side Face)
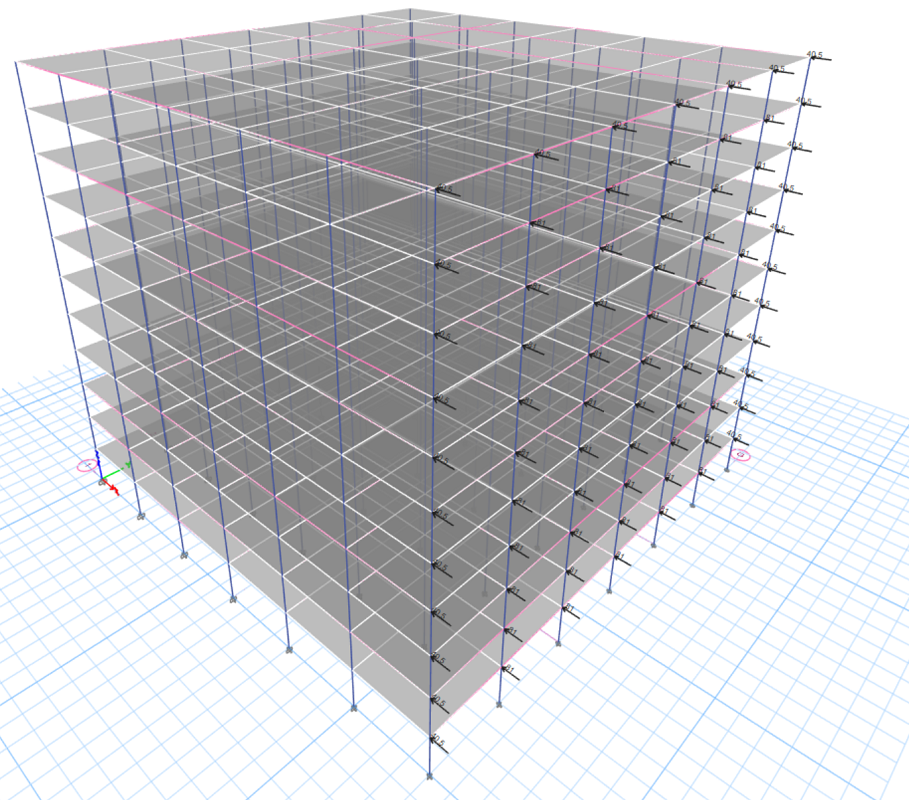
Fig 4.24 Blast load applied in Global-X direction (Rare Face)
V. RESULTS AND DISCUSSIONS
A. General
Response spectrum analysis of G+10 story RCC structure subjected to blast load from TNT explosives of different charge weight and varying standoff distance have been performed. This chapter shows the results obtained from the analysis for a total of 36 models with different structural shear systems adopted to control the response. Subsequent discussions are made on various parameters like Story shears, Story Drift, Story Displacement, Story stiffness, Modal participation factor of first three modes & Time Period are studied.
B. Story Displacement
story displacement is the max displacement of the stories under the action of the lateral and gravitational loads. The following graphs depicts the displacement of the stories under various weight of explosives and stand-off distances for load combination of 1 DL+1 BL.
1) Maximum Story displacement
|
Maximum story displacement (mm) for 100kg of TNT |
||||
|
Stand-off distance |
15m |
20m |
||
|
Model-1 |
1228.90 |
% change |
883.24 |
% change |
|
Model-2 |
154.14 |
87.5 |
111.98 |
87.3 |
|
Model-3 |
149.75 |
87.8 |
108.76 |
87.7 |
|
Model-4 |
64.78 |
94.7 |
46.71 |
94.7 |
|
Model-5 |
408.00 |
66.8 |
296.11 |
66.5 |
|
Model-6 |
149.77 |
87.8 |
108.76 |
87.7 |
|
Model-7 |
57.53 |
95.3 |
41.42 |
95.3 |
|
Model-8 |
207.98 |
83.1 |
151.61 |
82.8 |
|
Model-9 |
46.93 |
96.2 |
33.95 |
96.2 |
Table 5.1 Story displacement for 100kg of TNT
|
Maximum story displacement (mm) for 150kg of TNT |
||||
|
Stand-off distance |
15m |
20m |
||
|
Model-1 |
1491 |
% change |
1132.71 |
% change |
|
Model-2 |
185 |
87.57 |
143.13 |
87.4 |
|
Model-3 |
180 |
87.93 |
139.02 |
87.7 |
|
Model-4 |
63 |
95.80 |
59.82 |
94.7 |
|
Model-5 |
491 |
67.07 |
378.66 |
66.6 |
|
Model-6 |
180 |
87.92 |
139.03 |
87.7 |
|
Model-7 |
70 |
95.33 |
53.06 |
95.3 |
|
Model-8 |
250 |
83.25 |
193.32 |
82.9 |
|
Model-9 |
57 |
96.20 |
43.44 |
96.2 |
Table 5.2 Story displacement for 150kg of TNT
From above graphs and tables it can be observed that:
- The Max displacement is observed at top floor.
- At the stand-off distanced is changed from 15m to 20m in for 100 kg of TNT is about 21.25% .
- At the stand-off distanced is changed from 15m to 20m in for 150 kg of TNT is about 24% .
- At stand-off distance of 15m, when the weight of TNT is increased from 100 to 150 kg of TNT the displacement increased by 17%.
- At stand-off distance of 20m, when the weight of TNT is increased from 100 to 150 kg of TNT the displacement increased by 22%.
- Least Max displacement is observed for Model-9 with increase shear wall other than the rest of the models.
- Out of 8 models with shear walls Model-7 is performing better with same amount of shear walls.
- Model-9 is developed from Analyzing the rest of the models, Model with shear wall at the core & corner.
- Model-2, Model-3 & Model-6 are almost yielding the same results. There is no change in the results if the shear wall are shifted to internal bays or orienting in case of these models.
- The models with shear walls at the core i.e Model-4, Model-7 & Model-9 are performing well for the blast loads.
- Model-8 & Model-9 are the least performing as the shear wall are distributed along the periphery which is not good in resisting the Blast loads.
C. Story Drift
Story drift is the relative displacement between the floors above and/or below the story under consideration. The following graphs depict the variation of drift ratio for each story of the structure when subjected to TNT explosives. for load combination of 1 DL + 1 BL .
|
Maximum story drift for 100kg of TNT |
||||
|
Stand-off distance |
15m |
20m |
||
|
Model-1 |
0.079893 |
% change |
0.046732 |
% change |
|
Model-2 |
0.005229 |
93.45 |
0.003839 |
91.79 |
|
Model-3 |
0.00508 |
93.64 |
0.003729 |
92.02 |
|
Model-4 |
0.002474 |
96.90 |
0.001702 |
96.36 |
|
Model-5 |
0.015942 |
80.05 |
0.01155 |
75.28 |
|
Model-6 |
0.00508 |
93.64 |
0.003729 |
92.02 |
|
Model-7 |
0.00234 |
97.07 |
0.001607 |
96.56 |
|
Model-8 |
0.007201 |
90.99 |
0.00531 |
88.64 |
|
Model-9 |
0.001602 |
97.99 |
0.001158 |
97.52 |
Table 5.3 Story drift for 100kg of TNT
|
Maximum story drift for 150kg of TNT |
||||
|
Stand-off distance |
15m |
20m |
||
|
Model-1 |
0.098869 |
% change |
0.060371 |
% change |
|
Model-2 |
0.006242 |
93.69 |
0.004895 |
91.89 |
|
Model-3 |
0.006063 |
93.87 |
0.004756 |
92.12 |
|
Model-4 |
0.002476 |
97.50 |
0.002208 |
96.34 |
|
Model-5 |
0.01938 |
80.40 |
0.014784 |
75.51 |
|
Model-6 |
0.006064 |
93.87 |
0.004756 |
92.12 |
|
Model-7 |
0.002931 |
97.04 |
0.002085 |
96.55 |
|
Model-8 |
0.008588 |
91.31 |
0.006747 |
88.82 |
|
Model-9 |
0.001942 |
98.04 |
0.001485 |
97.54 |
Table 5.4 Story drift for 150kg of TNT
D. Base Shear
Base Shear is the maximum resistance to the lateral stresses that occur at the Base of the structure due to lateral stresses (Seismic & Blast stresses) at the ground level. This developed resistance at the bottom story is called Base Shear.
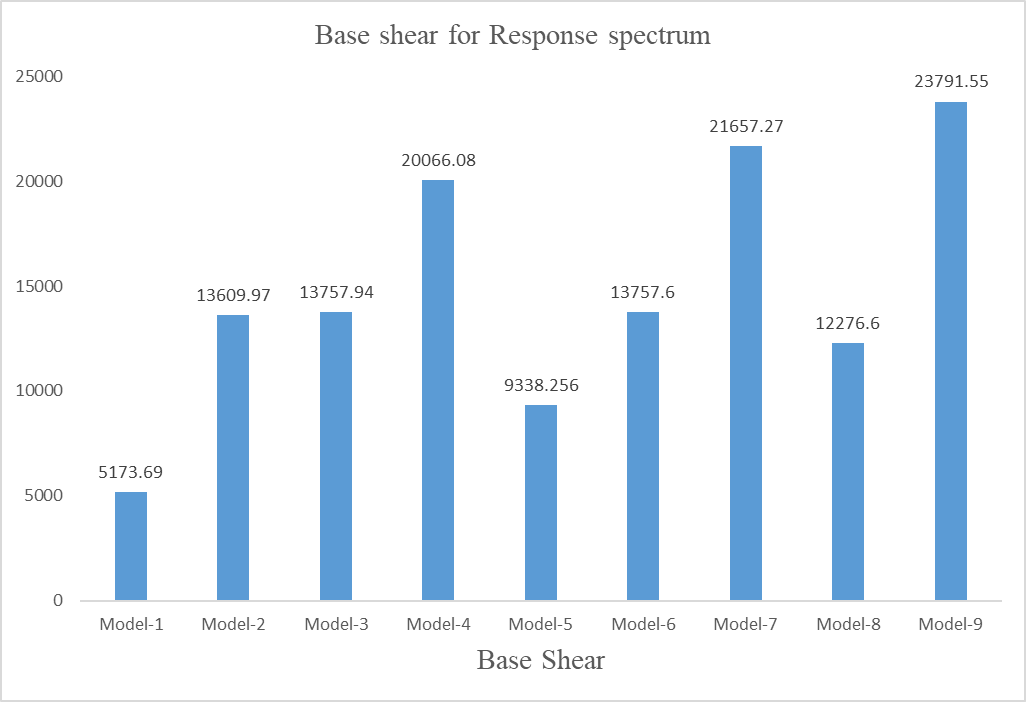
Fig 5.9 Base shear for Response spectrum (RSX)
|
Base shear (kN) |
||
|
Load case |
RSX |
|
|
Model-1 |
5173.69 |
% change |
|
Model-2 |
13609.97 |
61.99 |
|
Model-3 |
13757.94 |
62.39 |
|
Model-4 |
20066.08 |
74.22 |
|
Model-5 |
9338.256 |
44.60 |
|
Model-6 |
13757.6 |
62.39 |
|
Model-7 |
21657.27 |
76.11 |
|
Model-8 |
12276.6 |
57.86 |
|
Model-9 |
23791.55 |
78.25 |
Table 5.5 Base shear for Response spectrum (RSX)
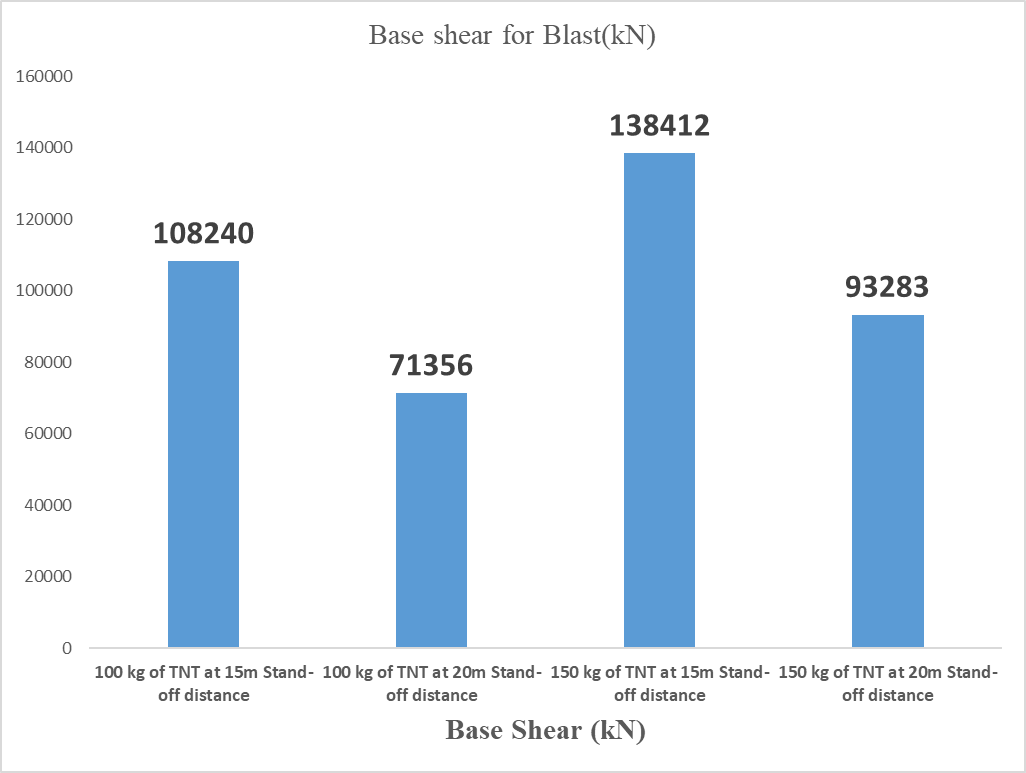 Fig 5.10 Base shear for Blast
|
Base shear (kN) |
|
|
Weight of TNT & Stand-off distance/ Load case |
BLAST |
|
100 kg of TNT at 15m Stand-off distance |
108240 |
|
100 kg of TNT at 20m Stand-off distance |
71356 |
|
150 kg of TNT at 15m Stand-off distance |
138412 |
|
150 kg of TNT at 20m Stand-off distance |
93283 |
Table 5.6 Base shear for Blast Load (Blast)
From above graphs and tables, it can be observed that:
- Model-7 is better performing with increase of about 76.11% of base shear than the bare frame Model.
- With increase of stand-off distance from 15m to 20 m the base shear due to blast has reduced about 32-34%.
- With increasing the Blast weight from 100 to 150kg of TNT the base shear increased by 20-22%.
E. Structural Stiffness
The lateral stiffness of a story is determined by the ratio of story shear to story drift. Essentially, when subjected to lateral loads, a structure has a tendency to deform. To ensure structural stability and prevent the occurrence of a soft story effect, it is crucial for the structure to possess sufficient lateral stiffness.
|
Stiffness (kN/m) |
||
|
Model-1 |
1131785 |
% change |
|
Model-2 |
12010967 |
90.58 |
|
Model-3 |
12082411 |
90.63 |
|
Model-4 |
16184761 |
93.01 |
|
Model-5 |
5439825 |
79.19 |
|
Model-6 |
12082282 |
90.63 |
|
Model-7 |
16754108 |
93.24 |
|
Model-8 |
10612505 |
89.34 |
|
Model-9 |
26675047 |
95.76 |
Table 5.7 Stiffness of Models
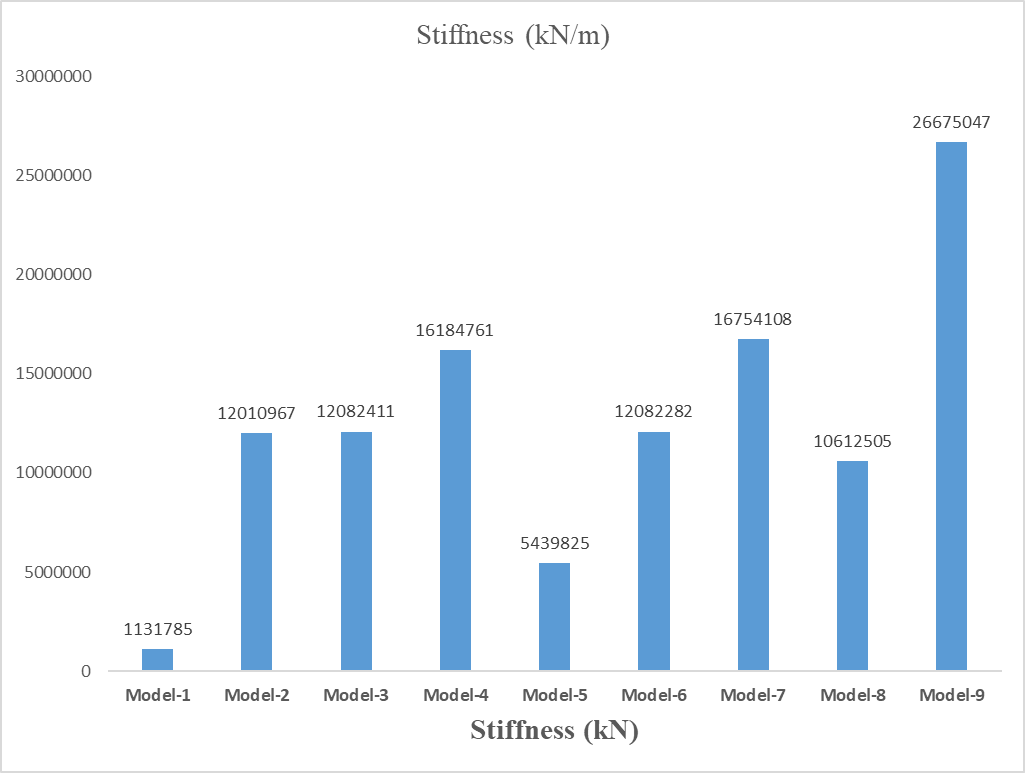
Fig 5.10 Stiffness of Models
From above graphs and tables, it can be observed that:
- Model-7 is having the highest amount of stiffness compared to other models.
- Model-2, 3 and Model-6 are having the same amount of stiffness.
- Shear walls at the core of the Models are showing the best possible stiffness such as the Model-4 & Model-7.
- Model-5 is showing the least stiffness next to Model-1. This shows that the shear wall distributed is not better in stiffness compared to other Models.
- Model-9 which is derived from the other models is suggested for the better performance due to blast loads.
F. Time Period
|
Time Period (sec) |
||
|
Model-1 |
3.366 |
% change |
|
Model-2 |
1.185 |
64.80 |
|
Model-3 |
1.168 |
65.30 |
|
Model-4 |
0.881 |
73.83 |
|
Model-5 |
2.019 |
40.02 |
|
Model-6 |
1.577 |
53.15 |
|
Model-7 |
3.011 |
10.55 |
|
Model-8 |
1.378 |
59.06 |
|
Model-9 |
0.666 |
80.21 |
From above table, it can be observed that:
- Model-9 is having the least time period which differs by 80.21% from Model-1.
- The least the time period the better performing the model.
- Model-2&3 are having relatively the same amount of time period.
- Model-9 is derived from Model-4 which id 73.83% better than the Model-1.
- Model-7 has the best performance in all the above factors but the in terms of time period it is not the best performing
- Model -4 with the shear walls at the core is the best performing model which is 73.83 % better than Model-1.
G. Modal Participation
Modal analysis or the mode superposition method is a linear dynamic response procedure which evaluate and superimposes free vibration mode shapes to characterize displacement patterns.
|
Modal participation Mass Ratios |
|||||||
|
|
Period(sec) |
UX |
UY |
UZ |
RX |
RY |
RZ |
|
Model-1 |
|
|
|
|
|
|
|
|
Mode-1 |
3.366 |
2.507E-06 |
0.7725 |
0 |
0.2285 |
7.415E-07 |
0 |
|
Mode-2 |
3.366 |
0.7725 |
2.507E-06 |
0 |
7.415E-07 |
0.2285 |
0 |
|
Mode-3 |
3.008 |
0 |
0 |
0 |
0 |
0 |
0.7733 |
|
Model-2 |
|
|
|
|
|
|
|
|
Mode-1 |
1.185 |
0.686 |
3.678E-05 |
0 |
1.728E-05 |
0.3223 |
0 |
|
Mode-2 |
1.185 |
3.678E-05 |
0.686 |
0 |
0.3223 |
1.728E-05 |
0 |
|
Mode-3 |
0.657 |
0 |
0 |
0 |
0 |
0 |
0.6923 |
|
Model-3 |
|
|
|
|
|
|
|
|
Mode-1 |
1.168 |
0.0001 |
0.688 |
0 |
0.3204 |
3.907E-05 |
0 |
|
Mode-2 |
1.168 |
0.688 |
0.0001 |
0 |
3.907E-05 |
0.3204 |
0 |
|
Mode-3 |
0.918 |
0 |
0 |
0 |
0 |
0 |
0.6974 |
|
Model-4 |
|
|
|
|
|
|
|
|
Mode-1 |
0.881 |
0 |
0 |
0 |
0 |
0 |
0.8252 |
|
Mode-2 |
0.767 |
0.7354 |
2.59E-06 |
0 |
9.658E-07 |
0.2743 |
0 |
|
Mode-3 |
0.767 |
2.59E-06 |
0.7354 |
0 |
0.2743 |
9.658E-07 |
0 |
|
Model-5 |
|
|
|
|
|
|
|
|
Mode-1 |
2.019 |
0 |
0 |
0 |
0 |
0 |
0.7173 |
|
Mode-2 |
1.95 |
0.6849 |
0.0197 |
0 |
0.0085 |
0.2965 |
0 |
|
Mode-3 |
1.95 |
0.0197 |
0.6849 |
0 |
0.2965 |
0.0085 |
0 |
|
Model-6 |
|
|
|
|
|
|
|
|
Mode-1 |
1.577 |
0 |
0 |
0 |
0 |
0 |
0.7103 |
|
Mode-2 |
1.168 |
0.0011 |
0.687 |
0 |
0.3199 |
0.0005 |
0 |
|
Mode-3 |
1.168 |
0.687 |
0.0011 |
0 |
0.0005 |
0.3199 |
0 |
|
Model-7 |
|
|
|
|
|
|
|
|
Mode-1 |
3.011 |
0 |
0 |
0 |
0 |
0 |
0.7732 |
|
Mode-2 |
0.723 |
2.294E-05 |
0.7454 |
0 |
0.2642 |
8.131E-06 |
0 |
|
Mode-3 |
0.723 |
0.7454 |
2.294E-05 |
0 |
8.131E-06 |
0.2642 |
0 |
|
Model-8 |
|
|
|
|
|
|
|
|
Mode-1 |
1.378 |
0.6765 |
0.0003 |
0 |
0.0001 |
0.3309 |
0 |
|
Mode-2 |
1.378 |
0.0003 |
0.6765 |
0 |
0.3309 |
0.0001 |
0 |
|
Mode-3 |
0.91 |
0 |
0 |
0 |
0 |
0 |
0.6714 |
|
Model-9 |
|
|
|
|
|
|
|
|
Mode-1 |
0.666 |
2.004E-05 |
0.7142 |
0 |
0.2981 |
8.364E-06 |
0 |
|
Mode-2 |
0.666 |
0.7142 |
2.004E-05 |
0 |
8.364E-06 |
0.2981 |
0 |
|
Mode-3 |
0.518 |
0 |
0 |
0 |
0 |
0 |
0.7245 |
From above table, it can be observed that:
- It can be clearly observed that the models with the shear wall closer to the core of the plan is showing the Rotation participation instead of Translation Modes. It is not suggested by the code that the first mode of the modal participation to be Rotational.
- The first three mode participation is greater than 65% for all the models.
- Model-9 is combined with the shear walls at the corner and the core which combines the both Translational & Rotational capabilities.
H. Closure
This chapter presented the various results obtained from the study along with their discussion comparing 100 & 150 kg of TNT with various stand-off distance of 15m & 20m. Response on the basis of various parameters like Story Displacement, Story Drift, Time Period, Base Shear, Stiffness and Modal participation ratios are analyzed.
Conclusion
A. Summary This dissertation investigates the comparison between RCC Bare frame Structure and RCC Shear Wall with various possible orientations in resisting the blast load of TNT and TNT explosive having charge weights of 100kg & 150kg each with the stand-off distance of 15m & 20m, which is calculated from JRC 32253-2011,Structures to Resist the Effects of Accidental Explosions. The investigation is carried out on regular structure having the plan dimensions as 36m x 36m and story height is taken as 3m. The structures a total of 9 models are modelled using ETABS 21 and the analysis carried out is linear Time History Analysis. The Blast load is applied as static loads. It was observed that as the standoff distance increases, the intensity of blast load decreases. Thus the blast load intensity is inversely proportional to standoff distance. B. Conclusions 1) Model-1 which is the model with no shear wall and a bare frame was failing for the application of the Blast loads. 2) Model-9 is the model derived from the Analysis of Model-2 to 8. 3) The Model -9 is derived from the shear wall at core which contribute to the stiffness and the shear wall at the corner which contribute to the Torsional resistance. 4) The Model-9 the displacement by 20-26% decrease in the story displacement just by increasing the stand off distance from 15m to 20m. 5) The displacement increased about 17-22% by increasing the weight of TNT from 100kg to 150 kg. 6) The max displacement is observed at the top most story. 7) There is about 98% story drift decrease from Model-1(Bare frame) to Model-9. 8) Base shear increase about 78.25% from Model-1 to Model-9 due to Response Spectrum. 9) With increase of stand-off distance from 15m to 20 m the base shear due to blast has reduced about 32-34%. 10) With increasing the Blast weight from 100 to 150kg of TNT the base shear increased by 20-22%. 11) There is stiffness increase of about 95.76 percent from Model-1 to Model-9 which contribute to the lease time period which decreased about 80.21% from Model-1 to Model-9. 12) A total of 71.42% mass participation is achieved with Model-9 in translation Modes and 72.45% mass participation is achieved in Rotational modes. C. Limitations 1) Blast load analysis was conducted on a RCC structure with regular plan assuming the shock front to be parallel to the structure. 2) Charge weights are assumed to be placed on ground and reach the structure’s top with full intensity. 3) The building was preliminarily designed to cater for Dead Load and Live load only. Wind loads are not considered in the study as the probability of them occurring simultaneously with blast load is zero. 4) Blast pressures were calculated and applied as Static Load. 5) The structure has fixed base. D. Scope of Future work In this study, blast load analysis is carried out on regular plan RC structure in ETABS 21. Further research can be done on same by considering Plan Irregularity and Vertical irregularity of structure as per IS 1893-2016. Various Soil Conditions and Base isolation as well as sloping ground can also incorporated in the investigation. Instead of RC structure, study can be carried out on Steel and Composite Structure to know how they respond to blast load. Buildings with more number of stories can be inspected, to elaborate this, till what number of stories which type of structure is beneficial and safe can be investigated. Also comparison can be made by considering surface burst, free air burst and air burst explosion for different explosive materials. At last other softwares like ANSYS, ABAQUS and LS-DYNA can be used for the blast load analysis. With considereing the modeling in etabs as the preliminary analysis.
References
[1] Vasilis KARLOS, George SOLOMOS (2013), “Calculation of Blast Loads for Application to Structural Components” , Administrative Arrangement No JRC 32253-2011 with DG-HOME Activity A5 - Blast Simulation Technology Development [2] Megha S. Mahaladkar, Ramya K (2019), “ Analysis of Multi-Storey RC Building Subjected to Blast Load using Time History Method”, International Journal of Innovative Science and Research Technology, ISSN No:-2456-2165. [3] Shreya Vedpathak, Prof. Ajay Hamane (2022) , “BLAST RESISTANT STRUCTURE ANALYSIS”, International Research Journal of Modernization in Engineering Technology and Science, Volume:04/Issue:07/July-2022. [4] Shobha R, Vinod B R, Anusha P Prabhu, Shubhashree G R, Yaksha V (2020), “ Response of Tall Structures Along Face Exposed to Blast Load Applied at Varying Distance” , International Journal of Recent Technology and Engineering (IJRTE) ISSN: 2277-3878 (Online), Volume-9 Issue-1, May 2020. [5] Chintan Patel, Prof. Payal Patel (2020), “ ANALYSIS OF BLAST RESISTANT STRUCTURE”, ISSN: 2455-2631,August 2020 IJSDR ,Volume 5 Issue 8 . [6] Utsav B Tanna, Vishal B Patel, Vishal A Arekar (2022) , “ DYNAMIC EFFECT OF BLAST LOAD” , International Advanced Research Journal in Science, Engineering and Technology, Vol. 9, Issue 5, May 2022. [7] Tanuja Vinchurkar, Hritika Jadhav, Sheetal Hotkar, Riddhi Patel, Sanket Gade (2021), “Analysis of High Rise Building Subjected to Blast and Earthquake Loads for Effective Position of Shear Walls Using ETABS”, IRJET, Volume: 08 Issue: 04 , Apr 2021. [8] Rishabh Joshi , P. R. Maiti (2019), “Transient Effect of Blast Loads on RCC Building”, The Asian Review of Civil Engineering ISSN: 2249 - 6203 Vol.8 No.1, 2019, pp. 9-19. [9] Harish.Pendem, Sukesh Chandana (2021), “Blast Resistance of G+10 Commercial Building With and Without Shear Wall Shape Comparison”,IOP Conf. Series: Materials Science and Engineering 1112 (2021) ,012027. [10] Dan Nourzadeha, Jagmohan Humarb, Abass Braimahb (2017), “ Comparison of Response of Building Structures to Blast Loading and Seismic Excitations”, 6th International Workshop on Performance, Protection & Strengthening of Structures under Extreme Loading, PROTECT2017, 11-12 December 2017, Guangzhou (Canton), China. [11] Mr.Prasad J.Jadhav , Mr.Vikramsinh S. Tiware, Mr. Vivek V. Mane, Mr.Nitish A.Mohite , Mr. Siddhesh Tiwale S (2022), “ Seismic Behaviour and Design of RC Shear Wall using ETABS software”, IJRASET, ISSN: 2321-9653; IC Value: 45.98; SJ Impact Factor: 7.538 Volume 10 Issue VII July 2022. [12] MD. Rokanuzaman, Farjana Khanam, Anik Das, S. Reza Chowdury, “ Effective Location of shear wall on performance of building frame subjected to lateral loading” , Volume-4, Issue-6, Dec.-2017 [13] S. R. Kangle, D. S. Yerudkar (2020) , Response Spectrum Analysis for Regular Multistory Structure in Seismic Zone III, International Journal of Engineering Research & Technology (IJERT), Vol. 9 Issue 09, September-2020.
Copyright
Copyright © 2024 Praneeth C, Dr. P. Anuradha. This is an open access article distributed under the Creative Commons Attribution License, which permits unrestricted use, distribution, and reproduction in any medium, provided the original work is properly cited.

Download Paper
Paper Id : IJRASET64240
Publish Date : 2024-09-15
ISSN : 2321-9653
Publisher Name : IJRASET
DOI Link : Click Here
 Submit Paper Online

