Ijraset Journal For Research in Applied Science and Engineering Technology
- Home / Ijraset
- On This Page
- Abstract
- Introduction
- Conclusion
- References
- Copyright
Rejection Analysis of Piston - A Case Study
Authors: Abhas Kamble, Ayush Singh, Bhagyashree Wasake, Himanshu Lokhande, Shri. D. Dhone, Dr. S. B. Ingole
DOI Link: https://doi.org/10.22214/ijraset.2024.60735
Certificate: View Certificate
Abstract
Rejection analysis is a crucial aspect of quality management in the manufacturing industry, aimed at identifying and rectifying the root causes of rejected or defective products. This paper provides an overview of the concept, objectives, and methodologies involved in rejection analysis. The primary objective is to improve product quality by systematically analyzing rejected items and implementing corrective actions to prevent recurrence. Key steps in rejection analysis include identifying rejected products, conducting root cause analysis, collecting and analyzing data, implementing corrective actions, and monitoring for continuous improvement. Additionally, rejection analysis enables manufacturers to meet regulatory standards, mitigate risks, and foster a culture of continuous improvement. By emphasizing the importance of rejection analysis in driving quality, efficiency, and competitiveness, underscores its critical role in ensuring the success and sustainability of manufacturing operations.
Introduction
I. OBJECTIVE
Rejection analysis in the manufacturing industry serves several key objectives aimed at enhancing product quality, optimizing processes, and ultimately improving customer satisfaction. At its core, rejection analysis seeks to identify the root causes behind rejected or defective products. By conducting thorough investigations into manufacturing processes, equipment, materials, and human factors, manufacturers can pinpoint the specific issues leading to rejection. Armed with this understanding, corrective actions can be developed and implemented to address these root causes effectively. The overarching goal is to reduce rejection rates, minimize waste, and optimize manufacturing processes for greater efficiency and reliability. Additionally, rejection analysis aims to improve overall product quality by ensuring consistency, reliability, and compliance with regulatory standards. By continually monitoring rejection rates and refining corrective measures, manufacturers can establish a culture of continuous improvement, driving innovation and competitiveness in the marketplace. Ultimately, rejection analysis plays a vital role in enhancing product quality, streamlining operations, and bolstering customer satisfaction within the manufacturing industry.
- Identification of root causes.
- Process improvement.
- Cost Reduction.
- Quality Enhancement.
- Preventive Action.
II. LITERATURE REVIEW
DALGOBIND MAHTO [1] in this paper, it gives details of root cause analysis methods and techniques in identification quality of major key characteristics in manufacturing process. It is very risk in identifying problem in multistage operation. In this paper, root cause analysis was adopted to reduce the defect rate in cutting operation in CNC machines. This study dives detail structure to solve human related problem in manufacturing process. This study gives an idea for stakeholders to promote effective and better solution all time.
TANVIR AHAMAD [2] this paper presents on use of Pareto chart and cause and effect diagram in analyzing the defect caused in garment industry. This paper aims at reducing the defect rate caused while stitching clothes. Using these methods it was identified about 80% defect rate in process of stitching. The top five defects were identified and analyzed. Using cause and effect diagram causes and effect are constructed. The study provided suggestion to reduce the defect rate. Thus this papers gives idea of how effectively minimizing the rework and defect rate.
A.L. MOE and A.B ABU [3] in this paper, it uses the six sigma approach in defect reducing in automobile industry. The six sigma processes like define, analysis, measure, improve and control are applied. This study includes tools like quality management tools such as Pareto analysis, data analysis, cause and effect diagram and design of experiments. This study aims at finding out the root cause to problem and providing solution .This paper highlighted the cause foe product rejection rate. This paper aims at reducing rejection rate 0.08% Hence six sigma approach was effective in reducing the defect.
[4] MAZIDHUL IBRAM this paper highlights on use of quality tool in minimizing the rework in apparel industry. This paper gives idea of quality and productivity improvement in apparel industry. The methods helps to provide the framework in identify the defect and analyze. It helps to reduce the defect rate. This paper gives the idea of application of process performance of critical process which leads to proper utilization of machines and time. The paper aims at improve the productivity by minimizing cost and internal throughput.
III. RESEARCH METHODOLOGY
The research methodology for this project involved a combination of quantitative and qualitative data collection methods. The first step was to collect data. This was done by observing and recording the number of parts produced in different time intervals, such as per shift, per day, per month. In each shift 350 parts were produced and thus per day 700 were produced, so per month 17500 parts were produced in month
To validate the calculate production target, data was collected for the month of November 2023. It was found that a total of 2819 minutes were lost due to various reasons such as small stops, inspection, manpower fatigue, and loading and unloading of jobs and tool changes. The major losses were due to inspection, manpower fatigue, and the need to clean the tool after every part was produced. Apart from that the major contributor in defects was variation in thickness which was accounting and contributing around 52% in total rejection. In order to identify the root causes of these losses, a why-why analysis was conducted. It was found that the operator had to set a new part after the specified time, leading to fatigue and frequent machine stops. The operator also had to clean the jaw after every part, which further added to the downtime. Based on these findings, it was suggested to implement an automatic cleaning system for the machine tool to reduce the downtime caused by manual cleaning.
The research methodology for this project also involved seeking feedback and suggestions from the supervisor and operator. This helped in gaining a better output
IV. ROOT CAUSE ANALYSIS BY FISHBONE DIAGRAM

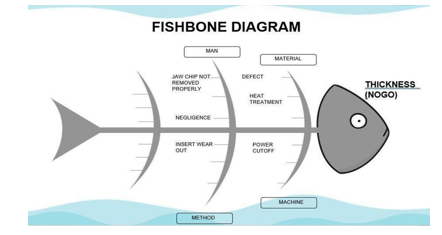
To create a fishbone diagram, our team gathered brainstorm and identified potential causes within each category. Each cause is then represented as a branch off the corresponding bone. This process encourages a systematic exploration of all possible causes and helped our team uncover root causes that may not be immediately obvious. Once the diagram was complete, our team analyzed the identified causes and prioritize them based on their likelihood and impact. This information can then be used to develop strategies for addressing the root causes of the problem and implementing corrective actions to prevent its recurrence. The result of using a fishbone diagram in rejection analysis provided valuable insights into the root causes of rejected or defective products. By systematically organizing potential causes across various categories, our teams gained a comprehensive understanding of the factors contributing to rejection rates. The result of utilizing a fishbone diagram in rejection analysis extended beyond mere identification of root causes; it catalyzed actionable steps towards improvement. By visually organizing potential causes into distinct categories, our team gained clarity on the multifaceted nature of rejection issues. This structured approach enabled our team to delve deeper into each category, uncovering intricate relationships and dependencies between factors.


VII. RESULT
- Minimization of defect is an important factor ensuring the quality of product.
- So manufacturing the quality product is essential to sustain in the global market.
- Customer satisfaction depends on quality of product.
- Good quality results in good establishment of brand name, good providers and builds reputation in market.
- We should know that 1 % defect leads to 100% defective for customer to buy product.
Thus we were able to reduce rejection rate due to thickness by 52% of 0.154 =0.08%
VIII. FUTURE SCOPE
This project can be further expanded to include other machines and processes in the industry, leading to a more comprehensive and effective maintenance system. Additionally, continuous monitoring and analysis of production data can be implemented to identify and address any potential issues before they lead to significant losses. This project serves as a solid foundation for further research and development in the field of total productive maintenance in small scale industries.
- Automatic Cleaning Systems: Implementing automatic cleaning systems for Jaw and tools can address production losses caused by manual cleaning. Research should explore feasibility, effectiveness, and integration with existing machinery.
- Operator Training and Ergonomics: Enhancing operator skills and ergonomics can reduce fatigue and improve machine utilization. Future efforts should focus on comprehensive training programs and ergonomic improvements.
- Predictive Maintenance: Utilizing lOT sensors and predictive analytics can enable proactive maintenance, minimizing downtime. Future research can explore predictive maintenance strategies for the Boring and finishing machine.
- Continuous Improvement: Embracing methodologies like Lean Six Sigma and Kaizen ensures continuous process improvement. Future studies should focus on waste elimination and streamlining operations.
- Benchmarking and Evaluation: Comparative analysis against industry standards can identify areas for improvement. Benchmarking studies can evaluate performance metrics and drive organizational excellence.
Conclusion
Preventive actions which needs to be taken: 1) Replace the cutting tool before reaching to its permissible limit, i.e. for rough turning ?200. for finish turning ?300 . For rough boring insert life ?350 nos. for finish boring ?400 nos. 2) during operation check noise of cutting 3) control feed rate speed 4) check bluntness and finish of component as soon as operation is performed 5) weekly maintenance especially for proper removal of waste from each part of machine with help of pneumatic air 6) provide proper knowledge to worker 7) use of Proximity sensor 8) use of Automatic Cleaning Systems 9) Check for machine/toolholder/tooling system stability. Secure workpiece properly to minimize vibration. Use vibration-dampening toolholders or inserts 10) Reduce cutting forces by optimizing toolpath and tool engagement. Use shorter tools with larger diameters if possible. Consider using stronger or more rigid tool materials. 11) Implement tool life management systems to monitor tool wear and schedule replacements. Through the analysis of production data, it was determined that the major losses were due to inspection, manpower fatigue, and the need for frequent cleaning of Jaw tool. By identifying these root causes, it was suggested to implement an automatic cleaning system for jaw tool to improve productivity and reduce downtime. This project has not only improved the efficiency of the machine, but it has also provided valuable insights for future maintenance strategies in the industry. The successful implementation of total productive maintenance has shown the potential for increased productivity and cost savings in small scale industries. a) Efficiency Enhancement: Adopting Quality principles reduced production losses and boosted overall equipment effectiveness (OEE). Addressing root causes like small stops and setup inefficiencies optimized machine performance and slashed downtime. b) Operator Engagement: Involving operators in TPM fostered a culture of continuous improvement. Their participation in maintenance activities and following standardized cleaning procedures contributed to sustained productivity gains. c) Sustainability: Promotes a proactive maintenance approach, ensuring sustained improvement in machine reliability and longevity. Prioritizing preventive maintenance and routine inspections enhances operational sustainability. d) Cost Savings: Impact on reducing production losses directly cuts operational expenditures. By minimizing downtime and enhancing yield rates. Optimization of resources utilization, leading to significant cost savings for the organization
References
[1] Md.Mazadul Islam, Improvement in the apparel industry, International journal of engineering applied science, Jan 2013, volume (1). [2] Tanvir Ahmed, Application of Pareto analysis to reduce defect in garment industry, International journal of modern engineering, volume (3), December 2013. [3] Dalgobind, Application of root cause analysis, Journal of industrial engineering and management, Volume 01(02), 2008. [4] Suresh, AL MOE AND AB ABU, Defect reduction in piston manufacturing plant, Journal of industrial and intellectual information, volume 3, march 2013. [5] Sanjay kumar, Scrap reduction using TQM method, International journal of industrial engineering, volume 16(4), 2009.
Copyright
Copyright © 2024 Abhas Kamble, Ayush Singh, Bhagyashree Wasake, Himanshu Lokhande, Shri. D. Dhone, Dr. S. B. Ingole. This is an open access article distributed under the Creative Commons Attribution License, which permits unrestricted use, distribution, and reproduction in any medium, provided the original work is properly cited.

Download Paper
Paper Id : IJRASET60735
Publish Date : 2024-04-21
ISSN : 2321-9653
Publisher Name : IJRASET
DOI Link : Click Here
 Submit Paper Online

