Ijraset Journal For Research in Applied Science and Engineering Technology
- Home / Ijraset
- On This Page
- Abstract
- Introduction
- Conclusion
- References
- Copyright
Heart Disease Detection Using Machine Learning
Authors: Arpit Verma, Mayank Pathak, Akhilesh Kumar Prajapati, Harsh Srivastava
DOI Link: https://doi.org/10.22214/ijraset.2024.59266
Certificate: View Certificate
Abstract
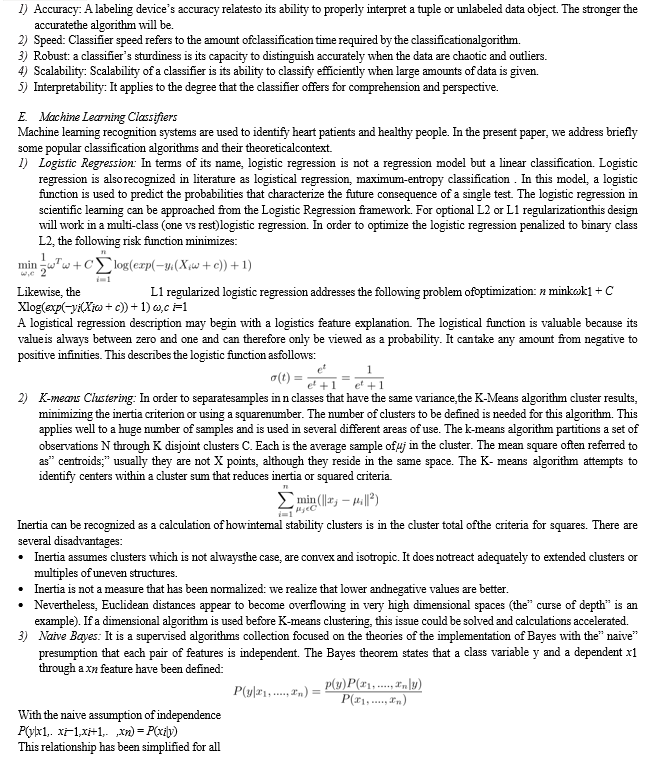
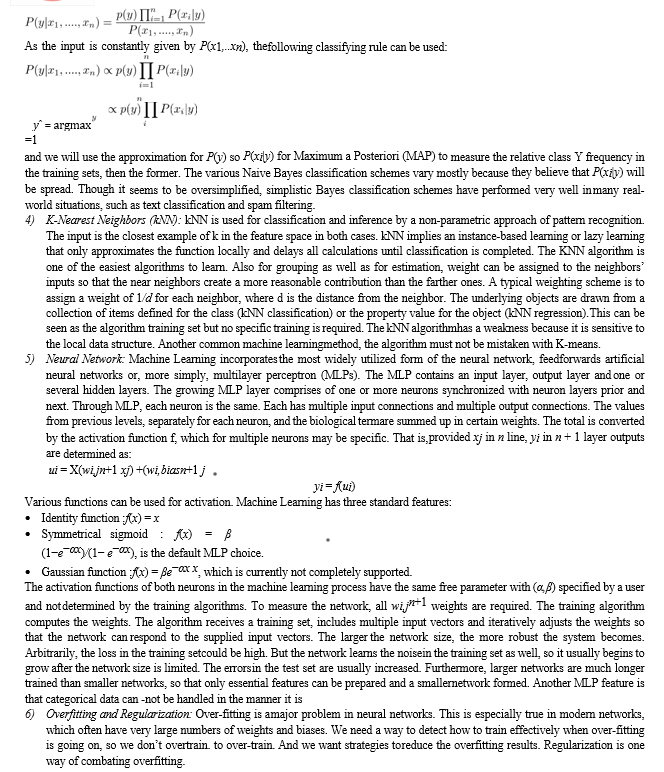
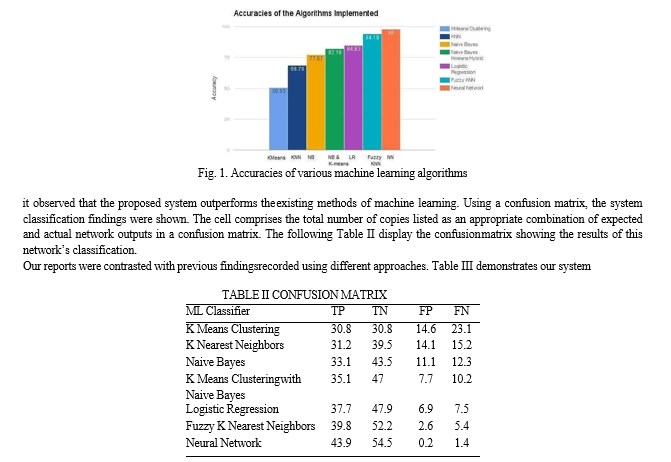
One of the most common tasks in machine learning is to classify data. Machine learning is a key feature to derive information from corporate operating datasets from large databases. Machine Learning in Medical Health Care is an essential emerging field for delivering prognosis and a deeper understanding of medical data. Most methods of machine learning depend on several features defining the behavior of the algorithm and influencing the output and the complexity of the resulting models directly or indirectly. In the last ten years, heart disease is the world’s leading cause of death. Many machine learning methods have been used in the past to detect heart disease. Neural Network and Logistic Regression are some of the few popular machine learning methods used in heart disease diagnosis. They analyze multiple algorithms such as Neural Network, KNearest Neighbors, Naive Bayes, and Logistic Regression along with composite approaches incorporating the above- mentioned heart disease diagnostic algorithms. The system was implemented and trained in the Python platform using the UCI machine learning repository benchmark dataset. For the new data collection, the framework can be extended.
Introduction
I. INTRODUCTION
Heart disease (HD) or cardiovascular disease is the most common human disease in the world that imposes a threat to life. In this state, the heart is usually unable to pump the required amount of blood to various parts of the human body during order to meet the regular functionalities of the body, resulting in irreversible heart failure. The United States has an extremely high rate of heart disease. Symptoms such as breathlessness, physical body weakness swollen ankles and tiredness with the associated sign, such as increased vein stress and peripheral edema from functional or non-cardiac disorders, are symptomatic of cardiac illnesses. Early-stage testing strategies for the diagnosis of HD have been difficult and their complexity is one of the main reasons for impacting the quality of living. Diagnosis and treatment of cardiovascular diseases are extremely complex, especially in developing countries, since diagnostic instruments are rarely available and medical practitioners and other services are missing that affect correct prediction and care of cardiac patients . A lot of research and study has been done over the last few years on better and reliable data sets for heart disease.
[4] offers a strategy based on knowledge. Initially, Dr. Robert Detrano used logistic regression to achieve a precision of 77%. Newton Cheung used algorithms with Naive Bayes and obtained a classification accuracy of 81.48% [6]. In treating patients with heart disease, Palaniappan and Awang explored the analysis of various data mining techniques. Naive Bayes, decision trees, and neural networks were used in these techniques. The results showed that Naive Bayes was able to achieve the highest precision in diagnosing patients with heart disease. Indira [8] uses the BF network of probabilistic artificial neural networks. This is a radial-based algorithm class RB approach is useful for automated pattern recognition, nonlinear modeling, and class composition probability estimation and probability ratios. With a total of 576 records and 13 patient features, the data used in the tests were drawn from the Cleveland heart disease archive. The best performance in accuracy was 94.60%. Among the most widely used methods for data mining in grouping issues is KNearest Neighbor . It is a popular choice due to its simplicity and relatively high level of convergence. Nonetheless, the huge memory space required to store the entire sample is a major disadvantage of KNN classifiers. If the sample is large there is also a large response time on a sequential computer
Python and machine learning have been used in our research to support libraries such as sci-kit learn, numpy, pandas and matplotlib.
II. MATERIALS AND METHODS
The goals of the research are to perform a” comprehensive analysis of different algorithms in machine learning and develop a more accurate algorithm.” People these days’ work for hours and hours on machines, they have no time to take care of themselves. The poor health of people is severely affected because of the unhealthy lifestyle, hexagonal habits, and intake of junk food. It can determine how much a person would die from heart disease with the medical parameters, which are adequate patients as well as normal people.
The task is to determine which studies will be positive and which will be inaccurate in the cardiovascular identification process. The following subsections address extensively the paper’s analysis materials and procedures.
A. Data set Description
Various studies use” Cleveland heart disease data set 2016” and can be downloaded from the University of California, Irvine’s online data mining depot. This data set has been used in this study to develop a machine learning algorithm based system for the diagnosis of heart disease. The data set for Cleveland cardiac disease is 303 cases with 76 attributes and certain incomplete attributes. During the study, six samples were rejected due to a missed value of the task columns and a resulting sample size of 297 were taken with 13 further separate input features. There are two groups on the goal performance label to describe a heart patient or a regular topic
B. Classification Problem
Throughout Machine learning the question is to classify, on the basis of a training data set of observers whose group membership is identified, which of a number of categories belong to a new observation. Classification is a supervised learning problem, i.e. problems with poorly labeled tuples and algorithms. A classification algorithm is classified as a classifier in particular in an actual implementation .
C. Binary and Multiclass Classification
Classification can be viewed as two distinct binary and multiclass classification problems. A better understood function of binary classification needs only two types, while multi type class classification includes the assigning of an entity to one of various classes.


The regulation changes the target function by adding additional conditions to penalize large weights, which we minimize. In other terms, we are shifting the target to the Error+ lambdaf(θ), where the power of regularization (a learning algorithm hyper- parameter), grows larger as the components of θ grown larger and λ becomes larger. A λ = 0 means that the possibility of overfitting is not taken. If λ is too high, our model will focus on keeping θ the parameter value as small as possible when trying to find the values which are good for our workout. Consequently, λ is a very important task and some trial and error may be required.
7) Fuzzy K- Nearest Neighbors: The method is based on assigning membership to the available groups depending upon the difference between the function and its closest neighbors and those neighbors. In that it still requires to scan the sample set labeled for the K-nearest neighbors, the fuzzy algorithm is identical to the crisp variant. The methods vary considerably beyond the collection of the K samples. While the fuzzy K- nearest neighbor technique often reflects a rating algorithm, the results are different from the flat form. A class affiliation refers to a display function instead of a particular class the Fuzzy K-nearest neighbor algorithm. The drawbacks are that the program does not execute random tasks. Furthermore, the membership values of the variable should provide a confirmation standard that facilitates the subsequent classification. Large memory space is required to store the all the training data. It is also computationally expensive and has a greater time complexity.
8) K Means Clustering with Naive Bayes Classifier: We initially implemented K Means individually. Then we worked on hybrid by combining K Means with naive bayes. K Means is used to group together similar data. Then nave bayes was implemented on each cluster and model was made. For each new test case, it was first determined to which cluster it belongs. Then the naive bayes model for that particular cluster was used to make prediction for the given test case. K Means was used with the hope that grouping together similar data will help in increasing accuracy of naive bayes algorithm. Here we had a tradeoff between time of computation and accuracy but additional gained accuracy was preferred. For this algorithm, we first discretized the data as naive bayes requires data which is in discrete form. We could not use gaussian Naive Bayes because the distribution of data was not gaussian and it would have contributed to poor accuracy if anything were used. We had two choices to discretize records, equal discretizing width and equal discretizing frequency. Equal variable widths contributed to improved performance.
F. Cross Validation
Cross-validation, also referred to as the estimation of rotation, is a testing technique to evaluate whether mathematical observational findings are translated to an individual set of data. It is primarily used in quantitative environments and one needs to approximate the actual output of a predictive model. A model generally contains a dataset of known data (training data set), a dataset of unknown data (or first used data) against which the model is evaluated (testing dataset). In a prediction problem, a model can be used. To order to limit issues like overfitting and provide an overview into how the model is to extend to a different dataset etc. For k-fold crossvalidation, the initial sample is divided randomly into k similar to k. The aim of the cross-validation is to create a data set to” test” the model in the training phase. One sub- sample of k is held for validation of the model, and the remaining k 1 subsamples are used as rain results. The method of cross-validation then is repeated k times (folds), and the validation data is used precisely once for each of the k subsamples.
G. Performance Evaluation Metrics
Numerous performance evaluation tests have been used in this work to validate the performance of classifiers. We used a confusion matrix, each result is projected in precisely one chamber in the test array. There are two resting groups, 2 × 2 matrix. In comparison, there are two forms of accurate classifier estimation and two kinds of inaccurate prediction classifier. The following can be determined from the confusion matrix: TP: expected performance as true positive (TP); we found an appropriate diagnosis of the HD topic, with cardiovascular disease.
We’ve noticed that a healthy person is properly labeled and the topic is safe. TN: The results predicted to be truly negative (TN).
FP: The conclusion is that it is wrong to classify a stable subject as having heart disease (Type 1 error): expected performance as false positive(FP).
FN: We consider that heart disease is incorrectly labeled as not having heart disease because the target is stable (type 2 error). Predicted to be false-negative (FN).
III. EXPERIMENTAL RESULTS AND DISCUSSION
Two separate diagnosis classes were included in this study: normal and patient who may have heart diseases. Many researchers have suggested different methods for the detection of heart disease as stated in the previous section. The accuracies recorded range from 50% to 87%. The collection includes 303 samples, 297 of which are full samples and six of which are incomplete samples. While the neural network ensemble model was trained in 70 percent of the cardiac disease database, the remaining 30% of the cardiac disease database was used for validating the proposed system. ROC curve is also one commonly used graph that summarizes the performance of a classifier over all possible threshold for assigning observations to a given class. Here, confusion matrix is used, which contains information about actual and predicted classifications performed by a classification system. The performance is evaluated using the data in the matrix. The results of the various machine learning algorithms are shown in figure 1 From fig 1,

In order to predict heart disease and then analyze the best method of analysis for treatment for the disease the works conducted a study of different algorithms, such as the Naive Bayes, the K Nearest neighbors, and logistic regression. Alongside simple algorithms, the hybrid algorithms generated are better evaluated and implemented than several previously cited research papers. From test results and evaluates, it is inferred that, compared to the success of K Means Clustering, KNN, logistic regression, etc., Neural Network and Fuzzy KNN appear to be better performance
IV. ACKNOWLEDGMENT
We extend our heartfelt gratitude to all those who have contributed to the successful completion of our research paper titled "Heart Disease Detection using ML."
This project has been an endeavor of dedication, collaboration, and persistent effort, and we are indebted to numerous individuals and organizations for their invaluable support.
First and foremost, we express our deepest appreciation to our research supervisor, MR K.S Pathak, whose guidance and mentorship have been instrumental throughout the entire research process. Their insightful feedback, constructive criticism, and unwavering encouragement have significantly enhanced the quality and depth of our work.
We are also thankful to the members of our research team who have dedicated their time, expertise, and collaborative spirit to ensure the success of this project. Each member's unique contribution has played a crucial role in shaping the methodologies, conducting experiments, and analyzing results.
Our sincere thanks go to Babu Banarasi Das Northern India Institute of Technology, for providing the necessary resources, infrastructure, and financial support that enabled us to carry out this research. The conducive research environment and access to cutting-edge technologies have greatly facilitated our exploration into the field of machine learning for heart disease detection.
We would like to express our gratitude to the participants who willingly volunteered their health data for this study. Their contributions have been essential in building a robust and reliable machine learning model for heart disease detection, and their willingness to share personal information for the advancement of medical research is truly commendable.
Finally, we thank our friends, families, and colleagues for their unwavering support, understanding, and encouragement throughout this research journey. Their patience and belief in our abilities have been a constant source of motivation.
Conclusion
This research paper represents a collective effort, and we are grateful to everyone who has contributed in various capacities. The knowledge gained from this study has the potential to make a meaningful impact on the early detection and prevention of heart diseases, and we look forward to further advancements in this crucial area of healthcare. Thank you all for being an integral part of this research endeavor.
References
[1] P. A. Heidenreich, J. G. Trogdon, O. A. Khavjou, J. Butler, K. Dracup, M. D. Ezekowitz, E. A. Finkelstein, Y. Hong, S. C. Johnston, A. Khera, et al., “Forecasting the future of cardiovascular disease in the united states: a policy statement from the american heart association,” Circulation, vol. 123, no. 8, pp. 933–944, 2011. [2] S. S. Yadav and S. M. Jadhav, “Machine learning algorithms for disease prediction using iot environment,” International Journal of Engineering and Advanced Technology, vol. 8, no. 6, pp. 4303–4307., 2019. [3] S. Ghwanmeh, A. Mohammad, and A. Al- Ibrahim, “Innovative artificial neural networks- based decision support system for heart diseases diagnosis,” Journal of Intelligent Learning Systems and Applications, vol. 5, no. 3, p. 176, 2013. [4] J. Nahar, T. Imam, K. S. Tickle, and Y.-P. P. Chen, “Computational intelligence for heart disease diagnosis: A medical knowledge driven approach,” Expert Systems with Applications, vol. 40, no. 1, pp. 96– 104, 2013. [5] R. Detrano, A. Janosi, W. Steinbrunn, M. Pfisterer, J.-J. Schmid, S. Sandhu, K. H. Guppy, S. Lee, and V. Froelicher, “International application of a new probability algorithm for the diagnosis of coronary artery disease,” The American journal of cardiology, vol.64, no. 5, pp. 304–310, 1989. [6] N. Cheung, Machine learning techniques for medical analysis. School of Information Technology and Electrical Engineering. PhD thesis, B. Sc. Thesis, University of Queenland, 2001. [7] S. Palaniappan and R. Awang, “Web-based heart disease decision support system using data mining classification modeling techniques.,” in iiWAS, pp. 157–167, 2007.
Copyright
Copyright © 2024 Arpit Verma, Mayank Pathak, Akhilesh Kumar Prajapati, Harsh Srivastava. This is an open access article distributed under the Creative Commons Attribution License, which permits unrestricted use, distribution, and reproduction in any medium, provided the original work is properly cited.

Download Paper
Paper Id : IJRASET59266
Publish Date : 2024-03-21
ISSN : 2321-9653
Publisher Name : IJRASET
DOI Link : Click Here
 Submit Paper Online

