Ijraset Journal For Research in Applied Science and Engineering Technology
- Home / Ijraset
- On This Page
- Abstract
- Introduction
- Conclusion
- References
- Copyright
Growth and Trend Analysis of Select Banks listed in NSE Nifty Bank Index
Authors: K. C. Anushri, Dr. M. Nirmala
DOI Link: https://doi.org/10.22214/ijraset.2024.65532
Certificate: View Certificate
Abstract
Growth and trend analysis is important in banking sector to analyse and predict the patterns. The aim of the study is to analyse the growth and trend of nifty bank. Statistical tools like trend analysis, standard deviation is used to identify the growth and trend patterns. This research contributes to a comprehensive understanding of the factors shaping the growth rate of key banking institutions within the NSE Nifty Bank Index.
Introduction
I. INTRODUCTION
Trend analysis is defined as a statistical and analytical technique used to evaluate and identify patterns, trends, or changes in data over time. It involves the examination of historical data to uncover insights into the direction or tendencies of a particular phenomenon.
Trend analysis is applied in various fields, including finance, economics, marketing, and science, to make informed decisions and predictions based on past performance or behaviour.
II. REVIEW OF LITERATURE
Panigrahi (2021) explores how the term "trend" has become the stock market's catchphrase, and we can all agree on that. Observing medium-term and short-term fluctuations in addition to longer-term (secular) patterns is always advised for investors as part of investment strategy and analysis.
An indication of momentum used by traders and investors is the RSI. Relative strength indicators (RSI) between 70 and 30 show overbought and oversold conditions. Multiple methods for analysing NIFTY 50 data for investment objectives have been developed over the last 20 years. We have examined the two trends—50–50 and 60–40—in order to estimate the returns in this research. Furthermore, our approach's back-testing and trading procedures are described.
III. STATEMENT OF THE PROBLEM
The nation’s banking industry is essential to its economic growth since its activities impact and reflect the condition of the economy as a whole. Major banking firms that have a big influence on market dynamics and investor confidence are included in the Nifty Bank Index, a benchmark index on the National Stock Exchange (NSE). Despite its popularity, a thorough growth and trend analysis is required to understand the fundamental causes of the performance variances among the listed banks.
IV. OBJECTIVE OF THE STUDY
To analyse the growth and trend of returns of select banks listed in the NSE Nifty Bank Index.
V. RESEARCH METHODOLOGY
The study is based on secondary data that has been collected from NSE Websites historical data of the respective banks, books, journals, articles, and web searches. The following websites and journals are listed below:
- https://finance.yahoo.com/
- https://investing.com/
- Published research articles
- Books and journals
VI. SAMPLE DESIGN
|
S. No. |
Banks |
Sector |
|
1. |
Bank of Baroda |
Public Sector |
|
2. |
Punjab National Bank |
Public Sector |
|
3. |
State Bank of India |
Public Sector |
|
4. |
Axis Bank |
Private Sector |
|
5. |
Federal Bank |
Private Sector |
VIII. DATA ANALYSIS AND INTERPRETATION
1) Analysis of Growth and Trend on Return of Bank of Baroda for the year 2016-17 to 2023-24
TABLE 1
GROWTH AND TREND OF BANK OF BARODA
|
Year |
Return |
Growth |
Trend |
|
2016-17 |
0.126 |
|
|
|
2017-18 |
0.023 |
-4.478 |
18.25397 |
|
2018-19 |
0.303 |
5.249 |
43 |
|
2019-20 |
0.375 |
0.192 |
23.356 |
|
2020-21 |
2.636 |
0.8577 |
70.492 |
|
2021-22 |
-0.796 |
4.3115 |
-30.1973 |
|
2022-23 |
-3.558 |
2.7734 |
44.687 |
|
2023-24 |
-1.062 |
-2.3502 |
29.84823 |
|
Mean |
Nifty Bank Share price |
11.5% |
|
|
BOB Return |
0.3% |
||
|
BOB Risk |
246.6% |
||
|
Standard Deviation |
Nifty Bank Share price |
40.2% |
|
|
BOB Return |
60.6% |
||
|
BOB Risk |
97.8% |
||
Source: Compiled from secondary data
GRAPH 1
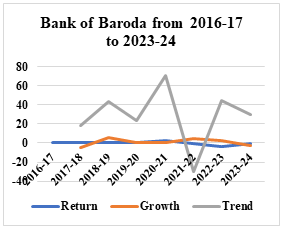
GROWTH AND TREND OF BANK OF BARODA
Source: Compiled from secondary data
Table 1 reveals the growth and trend of the return of Bank of Baroda for the year 2016-17 to 2023-24. It is observed over the sample period that there is an increasing trend in the initial period and a decreasing trend in 2018–19. During the year 2023–24, the return rate of -1.062 indicates a loss, the growth rate of -2.350 indicates a return to loss, and the trend value of 29.84 indicates a strong positive trend. This means the Bank of Baroda shows a significant fluctuation in return and growth rates, with positive and negative trends. The mean value of Nifty Bank share price is 11.5% and the standard deviation is 40.2%; the mean value of BOB return is 0.3% and the standard deviation is 60.6%; the mean value of BOB risk is 246.6% and the standard deviation is 97.8%.
2) Analysis of Growth and Trend on Return of Punjab National Bank for the year 2016-17 to 2023-24
TABLE 2
GROWTH AND TREND OF PUNJAB NATIONAL BANK
|
Year |
Return |
Growth |
Trend |
|
2016-17 |
-1.00 |
|
|
|
2017-18 |
-1.47 |
0.31 |
47 |
|
2018-19 |
4.83 |
1.30 |
-35 |
|
2019-20 |
1.22 |
-2.94 |
25.3 |
|
2020-21 |
3.43 |
0.64 |
41 |
|
2021-22 |
-0.04 |
42 |
-1.16 |
|
2022-23 |
-1.55 |
0.97 |
88 |
|
2023-24 |
-2.48 |
0.37 |
60 |
|
Mean |
Nifty Bank Share price |
11.5% |
|
|
PNB Return |
20% |
||
|
PNB Risk |
254.6% |
||
|
Standard Deviation |
Nifty Bank Share price |
40.2% |
|
|
PNB Return |
71.2% |
||
|
PNB Risk |
97.5% |
||
Source: Compiled from secondary data
Graph 2
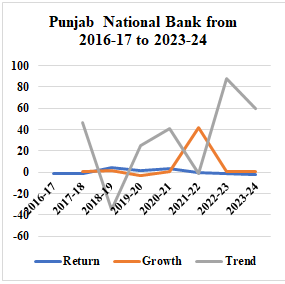
Growth and Trend of Punjab National Bank
Source: Compiled from secondary data
Table 2 reveals the growth and trend of the return of Punjab National Bank for the year 2016-17 to 2023-24. It is observed over the sample period that there is a decreasing trend in the initial period and an increasing trend in 2018–19. During the year 2023–24, the return rate shows -2.48, which indicates a loss, the growth rate shows 0.37, which indicates a return to loss, and the trend value shows 60, which indicates a positive trend. This means the Punjab National Bank shows a significant fluctuation in return and growth rates, with positive and negative trends. The mean value of Nifty Bank share price is 11.5% and the standard deviation is 40.2%; the mean value of PNB return is 20% and the standard deviation is 71.2%; the mean value of PNB risk is 254.6% and the standard deviation is 97.5%.
3) Analysis of Growth and Trend on Return of State Bank of India for the year 2016-17 to 2023-24
TABLE 3
GROWTH AND TREND OF STATE BANK OF INDIA
|
Year |
Return |
Growth |
Trend |
|
2016-17 |
-0.756 |
|
|
|
2017-18 |
-0.866 |
0.127 |
14.00 |
|
2018-19 |
0.594 |
2.458 |
26.00 |
|
2019-20 |
-0.352 |
5.688 |
-17.00 |
|
2020-21 |
1.427 |
1.247 |
12.65 |
|
2021-22 |
-2.312 |
1.617 |
-32.25 |
|
2022-23 |
-1.128 |
1.050 |
48.79 |
|
2023-24 |
-0.255 |
-3.424 |
22.61 |
|
Mean |
Nifty Bank Share price |
11.5% |
|
|
SBI Return |
4.5% |
||
|
SBI Risk |
191.1% |
||
|
Standard Deviation |
Nifty Bank Share price |
40.2% |
|
|
SBI Return |
49.9% |
||
|
SBI Risk |
85% |
||
Source: Compiled from secondary data
GRAPH 3
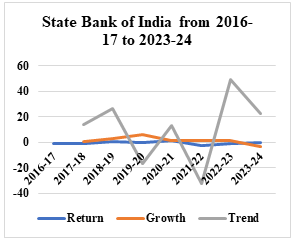
GROWTH AND TREND OF STATE BANK OF INDIA
Source: Compiled from secondary data
Table 3 reveals the growth and trend of the return of the State Bank of India for the year 2016-17 to 2023-24. It is observed over the sample period that there is an increasing trend in the initial period and a decreasing trend in 2018–19. During the year 2023–24, the return rate of -0.255 indicates a loss, the growth rate of -3.424 indicates a return to loss, and the trend value of 22.61 indicates a positive trend. This means the State Bank of India shows a significant fluctuation in return and growth rates, with positive and negative trends. The mean value of Nifty Bank share price is 11.5% and the standard deviation is 40.2%; the mean value of SBI return is 4.5% and the standard deviation is 49.9%; the mean value of SBI risk is 40.2% and the standard deviation is 85%.
4) Analysis of Growth and Trend of Return of Axis Bank for the year 2016-17 to 2023-24
TABLE 4
GROWTH AND TREND OF AXIS BANK
|
Year |
Return |
Growth |
Trend |
|
2016-17 |
0.258 |
|
|
|
2017-18 |
-1.009 |
1.26 |
-39.00 |
|
2018-19 |
-0.125 |
-7.07 |
12.39 |
|
2019-20 |
-0.75 |
0.83 |
60.00 |
|
2020-21 |
1.745 |
1.43 |
-32.00 |
|
2021-22 |
-0.306 |
6.70 |
-17.54 |
|
2022-23 |
-1.33 |
0.77 |
34.00 |
|
2023-24 |
-0.633 |
-1.10 |
47.59 |
|
Mean |
Nifty Bank Share price |
11.5% |
|
|
Axis Bank Return |
-1.9% |
||
|
Axis Bank Risk |
211.6% |
||
|
Standard Deviation |
Nifty Bank Share price |
40.2% |
|
|
Axis Bank Return |
49.5% |
||
|
Axis Bank Risk |
155.4% |
||
Source: Compiled from secondary data
GRAPH 4
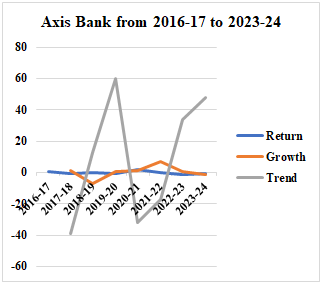
GROWTH AND TREND OF AXIS BANK
Source: Compiled from secondary data
Table 4 reveals the growth and trend of the return of Axis Bank for the year 2016-17 to 2023-24. It is observed over the sample period that there is a rising trend in the initial period and a decreasing trend in 2019–20. And the growth rate is also affected based on the trend. In the year 2023–24, the return rate is -0.633, indicating a loss of 63.3%; the growth rate shows a decrease in the loss; and the trend value reveals that there is a strong positive trend. This means that the Axis Bank growth rate has not been stable; it has had some significant recoveries and declines. The mean value of Nifty Bank share price is 11.5% and the standard deviation is 40.2%; the mean value of Axis Bank return is -1.9% and the standard deviation is 49.5%; the mean value of Axis Bank risk is 211.6% and the standard deviation is 155.4%.
5) Analysis of Growth and Trend on Return of Federal Bank for the year 2016-17 to 2023-24
TABLE 5
GROWTH AND TREND OF FEDERAL BANK
|
Year |
Return |
Growth |
Trend |
|
2016-17 |
-1.441 |
|
|
|
2017-18 |
-2.412 |
0.40 |
67 |
|
2018-19 |
1.13 |
3.13 |
-46.8 |
|
2019-20 |
0.329 |
-2.43 |
29.12 |
|
2020-21 |
1.992 |
0.83 |
60 |
|
2021-22 |
-0.97 |
3.05 |
-48.7 |
|
2022-23 |
-2.038 |
0.52 |
21 |
|
2023-24 |
-0.531 |
-2.84 |
26.05 |
|
Mean |
Nifty Bank Share price |
11.5% |
|
|
Federal Bank Return |
-3.8% |
||
|
Federal Bank Risk |
215.7% |
||
|
Standard Deviation |
Nifty Bank Share price |
40.2% |
|
|
Federal Bank Return |
55.6% |
||
|
Federal Bank Risk |
98% |
||
Source: Compiled from secondary data
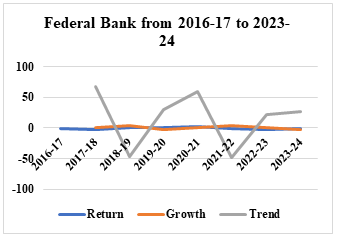
GRAPH 5
GROWTH AND TREND OF FEDERAL BANK
Source: Compiled from secondary data
Table 5 reveals the growth and trend of the return of the Federal Bank for the year 2016-17 to 2023-24. It is observed over the sample period that there is a decreasing trend in the initial period and an increasing trend in 2018–19. And the growth rate suggests that the return is unstable; with declines, there is no constant growth and a lack of stability in the return. During the year 2023–24, the return rate is -0.531, indicating a loss of 53.1%, the growth rate is decreasing, and the trend value is in a positive trend. This means that the Federal Reserve has extreme fluctuations in returns with frequent changes in growth and trend. The mean value of the Nifty Bank share price is 11.5% and the standard deviation is 40.2%; the mean value of the Federal Bank return is -3.8% and the standard deviation is 55.6%; the mean value of the Federal Bank risk is 215.7% and the standard deviation is 98%.
VIII. FINDINGS
- Bank of Baroda experienced growth in the initial period, followed by a decreasing trend in the year 2018–19. The bank faced a negative growth rate of -2.350, which indicates a significant downtrend in performance.
- Punjab National Bank experienced a decreasing return from 2016–17 to 2017–18, followed by a recovery in the year 2018–19. The positive growth rate of 0.37 indicates a return to loss. And also, it has a strong positive trend value.
- The State Bank of India experienced growth in the initial period, followed by a decreasing trend in the year 2018–19. The bank faced a negative growth rate of -3.424, which indicates a downtrend in performance.
- Axis Bank experienced growth in the initial period and started to decline in 2019–20. And there is a chance of loss in 2023–24, but there is recovery, indicating a strong positive trend value.
- The Federal Bank experienced decreasing growth in the initial period, followed by an increasing trend in 2018–19. The growth rate is unstable, with frequent fluctuations in returns.
IX. SUGGESTIONS
- Instability and frequent fluctuations in growth rates suggest the need for consistent performance.
- Banks should maintain a balanced portfolio increase in lending to stable and high growth industries.
Conclusion
The analysis of banks 0has shown the signs of recovery others are grappling with negative growth rates or unstable performance. To ensure long term stability and growth the banks need to adopt the plans like focusing on high growth leverage positive trends and also it should invest in innovations to enhance financial inclusion by adopting these the banks can mitigate current challenges ensure stable growth and maintain a competitive balance in financial plans.
References
[1] Panigrahi C. M. A. (2021). Trend identification with the relative strength index (RSI) technical indicator–A conceptual study. Panigrahi AK, Vachhani K, Chaudhury SK, Trend Identification with the Relative Strength Index (RSI) Technical Indicator–A Conceptual Study, Journal of Management and Research Analysis, 8(4), 159-169, 2021.
Copyright
Copyright © 2024 K. C. Anushri, Dr. M. Nirmala . This is an open access article distributed under the Creative Commons Attribution License, which permits unrestricted use, distribution, and reproduction in any medium, provided the original work is properly cited.

Download Paper
Paper Id : IJRASET65532
Publish Date : 2024-11-25
ISSN : 2321-9653
Publisher Name : IJRASET
DOI Link : Click Here
 Submit Paper Online

