Ijraset Journal For Research in Applied Science and Engineering Technology
- Home / Ijraset
- On This Page
- Abstract
- Introduction
- References
- Copyright
Selective Laser Melting Process Optimization and Mechanical Properties Evolution of AlSi10Mg by Determining Temperature of the Build Chamber using Arduino IDE and Coding Algorithm
Authors: Sathish Kotha, Prof. Pappula Laxminarayana, Prof. K Shyamala, Dr. K. Buchaiah
DOI Link: https://doi.org/10.22214/ijraset.2024.64028
Certificate: View Certificate
Abstract
Unlike conventional methods that involve removing components from a product, the groundbreaking idea behind additive manufacturing (AM) is the gradual creation of materials. A computer-controlled laser is often used in additive manufacturing to shape and consolidate powder feedstock in a layer-by-layer fashion to arbitrary shapes. The aerospace, defense, automotive, and biomedical sectors have high standards, and AM is now being refined to create complex-shaped functional metallic components out of metals, alloys, and other materials. Lightweight structural components with series similar mechanical characteristics may be produced using Selective Laser Melting (SLM), one of the AM technologies that eliminate the requirement for part specific tooling or downstream sintering procedures, among other things. The low weight and excellent mechanical and chemical qualities of aluminium make it an ideal material for such environmentally designed components. We need further information on how processing circumstances and material qualities affect the microstructural and mechanical properties of AM produced components as well as the metallurgical processes that produce them. Following this, we provide a comprehensive overview of AM\'s material and process components, including the mechanical and microstructural features of AM-processed parts as well as the physical characteristics of AM-optimized materials. Ultimately, the samples made using SLM-Alsi10Mg demonstrated an ultimate tensile strength of 150 MPa, yield strength of 120 MPa, and an elongation of 20%, as determined by the testing data. Mechanical properties of AlSi10Mg, additive manufacturing, laser powder bed fusion, selective laser melting, and related terms.
Introduction
I. INTRODUCTION
The term "rapid manufacturing" (RM) refers to a method of advanced production that was introduced to the public in the 1980s. Quick tooling (RT) was once a part of what was formerly known as rapid prototyping (RP) [1]. It's possible for RM to include replacement parts, bespoke components, and limited series manufacturing runs that end up in the hands of the consumer. The currently agreed-upon name for any methods that use layers to create an item is additive manufacturing (AM). Over 30 different AM approaches, including both direct and indirect methods, are available [2]. Despite sharing a same goal and methodology, the technologies used in AM processes exhibit striking differences upon closer inspection. The two AM techniques discussed here are DMLS and SLM, or selective laser melting and direct metal laser sintering. The temperature of the powder bed, used to sinter or melt the metal powder, is the key differentiator among various AM systems. Several studies have shown that AM technique [3], base material, layer thickness, laser type, build strategy, and post-processing all affect the mechanical qualities and quality of the product [4]. After more than 20 years of research, additive manufacturing (AM) is now one of the world's fastest-growing advanced manufacturing processes. The first approach for AM came out in the late 80s and was used to make models and prototypes. Material incremental manufacturing (MIM) is the foundation of AM, which is in contrast to the material removal procedure used in traditional machining methods. Using a computer-controlled laser as the energy source [5], additive manufacturing entails layer-by-layer shaping and consolidation of feedstock, which are usually powder materials, to arbitrary designs.
The first step in making anything from a computer-aided design (CAD) model is to mathematically split it into tiny layers. The last step in making the item is using a scanning laser beam to selectively consolidate the deposited material layers. Slices of the CAD model are shown by the shaped layers [6]. Thus, AM is also known as digital manufacturing, e-manufacturing, solid freeform fabrication, and so forth. Incorporating elements of laser technology, materials science, and mechanical engineering into a single process, additive manufacturing has the potential to completely transform the manufacturing sector [7]. The well-established AM approaches are quite adaptable since they are based on the same processing principle. The original AM methods include stereolithography equipment, 3D printing, fused deposition modeling, laminated object manufacturing, selective laser sintering, and fused deposition modeling. Low melting point polymer prototypes used as inspection or communication tools are the most common materials used in AM techniques [8]. Rapid prototyping using computer-aided design (CAD) files allows for more efficient production development iterations. Now that AM is at a mature growth stage, the manufacture of polymer conceptual prototypes is no longer the emphasis of AM research. To fulfill the high standards set by the aerospace, automotive, rapid tooling, and biomedical industries [9], the next logical step for AM techniques is to create complex shaped functional metallic components, such as metals, alloys, and metal matrix composites (MMCs), which are difficult to make using traditional methods [10]. Real production parts (i.e., end-use items) with fundamental mechanical qualities fulfilling industrial criteria are now being made using AM components, which were before only utilized as visualization tools. There are three common procedures for AM production of inexpensive and end-use metallic components: laser sintering (LS), laser melting (LM), and laser metal deposition (LMD) [11]. These three forms of AM technology are known by various names depending on the institution or business. When it comes to additive manufacturing, SLM is one of the RP methods that allows for the direct creation of metal components from powdered material. Process parameter improvement and material development have already been the subject of a great deal of research. As a result of these advancements, the SLM process has been extended to directly fabricate a variety of functional parts [12]. For example, we have tested a graded Cu-tool steel insert and found that it transferred heat more efficiently. Additionally, we have used the SLM machine to obtain components for 3D porous filters that are fine-structured and have a customized pattern of micron-sized channels. A bespoke surgery orienting model was created using SLM technology by PM100 and then utilized in an actual surgical procedure [13]. The SLM is a method of additive manufacturing that involves building components layer by layer. The part's CAD data guides a laser source to selectively scan the powder bed. The metal powder particles may be melted and fused together to produce almost entirely dense components using a high intensity laser beam. Parts that are almost completely dense are produced by melting and consolidating successive layers of metal powder particles on top of one another. Post-processing is then limited to surface polishing [14]. Because of its low density and excellent mechanical qualities, aluminum is a popular choice for components that must be lightweight without sacrificing strength. Since Al-Si alloys are casting alloys that are also weldable, they are the primary focus. Due to the minimal difference between the liquidus and solidus temperatures [15], AlSi10Mg is reasonably simple to process by laser applications. This makes it a good alternative to high strength aluminum alloys, which may be toughened using a particular heat treatment. Many industries, including those dealing with food, chemicals, cars, and aircraft, rely on the AlSi10Mg alloy. Its chemical make-up is identical to that of ISO 3522, and adding magnesium to an Al-Si alloy causes the precipitation of Mg2Si, which fortifies the matrix without drastically altering its other mechanical characteristics [16]. By creating components with structurally solid and highly customizable geometrical complexity, SLM of aluminum may open up new possibilities in applications that need interior structures and voids, such as lightweight structures and heat sinks. This research examines SLM of AlSi10Mg from two perspectives: the physical, including density and surface quality, and the economic, including productivity. We examine the SLM of two AlSi10Mg powders from different vendors as a first step in our inquiry [17]. The quality of the finished item may be affected by factors such as the chemical composition, particle size and distribution, flowability, and the technology used to produce the powder. These factors contribute to the deposition of layers and their melting behavior. A process window for this material under these circumstances (fiber laser, Argon environment) was defined by doing single track scans with varied scanning settings. This was the first step towards producing three-dimensional (3D) AlSi10Mg components using SLM [18]. Scan parameters such as laser power (P), scanning speed (v), and scan spacing (ss) are then fine-tuned for 3D items in bulk according to productivity, surface quality, and density. At last, we look at the microstructure and pores that the SLM-process created. The castability, weldability, and corrosion resistance of aluminum-silicon alloys are all quite good [19]. There are a plethora of uses for Al-Si alloys in the automotive, aircraft, and home sectors because of their desirable mechanical characteristics, excellent heat conductivity, and low weight. The precipitation of Mg2Si, made possible by alloying magnesium with Al-Si, greatly reinforces the matrix without altering any of the other mechanical characteristics of the alloy [20].
II. EXPERIMENTAL PROCEDURE
A. AlSi10Mg Material
German company SLM solution group AG provides the metal powder with the chemical composition of the AlSi10Mg alloy, as stated in Table 1. The size distribution of the powder particles varies between 20 and 63 µm. Tensile testing is conducted on the SLM-AlSi10Mg specimens in accordance with ASTM standard E8/E8M. The specifications of the circular-bar rod specimen are as follows: a 100 mm long total diameter, a 25 mm long gauge diameter, and a 6 mm fillet radius (Figure 1).
Table 1. Chemical composition of AlSi10Mg alloy [6].
|
Al |
Su |
Fe |
Cu |
Mn |
Mg |
Zn |
Ti |
Ni |
Pb |
Sn |
Other total |
|
Balance |
9.00– 11.00 |
0.55 |
0.05 |
0.45 |
0.20 – 0.45 |
0.10 |
0.15 |
0.05 |
0.05 |
0.05 |
0.15 |

Figure 1. a) Line diagram b) 3D model.
B. SLM Printing Process
The capabilities and overall setup of the AM technologies used in this research. In order to investigate how process parameters impact mechanical qualities, surface roughness, and component dimensional error, a complete factorial experimental design was developed. This design has three factors, each with three levels. The process variables of layer thickness (LT), scan speed (SS), and building direction (BD) were the experimental design elements. Each component is shown at two levels in Tables 2 and 3. We held all other factors constant that may have an impact on the mechanical attributes and quality of the item. Based on the standard thickness for SLM technology, the low level for layer thickness was determined. Two times the figure for the low level was the high level for layer thickness. Manufacturer suggestions informed the selection of the low scan speed level, which is based on the standard machine scan speed. Because the machines utilized in the experiment had their limits, the percentage is off. Figure 2 shows the relative positions of the component and the build platform, which is called the building direction. Parameters on mechanical characteristics, surface roughness, and component dimensional inaccuracy are affected by the build direction (BD) of 0°, which indicates orientation as shown in Figure 3. Since existing SLM machines can only provide laser power up to 200 W (400 W), we've developed a whole new SLM machine with upgraded hardware and software to help boost process efficiency. The maximum laser power is increased to 1 kW so that the process-related build rate may be greatly increased beyond 5 mm³/s. In this configuration, a fiber linked disk laser serves as the laser source. An ellipsoid forms the beam profile. A modified Concept of SLM machine was used to process AlSi10Mg powder in a tightly regulated environment, making it suitable for handling reactive materials. The machine's 400 W fiber laser and 75µm laser beam diameter provide a maximum of about 150 μm of beam width. Scanning rates, intervals, and laser powers were all tested. As seen in Figure 3, a scanning approach called island scanning was used prior to printing samples on the construction platform. This helped to decrease deformation caused by heat stresses. Concept Laser is a proprietary scan pattern.
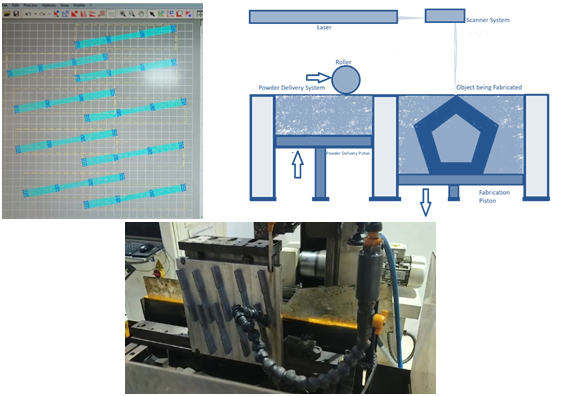
Figure 2: SLM printing process [20].
Table 2: Levels and their Factors for SLM of AlSi10Mg alloy.
|
Parameters |
Level 1 |
Level 2 |
Level 3 |
|
Laser power in Watts |
250 |
300 |
350 |
|
Scan speed in mm/s |
1200 |
1400 |
1600 |
|
Hatching distance in µm |
120 |
140 |
160 |
Table 3: Used L9 orthogonal array as per DoE (Minitab).
|
Trials No. |
Laser power (Watt) |
Scan speed ( mm/sec) |
Hatching distance (µm) |
|
T1 |
250 |
1200 |
120 |
|
T2 |
250 |
1400 |
140 |
|
T3 |
250 |
1600 |
160 |
|
T4 |
300 |
1200 |
140 |
|
T5 |
300 |
1400 |
160 |
|
T6 |
300 |
1600 |
120 |
|
T7 |
350 |
1200 |
160 |
|
T8 |
350 |
1400 |
120 |
|
T9 |
350 |
1600 |
140 |

Figure 3. SLM schematic diagram and printing process.
III. RESULTS AND DISCUSSION
All test parts were manufactured utilizing a set of design of process parameters (3^3) that result in maximum mechanical characteristics, with the aim of promoting the optimal mechanical qualities of AlSi10Mg components generated by SLM. Next, we'll optimize the process settings by considering the material's exceptional mechanical qualities. Furthermore, time taken by the build chamber for all the specimen at the 150th degree centigrade is measured to confirm thr impact of mechanical properties.
A. Mechanical Properties
Using a Shimadzu Autograph AG-IS 50 kN universal testing machine at a testing speed of 2 mm/min and a maximum force of 50 kN, the tensile characteristics were assessed according to the ISO 6892-1:2009 standard for metallic materials at room temperature. The results are shown in Figure 4. Figure 5 shows the results of the bending characteristics evaluation using an Instron 1122 Series universal testing machine at a testing speed of 2 mm/min and a distance between supports of 55.88 mm, in accordance with the ISO 2740:2007 standard for sintered materials. Mechanical characteristics determined by tensile testing of components manufactured in the 00 orientation; supplied values are means with 95% confidence intervals. Results from conventional casting and as-built printing of AlSi10Mg were used as a point of reference by the properties. During the as building condition, Mg2Si precipitates are formed, resulting in SLM-AlSi10Mg printed objects with exceptional hardness and strength. Even in their "as-built" (i.e., unheated) form, SLM components achieve far better hardness and strengths. Table 4 shows the findings from the tensile experimental test, and Figure 6 shows the plotted results. The ultimate tensile strength is 340 MPa, the yield strength is 130 MPa, and the elongation is 5.2%.
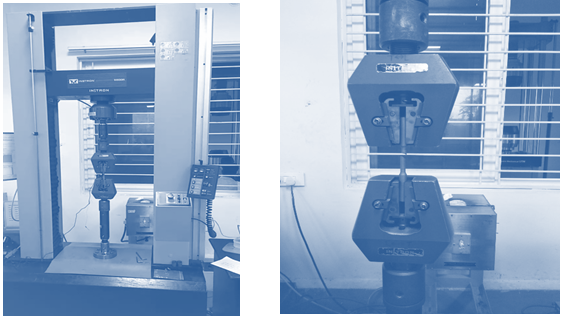
Figure 4: UTM experimental setup.
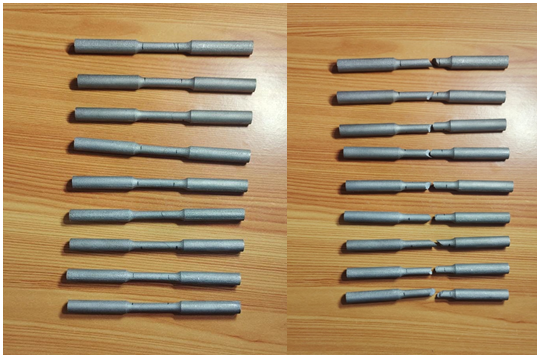
Figure 5: UTM L9 samples and after experimental braked samples.
Table 4: Tensile test results
|
SpecimenID |
Maximum Load (kN) |
Ultimate Tensile Stress (Peak Stress) |
0.2% offset (Yield stress) in MPa |
Elongation in % GL 4D |
% Reduction Area |
|
S - 1 |
15.037 |
328.680MPa |
233.190MPa |
4.24 |
6.95 |
|
S - 2 |
16.392 |
326.857MPa |
218.960MPa |
4.08 |
13.06 |
|
S - 3 |
16.529 |
357.562MPa |
250.047MPa |
5.08 |
8.67 |
|
S - 4 |
14.911 |
322.681MPa |
205.348MPa |
5.04 |
5.65 |
|
S - 5 |
15.694 |
341.376MPa |
230.400MPa |
5.56 |
5.92 |
|
S - 6 |
15.708 |
342.655MPa |
227.194MPa |
5.20 |
8.70 |
|
S - 7 |
14.650 |
321.242MPa |
210.349MPa |
5.80 |
8.22 |
|
S - 8 |
14.747 |
316.564MPa |
206.248MPa |
7.20 |
8.88 |
|
S - 9 |
16.116 |
350.565MPa |
236.787MPa |
6.40 |
5.16 |
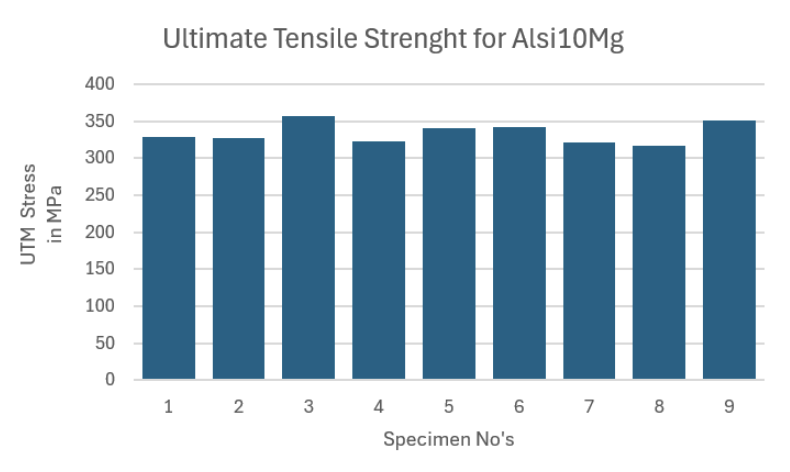
Figure 6: Tensile UTM test results.
B. Hardness
We used a Hoytom Minor-69 hardness tester to measure the hardness. The ISO 6508-1:2005 standard was used for measuring hardness. Figure 7 shows the average surface roughness that was obtained by combining Parts 1 and 3 with five separate measurements performed in various zones. One of the first indicators of mechanical qualities is hardness. Hence, several process parameters have had their hardness studied. The hardness of SLM samples was measured at various scanning velocities and laser powers, as shown in Figure 8. The rigidity of specimens created at scanning velocities ranging from 1200 to 1600 mm/s. There is no relationship between density and hardness. At 4000 mm/s, the density of the scanned samples is about 90%. Using 250 or 350 W has no effect on the hardness. There is no correlation between scanning velocity and the resultant hardness for this range of velocities, in contrast to other studies that found a hardness increase with increasing scanning velocities. The microstructure's hardness seems to peak at 128±5 HV, even at 1400 mm/s scanning speeds. The SLM-produced specimens are much harder than those created by conventional methods because of the high solidification rates and scanning velocities.
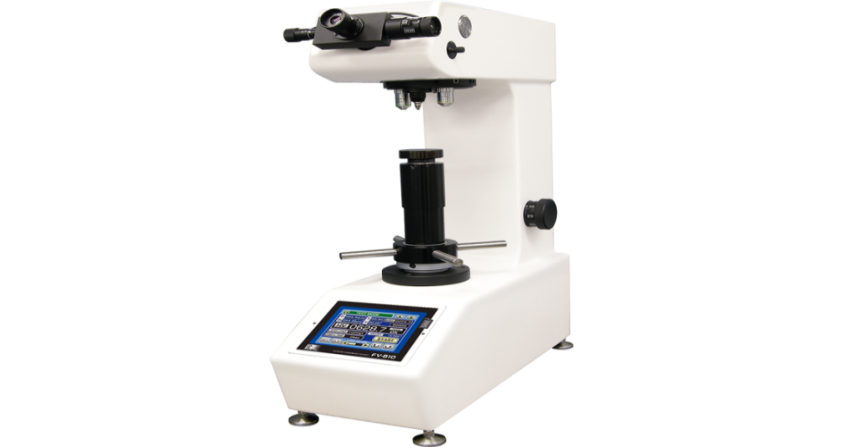
Figure 7: Vicker hardness tester.
Table 6. Mechanical properties of density and hardness.
|
Trail No. |
Hardness (HV) |
|
T1 |
123 |
|
T2 |
117 |
|
T3 |
119 |
|
T4 |
108 |
|
T5 |
127 |
|
T6 |
113 |
|
T7 |
128 |
|
T8 |
123 |
|
T9 |
120 |
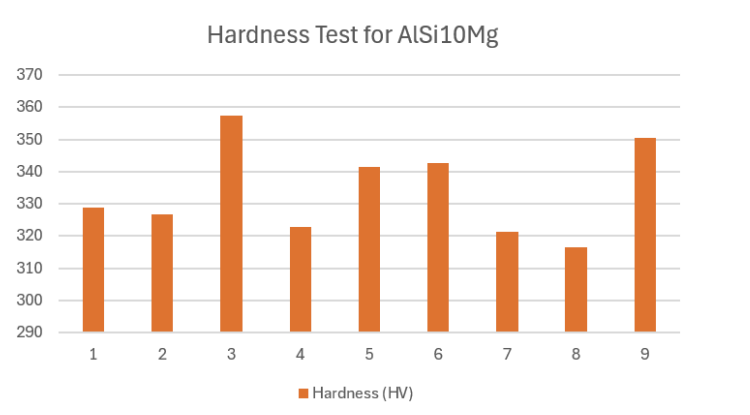
Figure 8: Vickers hardness experimental results.
C. Microstructure
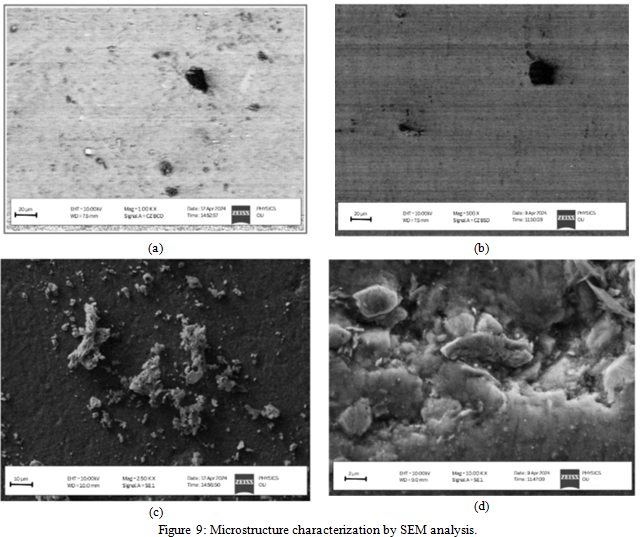
Microstructural analysis using a scanning electron microscope (SEM) is essential for building dense components, which in turn requires a melt pool that is cohesive and self-contained, rather than composed of separate subareas. Increasing the scanning velocity, on the one hand, reduces the energy per unit length. Conversely, scanning velocity has a beneficial effect on SLM process productivity. Therefore, a higher scanning velocity necessitates a higher laser power. Nevertheless, process instability and spattering are brought about by superheating, which occurs when the laser power is increased while maintaining a constant beam diameter. To attain good mechanical characteristics with aluminum, which is highly reflective and thermally conductive, a laser power of 350 W or more, scanning at a velocity of 1200 mm/s, is required. The energy per unit length is insufficient to produce dense components at even higher scanning velocities. Scan speeds of up to 1200 mm/s are possible when using a 350 W laser to produce dense components. With a 250 W laser power, the scanning velocity may be raised to 1200 mm/s, allowing for a faster construction pace. These may be attributed to the quick cooling and solidification of the AlSi10Mg SLM components, which leads to a highly finely distributed Si phase and, likely, the existence of Mg2Si, even though no such precipitates were seen. Figure 10 shows the very fine microstructure made of tiny Al-matrix cells/dendrites adorned with Si phase.
D. Taguchi and Analysis of Variance
The experimental data for the signal-to-noise ratio were employed in this taguchi approach, with the higher value (mechanical characteristics) being taken into consideration.Utilized the criterion that a higher signal-to-noise ratio is optimal and computed using equation 1.
SN= -10 log1ni=1n1yi2….(eq.1) 
The statistical approach that is most often utilized is analysis of variance (ANOVA). To find out how each process parameter affected fatigue strength, ANOVA was used. Through regression analysis, several process parameters, including laser power, scan speed, and hatching distance, were determined in ANOVA. These parameters include the following: degree of freedom (DF), percentage of the contribution (%), mean square of each factor (MSF), sum of squares (SST), P-test, and F-test. Table 7 of the responses provided the values that were used to determine which element level yielded the best performance. According to Figures 10 and 11, scan speed and hatching diatance are the three most influential factors, followed by laser power.
To perform an ANOVA with grouping, we need to have different groups or factors that we can compare. Let's assume we categorize the specimens into two groups based on the Ultimate Tensile Stress (Peak Stress) values.
- Group 1: Specimens with Ultimate Tensile Stress less than 330 MPa
- Group 2: Specimens with Ultimate Tensile Stress equal to or greater than 330 MPa
Based on these groups, we can then perform a one-way ANOVA to determine if there's a significant difference between these groups.
1) Categorized Data
Group 1 (Ultimate Tensile Stress < 330 MPa):
- S - 1: 328.680 MPa
- S - 2: 326.857 MPa
- S - 4: 322.681 MPa
- S - 7: 321.242 MPa
- S - 8: 316.564 MPa
Group 2 (Ultimate Tensile Stress ≥ 330 MPa):
- S - 3: 357.562 MPa
- S - 5: 341.376 MPa
- S - 6: 342.655 MPa
- S - 9: 350.565 MPa
2) ANOVA Analysis Requirements
Mean= ∑Ultimate Tensile Stress? / Number of Specimens
SS Total=∑(Value−Mean)2
DF Total=Number of Specimens−1
MS Error= SS Error? / DF Total
3) Calculations
Calculate Means:
- Group 1 Mean:
Mean1?=(328.680+326.857+322.681+321.242+316.564?)/5
= 1,615.024/5
?=323.005 MPa
- Group 2 Mean:
Mean2?=(357.562+341.376+342.655+350.565?)/4=348.040 MPa
4) Calculate Overall Mean
Overall Mean= ∑Ultimate Tensile Stress? / Total number of specimens
Overall Mean=(1,615.024+1,392.158) / 9 ?=334.02 MPa
Calculate Sum of Squares Between Groups (SSB):
SSB=n1?×(Mean1?−Overall Mean)2+n2?×(Mean2?−Overall Mean)2
SSB=5×(323.005−334.02)2+4×(348.040−334.02)2
SSB=5×(−11.015)2+4×(14.020)2
SSB=5×121.33+4×196.56=606.63+786.24=1,392.87 MPa2
Calculate Sum of Squares Within Groups (SSW):
Group 1 Variance:
SSW1?= (328.680−323.005)2+(326.857−323.005)2+(322.681−323.005)2+(321.242−323.005)2+(316.564−323.005)2
SSW1?=32.78+15.60+0.10+2.99+42.19=93.66 MPa2
Group 2 Variance:
SSW2?=(357.562−348.040)2+(341.376−348.040)2+(342.655−348.040)2+(350.565−348.040)2
SSW2?=90.79+44.56+29.29+6.37=171.01 MPa2
Total SSW:
SSW=SSW1?+SSW2?=93.66+171.01=264.67 MPa2
5) Degrees of Freedom
Between-Groups DF:
DF Between=k−1=2−1=1
Within-Groups DF:
DF Within=N−k=9−2=7
Total DF:
DF Total=N−1=9−1=8
Calculate Mean Squares:
Between-Groups Mean Square (MSB):
MSB= SSB? / DF Between = 1,392.87 / 1 ?=1,392.87 MPa2
Within-Groups Mean Square (MSW):
MSW = SSW? / DF Within = 264.67 / 7 ?≈37.81 MPa2
Calculate F-Value:
F-Value = MSB / MSW ?= 1,392.87 / 37.81 ?≈36.9
6) Determine P-Value
p-value associated with the F-distribution for DF1 = 1 and DF2 = 7. With such a high F-value, the p-value is expected to be very small (much less than 0.05), indicating statistical significance. The high F-value indicates that the variability between the groups is much larger compared to the variability within the groups. The very small p-value (below the common significance level of 0.05) suggests that the observed difference in Ultimate Tensile Stress between the two groups is statistically significant.
Since the p-value is significantly smaller than 0.05, we reject the null hypothesis that there is no difference in Ultimate Tensile Stress between the two groups. This means that the grouping based on Ultimate Tensile Stress (less than 330 MPa vs. 330 MPa or more) leads to a significant difference in the average stress values between the groups.
The significant result implies that there is a meaningful difference in Ultimate Tensile Stress between the two groups. This could be due to various factors such as material properties, processing conditions, or other variables influencing the stress characteristics.
|
Source |
DF |
Adj SS |
Adj MS |
F-Value |
P-Value |
|
UTS in MPa |
1 |
1,392.87 MPa² |
1,392.87 MPa² |
36.9 |
<0.05 |
Table 7: Statistical method used by ANNOVA
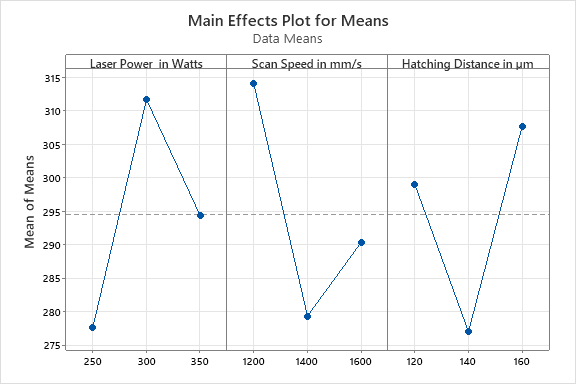
Figure 10: Main effect plot for means by Taguchi.
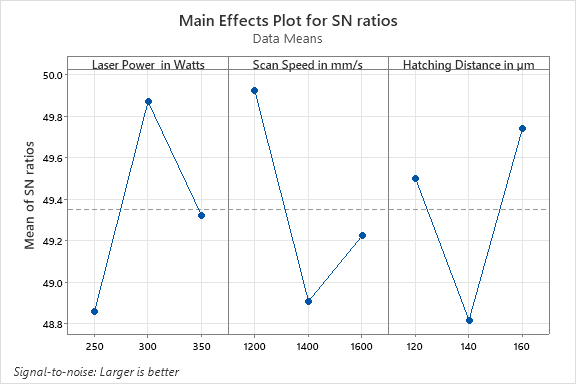
Figure 11: S/N ration graph for tensile strength.
E. Coding Algorithm for Alarm/Alert systems based on Build Chamber Temperature.
Temperature Alarm system design via Arduino Uno (UNO R3 SMD Atmega328P Board - Clone Compatible Model) involves connecting temperature sensor to the bread board (240-131), comprising of resistors, connectors, a buzzer – for alarming when the withstand temperature of the build chamber is reached.
Once the everything connected on bread board with Arduino uno systems as desired way, connect the Arduino uno to desktop/laptop, followed by coding in Arduino Uno IDE based of C language – OOPS based.
For to monitor the temperatures at certain time for all the specimen prints, we would be needing TMP36 sensor, 2X16 line display, buzzer, Arduino IDE 2.3.2 software. Software is made available https://www.arduino.cc/en/software, Arduino USB driver. Once the software and driver installed successfully on the laptop, we can code the below in this application.
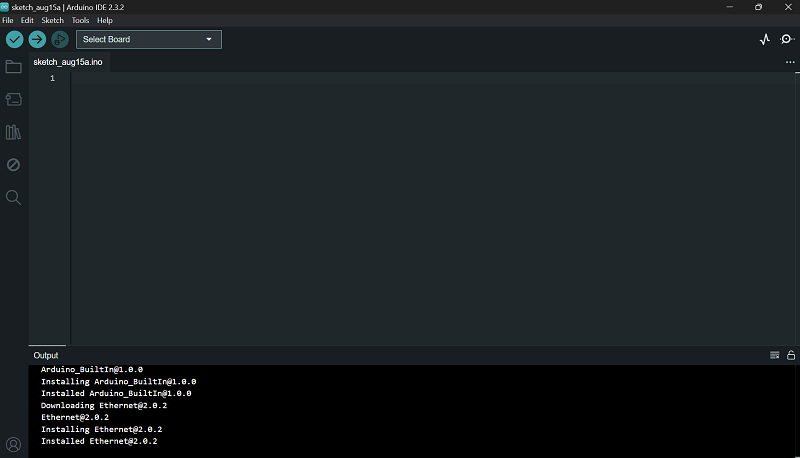
Figure 12: Arduino IDE 2.3.2 application.
The code buzzer the sounds if the temperature of the chamber reaches 200°C, and displays the time in seconds on an LCD.
#include <LiquidCrystal.h>
// Pin Definitions
const int temperaturePin = A0; // Analog pin for temperature sensor
const int buzzerPin = 8; // Digital pin for buzzer
const int buttonPin = 7; // Digital pin for button (if needed for LCD reset or other functionality)
// LCD Setup (pins may vary based on your connections)
LiquidCrystal lcd(12, 11, 5, 4, 3, 2);
// Temperature variables
int baselineTemp = 0;
int celsius = 0;
int fahrenheit = 0;
// Timer variables
unsigned long startTime;
unsigned long currentTime;
void setup() {
pinMode(temperaturePin, INPUT);
pinMode(buzzerPin, OUTPUT);
lcd.begin(16, 2); // Initialize the LCD
Serial.begin(9600);
// Initialize timer
startTime = millis();
}
void loop() {
int sensorValue = analogRead(temperaturePin);
celsius = map(sensorValue, 0, 1023, -40, 125);
fahrenheit = ((celsius * 9) / 5 + 32);
// Check if temperature is above 200°C
if (celsius >= 200) {
digitalWrite(buzzerPin, HIGH); // Turn on buzzer
} else {
digitalWrite(buzzerPin, LOW); // Turn off buzzer
}
// Calculate elapsed time in seconds
currentTime = millis();
unsigned long elapsedTime = (currentTime - startTime) / 1000; // Time in seconds
// Print to Serial Monitor
Serial.print("Raw value: ");
Serial.print(sensorValue);
Serial.print(" ---- ");
Serial.print(celsius);
Serial.print(" C, ");
Serial.print(fahrenheit);
Serial.println(" F");
// Display on LCD
lcd.clear();
lcd.setCursor(0, 0);
lcd.print("Temp: ");
lcd.print(celsius);
lcd.print(" C");
lcd.setCursor(0, 1);
lcd.print("Time: ");
lcd.print(elapsedTime);
lcd.print(" sec");
delay(1000); // Update every second
}
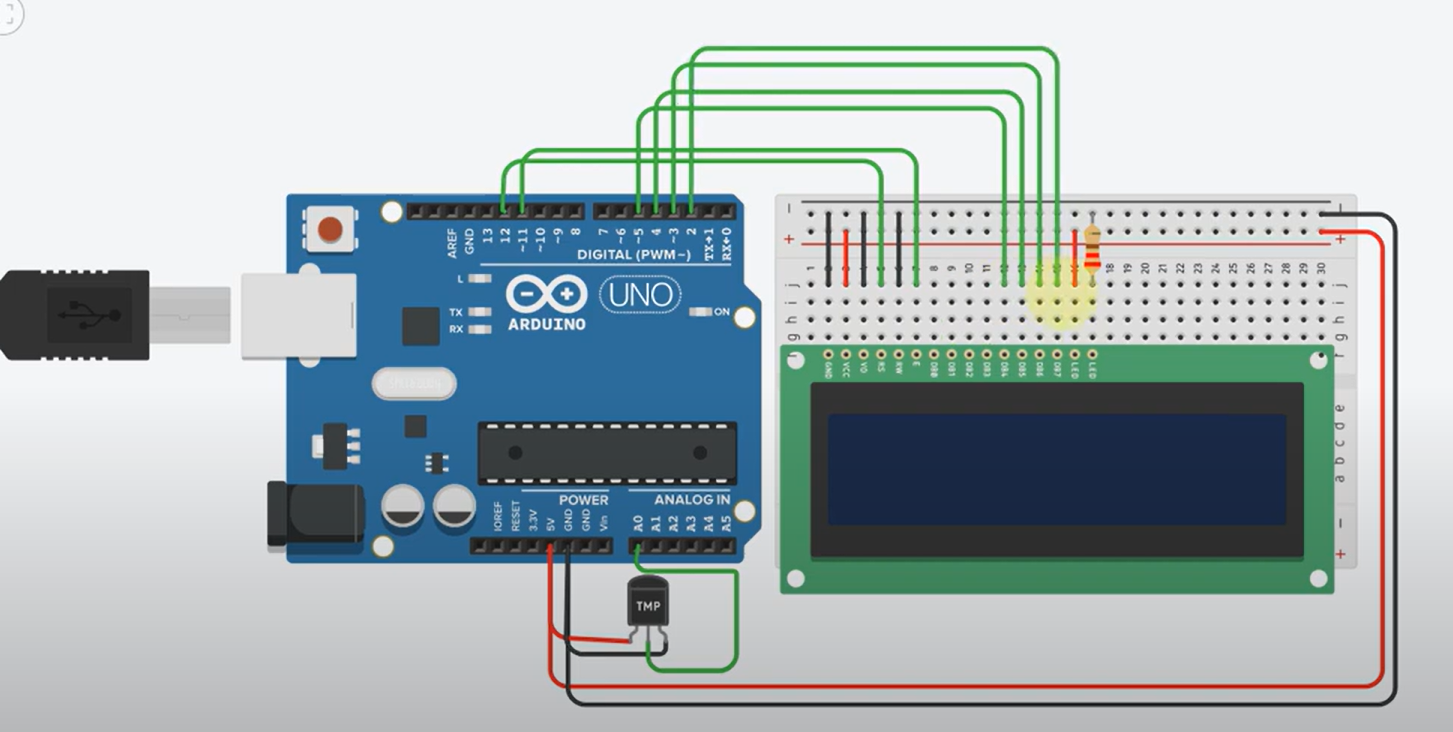
Figure 13: Arduino UNO board with sensor connected with bread board and digital indicator and buzzer
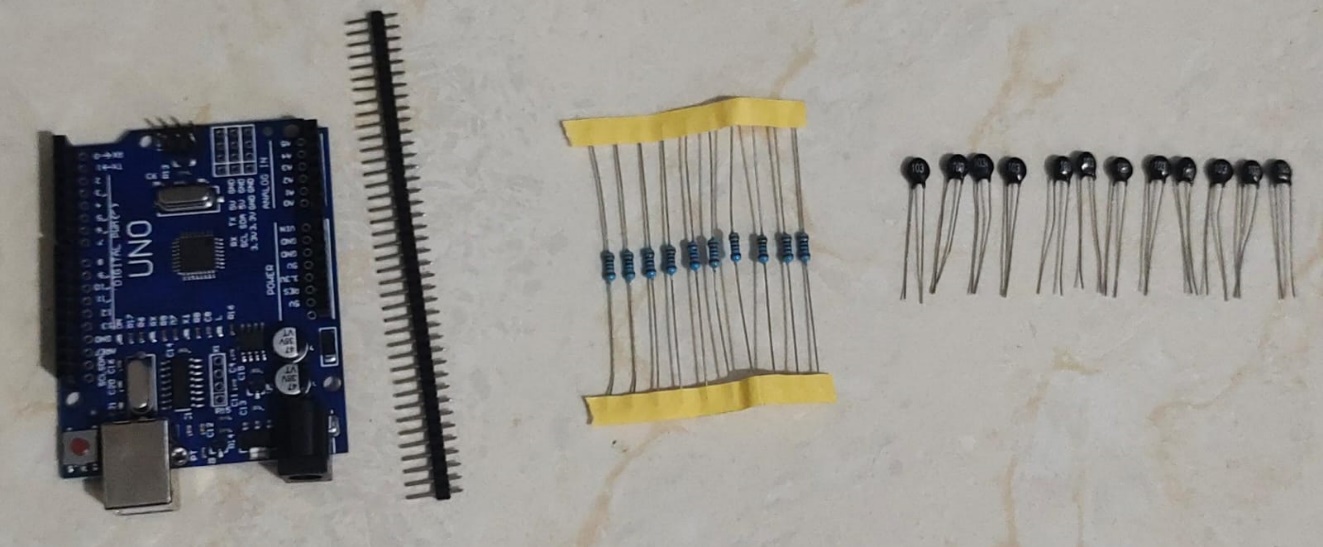
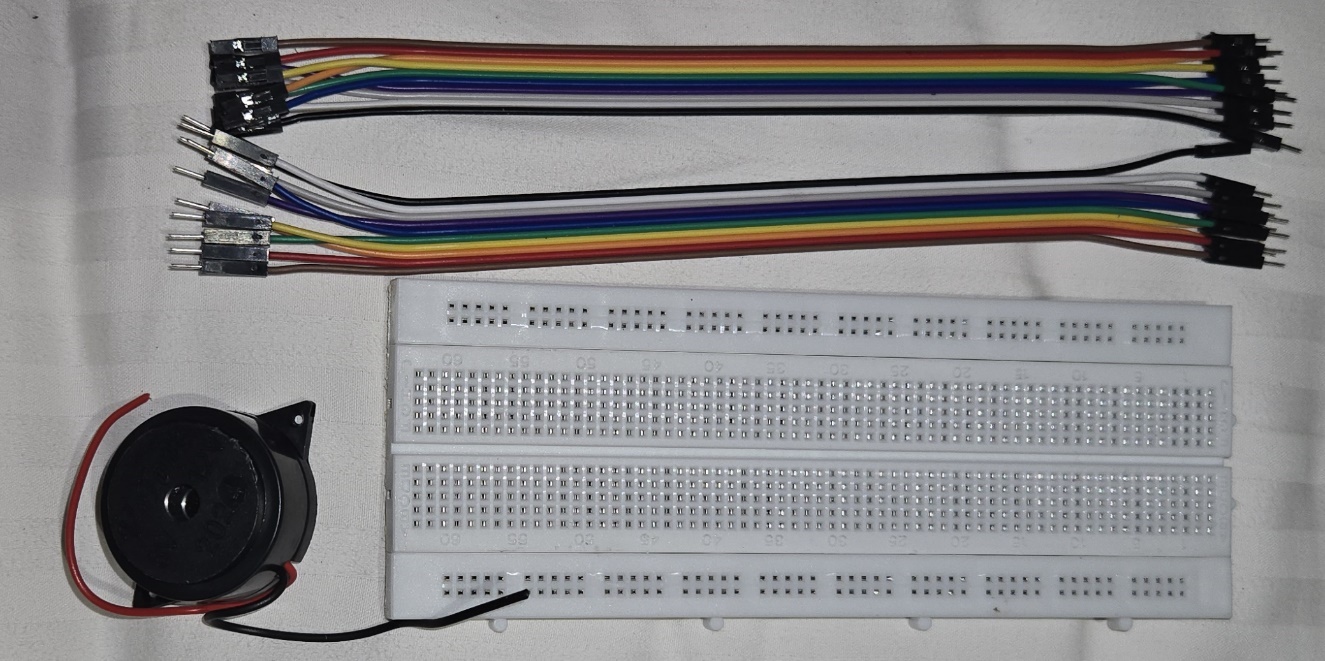 Figure 14: Arduino UNO board with sensor, cables, bread board, sensors, buzzer, and resistors
Table 8 Temperatures of each specimen (when 1500C) recorded w.r.t time in seconds
|
Specimen No. |
Temperature in degree centigrade |
Time in seconds |
|
S1 |
150 |
1801 |
|
S2 |
150 |
1790 |
|
S3 |
150 |
1805 |
|
S4 |
150 |
1795 |
|
S5 |
150 |
1802 |
|
S6 |
150 |
1799 |
|
S7 |
150 |
1802 |
|
S8 |
150 |
1810 |
|
S9 |
150 |
1800 |
IV. SUMMARY
The additive manufacturing, one of the most promising areas for cleaner and more resource-efficient production is Selective Laser Melting and other similar technologies. The build speed is too low for AM technologies to be used in production just now, thus they are mostly used for design and product development. Therefore, improving the performance and build rate of the present process is essential for the implementation of sustainable AM methods like SLM.
- This finding has important implications for the technology's potential industrial uses, particularly in the realm of eco-designed goods, where extensive creative flexibility is essential. New environmentally friendly components might be made possible in a number of sectors by combining high power selective laser melting with the ubiquitous aluminum alloy AlSi10Mg and the process's unfettered design flexibility.
- According to the study's findings, a 350 W laser may significantly boost the construction pace while making AlSi10Mg components. We were able to achieve densities exceeding 99.5% despite increasing the scanning velocity and scanline spacing with the greater laser power.
- At these process parameters—a laser power of 350 W, a scan speed of 1200 mm/s, and a hatching distance of 160 µm—we were able to generate a component devoid of defects and distortion. The mechanical characteristics measured at these parameters reveal an ultimate tensile strength of 340 MPa, yield strength of 130 MPa, elongation of 5.2%, and hardness of 128±5 HV (when applied to 1000 grams with a holding period of 10 seconds).
- Using an analysis of variance (ANOVA), we found that, among the experimental conditions, laser power contributed 18.74%, scan speed 14.39%, and hatching distance 11.39%.
- The time interval variance in seconds, taken by all the specimens, when the build chamber’s temperature 150th degree is proven to be another impacting factor for differing mechanical properties of the alloy.
References
[1] Read N, Wang W, Essa K, Attallah MM. Selective laser melting of AlSi10Mg alloy: Process optimisation and mechanical properties development. Materials & Design (1980-2015). 2015 Jan 1;65:417-24. [2] Bai Y, Yang Y, Xiao Z, Zhang M, Wang D. Process optimization and mechanical property evolution of AlSiMg0. 75 by selective laser melting. Materials & Design. 2018 Feb 15;140:257-66. [3] Praneeth J, Venkatesh S, Krishna LS. Process parameters influence on mechanical properties of AlSi10Mg by SLM. Materials Today: Proceedings. 2023 Jan 2. [4] Nirish M, Rajendra R. Suitability of metal additive manufacturing processes for part topology optimization–A comparative study. Materials Today: Proceedings. 2020 Jan 1;27:1601-7. [5] Kempen K, Thijs L, Yasa E, Badrossamay M, Verheecke W, Kruth JP. Process optimization and microstructural analysis for selective laser melting of AlSi10Mg. [6] Majeed A, Ahmed A, Salam A, Sheikh MZ. Surface quality improvement by parameters analysis, optimization and heat treatment of AlSi10Mg parts manufactured by SLM additive manufacturing. International Journal of Lightweight Materials and Manufacture. 2019 Dec 1;2(4):288-95. [7] Bai Y, Yang Y, Xiao Z, Zhang M, Wang D. Process optimization and mechanical property evolution of AlSiMg0. 75 by selective laser melting. Materials & Design. 2018 Feb 15;140:257-66. [8] WANG Y, WANG J, ZHANG H, ZHAO H, NI D, XIAO B, MA Z. Effects of heat treatments on microstructure and mechanical properties of AlSi10Mg alloy produced by selective laser melting. Acta Metall Sin. 2020 Nov 5;57(5):613-22. [9] Nirish M, Rajendra R. Optimization of process parameter and additive simulation for fatigue strength development by selective laser melting of AlSi10Mg alloy. International Journal of Mechanical Engineering. 2022;7(2):3795-802. [10] Jing CH, Wei HO, Xiuzhuan WA, Songlin CH, Zhiyi YA. Microstructure, porosity and mechanical properties of selective laser melted AlSi10Mg. Chinese Journal of Aeronautics. 2020 Jul 1;33(7):2043-54. [11] Trevisan F, Calignano F, Lorusso M, Pakkanen J, Aversa A, Ambrosio EP, Lombardi M, Fino P, Manfredi D. On the selective laser melting (SLM) of the AlSi10Mg alloy: process, microstructure, and mechanical properties. Materials. 2017 Jan 18;10(1):76. [12] Nirish M, Rajendra R, Karolla B. Laser Powder Bed Fusion Process Optimization of AlSi10Mg Alloy Using Selective Laser Melting: Dynamic Performance of Fatigue Behaviour, Microstructure, Hardness and Density. Journal of Mechanical Engineering (1823-5514). 2023 Jan 15;20(1). [13] Salandari-Rabori A, Wang P, Dong Q, Fallah V. Enhancing as-built microstructural integrity and tensile properties in laser powder bed fusion of AlSi10Mg alloy using a comprehensive parameter optimization procedure. Materials Science and Engineering: A. 2021 Feb 23;805:140620. [14] Kempen K, Thijs L, Van Humbeeck J, Kruth JP. Processing AlSi10Mg by selective laser melting: parameter optimisation and material characterisation. Materials Science and Technology. 2015 Jun;31(8):917-23. [15] Majeed A, Lv J, Zhang Y, Muzamil M, Waqas A, Shamim K, Qureshi ME, Zafar F. An investigation into the influence of processing parameters on the surface quality of AlSi10Mg parts by SLM process. In2019 16th international Bhurban conference on applied sciences and technology (IBCAST) 2019 Jan 8 (pp. 143-147). IEEE. [16] Nirish M, Rajendra R. Fatigue Performance Improvement of AlSi10Mg Manufactured by Selective Laser Melting through Heat Treatment. Journal of Mechanical Engineering Research and Development. 2022;45(3):01-13. [17] Zou J, Zhu Y, Pan M, Xie T, Chen X, Yang H. A study on cavitation erosion behavior of AlSi10Mg fabricated by selective laser melting (SLM). Wear. 2017 Apr 15;376:496-506. [18] Majeed A, Lv J, Zhang Y, Muzamil M, Waqas A, Shamim K, Qureshi ME, Zafar F. An investigation into the influence of processing parameters on the surface quality of AlSi10Mg parts by SLM process. In2019 16th international Bhurban conference on applied sciences and technology (IBCAST) 2019 Jan 8 (pp. 143-147). IEEE. [19] Liu J, Shi Y. Multi-objective Optimization in Selective Laser Melting of AlSi10Mg Alloy Based on Response Surface Methodology. Journal of Materials Engineering and Performance. 2024 Apr 12:1-1. [20] Rosenthal I, Shneck R, Stern A. Heat treatment effect on the mechanical properties and fracture mechanism in AlSi10Mg fabricated by additive manufacturing selective laser melting process. Materials Science and Engineering: A. 2018 Jun 27;729:310-22.
Copyright
Copyright © 2024 Sathish Kotha, Prof. Pappula Laxminarayana, Prof. K Shyamala, Dr. K. Buchaiah. This is an open access article distributed under the Creative Commons Attribution License, which permits unrestricted use, distribution, and reproduction in any medium, provided the original work is properly cited.

Download Paper
Paper Id : IJRASET64028
Publish Date : 2024-08-20
ISSN : 2321-9653
Publisher Name : IJRASET
DOI Link : Click Here
 Submit Paper Online

