

Ijraset Journal For Research in Applied Science and Engineering Technology
Semiorganic Crystal Mixed Crystal Hexakis(Urea)Cobalt(II) Sulfate Monohydrate - Optical, Thermal and Mechanical
Authors: Shaik Alla Nazeer, G. Ramasamy
DOI Link: https://doi.org/10.22214/ijraset.2025.66537
Certificate: View Certificate
Abstract
Single crystals of hexakis(urea)cobalt(II) sulfate monohydrate have been grown by slow evaporation solution growth technique at room temperature. The single crystal X-ray diffraction study reveals that the crystal belongs to orthorhombic system with noncentrosymmetric space group Pca21 and the cell parameters are, a = 15.0549(6) A? , b = 7.2105(3) A? , c = 20.0284(9) A? , V = 2174.15 (16) A? 3 and Z = 4. The functional groups of the metal–urea complex were con?rmed by Fourier transform infrared spectroscopy. The powder X-ray diffraction study reveals the crystallinity of the as-grown material. The band-gap energy of the specimen is estimated by Kubelka–Munk algorithm. The dielectric results indicate an increase in dielectric and conductivity parameters with an increase of temperature at all frequencies. The crystal is further characterized by mechanical and thermal analysis.
Introduction
I. INTRODUCTION
Urea crystal is the ?rst organic crystal successfully used in an optical parametric oscillator [1]. It has large nonlinear optical coef?cients, high birefringence, high laser damage threshold and nonlinear optical applications in UV because of its transparency range extending to 200 nm in the short wavelength limit [2] and it also serves as a better crystal compared to KDP for its nonlinear optical coef?cient [3]. Derivatives of urea offer a wide choice of novel materials, expected to play an important role in the development of nonlinear optical (NLO) devices [4] and its derivatives are potential candidates for nonlinear optics [5–7]. The structural and spectroscopic properties of metal–urea com- plexes have been reviewed [8]. The metal–urea complexes are interesting group of compounds with which to investigate the metal–oxygen and metal–nitrogen chemical bonds and the effect of metal interaction on the structure and properties of urea. Metal–amide complexes are of great signi?cant to the pharma- ceutical and medical sciences, for instance antimicrobial and antivirial properties, and could be effective against diseases [8].
Number of cobalt(II) urea complexes have been reported [9–15]. In all cases the urea ligand is bound to the metal atom through an oxygen–metal bond, except for [Co(urea)4](NO3)2, where an urea molecule binds to two metal atoms via two coordination sites viz., one from the oxygen atom and the other from the nitrogen atom [14]. However, all these studies mainly focused on the structural determination of cobalt(II) urea com- plexes. As far as we know, there is no reference in literature regarding the growth and characterization of metal–urea com- plexes. In the present study, we report the growth, structure and characterization of hexakis(urea)cobalt(II) sulfate monohydrate (HUCS) crystals.
II. EXPERIMENTAL
A. Synthesis and Crystal Growth
HUCS was synthesized using AR grade cobalt(II) sulfate hap- tahydrate (E-Merck) and urea (E-Merck) in a stoichiometric ratio of 1:6. The reactants were dissolved in triply distilled water, thoroughly mixed using a magnetic stirrer (3 h). The solution was tightly covered with a perforated polythene sheet and kept at a constant temperature ( ~ 35 1C). The crystallization took place in a period of 30–35 days and the crystals were harvested when they attained suitable size and shape. Photograph of the as-grown HUCS crystal is shown in Fig. 1.
B. Characterization
The Fourier transform IR (FT-IR) spectrum was recorded using AVATAR 330 FT-IR by the KBr pellet technique. The structural analysis of HUCS was carried out for a selected tablet of approxi- mately 0.30 ~ 0.25 ~ 0.20 mm3 using Bruker AXS (Kappa APEXII) X-ray diffractometer. Single crystal XRD data were collected on a diffraction system which employs graphite monochromated Mo Ka radiation (l 0.71073 A? ). The structures were solved and re?ned by full matrix least squares on F2 with WinGx soft- ware package utilizing SHELXS97 and SHELXL97 modules. The powder XRD pattern is recorded by PANalytical X’pert PRO X-ray diffractometer. UV–vis spectrum was recorded using CARY 5E UV–vis spectrophotometer in the spectral range 200–900 nm. DSC analysis was carried out using SDT Q600 (TA instrument) thermal analyzer. The Vickers microhardness was evaluated for the well polished grown crystal using Reichert 4000E Ultrami- crohardness tester. Dielectric measurements were carried out by the parallel plate capacitor method as a function of temperature for various frequencies using a Precision LCR meter (AGILENT 4284 A model).
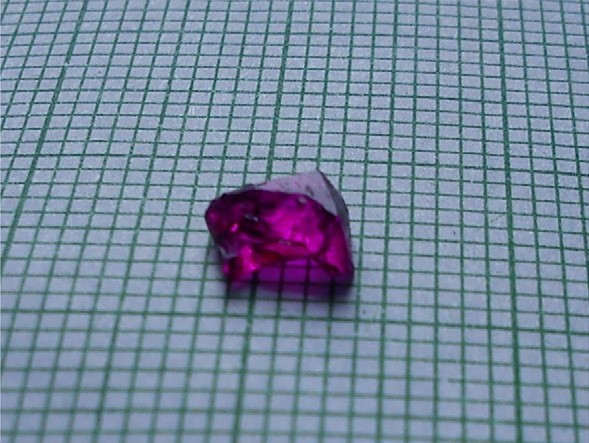
Fig. 1. Photograph of the as-grown HUCS crystal.
III. RESULTS AND DISCUSSION
A. FT-IR Analysis
Urea has three coordination sites viz., the carbonyl oxygen and the two nitrogen atoms. Among the three coordinating sites, urea usually acts as a monodentate ligand except in [Co(H2N- CONH2)4](NO3)2 [14] complex in which it acts as a bidentate ligand. The formation of unidentate oxygen–metal bonds between urea molecules and metal ions causes only minor changes in the infrared spectrum of urea molecule [8]. The FT-IR spectrum of HUCS crystal is shown in Fig. 2. The infrared spectrum con?rmed that the coordination of the metal ions with the urea molecules is through oxygen rather than the nitrogen atom. A decrease in the N–H stretching frequency of the complex compared to the free ligand indicates N-coordination, while a decrease in the C–O stretching frequency and an increase in C–N stretching frequency indicate O-coordination [16]. The C–N stretching frequencies at 1471 and 1001 cm—1 of urea are shifted to higher frequencies (1486 and 1024 cm—1) and the N–H stretching vibrations at 3460 and 3350 cm—1 of urea [17] are shifted to lower frequencies ( ~ 3424 and ~ 3320 cm—1). The C–O stretching ( ~ 1680 cm—1) and N–H bending ( ~1630 cm—1) vibrations of urea [17] are shifted to lower frequencies ( ~ 1649 and ~1616 cm—1). The char- acteristic vibrational patterns of some metal urea complexes along with HUCS crystal are given in Table 1.
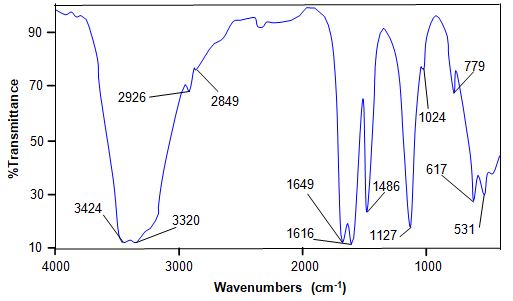
Fig. 2. FT-IR spectrum of HUCS.
B. Single crystal XRD analysis
The structural analysis of HUCS crystal was carried out by single crystal XRD analysis. The ORTEP and packing diagrams of HUCS crystal are given in Figs. 3 and 4. It crystallizes in the orthorhombic system with noncentrosymmetric space group Pca21 and crystal data are given in Table 2. These lattice parameters closely match the previous study [18] of structure determination of HUCS. The central cobalt atom is coordinated by six oxygen atoms of urea molecule with Co–O–C bond angles ranging from 128.28(18)1 to 135.61, O–Co–O bond angles widely ranging from 85.85(7)1 to 178.57(8)1 and Co–O bond lengths lying in the range from 2.0730(19) to 2.1431(18) A? in a distorted octahedral geometry. The crystal contains [Co(CO(NH ) ]2þ cations, stacks of SO2— anions and free water molecule. It has been reported that these crystals are isostructural to the Ni(II) [19] and Zn(II) [20] hexakis(urea) complexes. Crystal system, space group and cell parameters of some cobalt(II)–urea complexes are given in Table 3.
C. Powder XRD Analysis
The indexed powder XRD pattern of the as-grown HUCS crystal pattern is shown in Fig. 5. It shows that the sample is of single phase without any detectable impurity. Narrow peaks indicate the good crystallinity of the material. The observed peaks are in good agreement with the JCPDS ?le [18]. The simulated XRD pattern using single crystal XRD data (Fig. 5a) closely resembles the experimental pattern.
D. Optical Studies
The optical absorption spectrum of the HUCS crystal (Fig. 6) shows two bands peaking at ~ 235 nm and ~535 nm. The absorption spectrum shows a band at ~ 535 nm, typical of octahedral geometry of cobalt(II) [21]. The Kubelka–Munk theory [22] provides a correlation between re?ectance and concentra- tion. The concentration of an absorbing species can be determined using the Kubelka–Munk formula,
FðRÞ¼ ð12RÞ2=2R ¼ a=s ¼ Ac=s
where F(R) is the Kubelka–Munk function, R is the re?ectance of the crystal and s is scattering coef?cient, A is the absorbance and c is concentration of the absorbing species. The measurement of [F(R)hv] as a function of hv provides the band gap energy Eg of the material. The direct and indirect band gap energies can be obtained from the intercept of the resulting straight lines with
Table 1 FT-IR frequencies of some metal urea complexes (cm—1).
|
Complex |
n (N–H) |
d (N–H) |
n (C–O) |
nas (C– N) |
ns (C– N) |
Ref. |
|
Urea |
3460, 3350 |
1630, 1600 |
1680 |
1465 |
1000 |
|
|
HUCS |
3424, 3320 |
1616 |
1649 |
1476 |
1024 |
Present work |
|
Mn(ur)6(ClO4)2 |
3470, 3370 |
– |
1630 |
1470 |
1010 |
|
|
Mn(ur)6Br2 |
3420, 3300 |
– |
1610 |
1470 |
1015 |
|
|
Mn(ur)6I2 |
3400, 3370 |
– |
1610 |
1470 |
1015 |
|
|
Cr(ur)4Cl2 |
3500–3100 |
– |
– |
1485 |
1020 |
|
|
Al(ur)6(NO3)3 |
– |
– |
1662 |
1500 |
– |
|
|
Fe(ur)6(NO3)3 |
– |
– |
1655 |
1500 |
– |
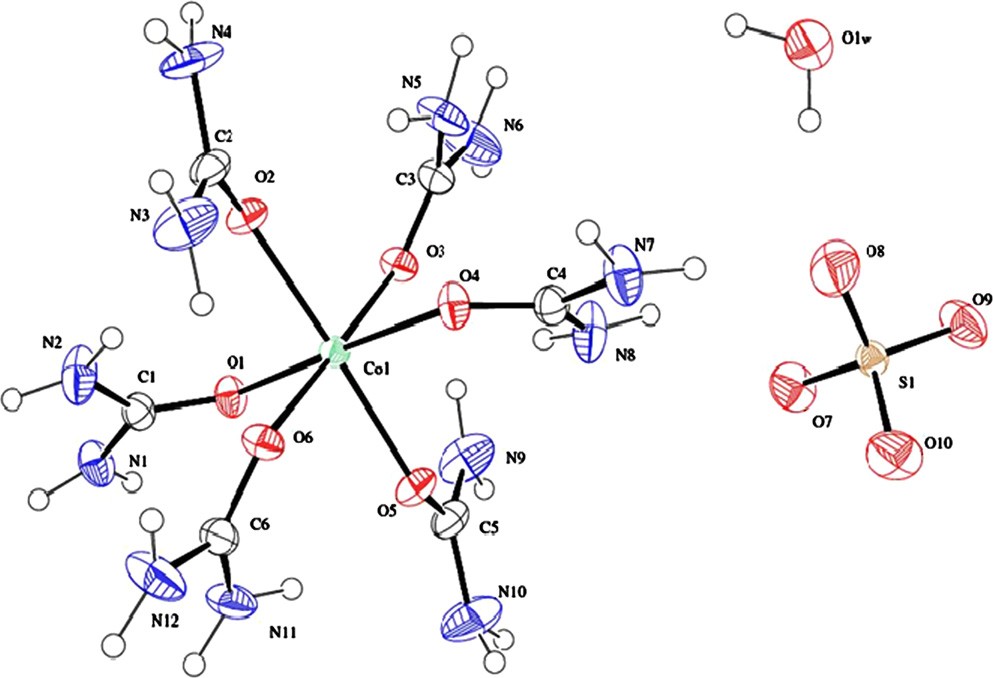 Fig. 3. ORTEP diagram of HUCS.
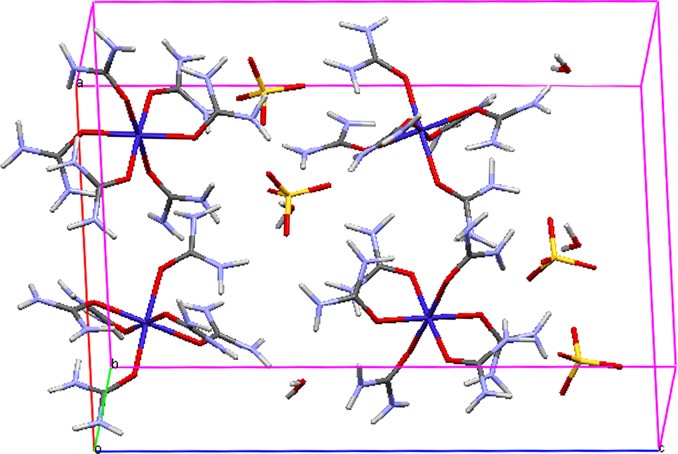
Fig. 4. Packing diagram of HUCS.
the energy axis at [F(R)hv]2¼ 0 and [F(R)hv]1/2¼ 0 respectively. The band gap energies of the specimens are deduced as 5.02 eV (direct) and 4.90 eV (indirect) (Fig. 7), which is smaller than the reported value of urea (6.18 eV, ~ 200 nm) [23]. First-principle calculations predict the direct band gap of 4.27 eV for urea [23].
E. DSC Analysis
The recorded DSC spectrum of HUCS is shown in Fig. 8. The decomposition was recorded from 0 to 300 1C. In the DSC curve, sharp endothermic peaks at 91 and 130 1C are due to the liberation of water molecules. The endothermic peak at 143 and 158 1C could be due to the decomposition of HUCS crystals into fragments and their subsequent volatilization.
F. Mechanical Studies
Transparent crystals free from cracks were selected for micro- hardness measurements. Before indentations, the crystals were carefully lapped and washed to avoid surface effects. The Vickers hardness indentations were made on the as-grown surface of the HUCS crystal at room temperature with the load ranging from 25 to 100 g, keeping the time of indentations as 10 s for all trials. The Vickers hardness number Hv was calculated from the
Table 2
Crystal data and structure re?nement for HUCS crystal.
Chemical formula C6 H26 Co N12 O11 S
Formula weight 533.38
Temperature 293 K
Wavelength 0.71073 A?
Crystal system, space group Orthorhombic, Pca21
Unit cell dimensions a ¼ 15.0549(6)A? , a ¼ 901 b ¼ 7.2105(3) A? , b¼ 901 c ¼ 20.0284(9) A? , g¼ 901
Volume 2174.15(16) A? 3
Z, Calculated density 4, 1.630 Mg/m3
Absorption coef?cient 0.960 mm—1
F(000) 1108
Crystal size 0.30 ~ 0.25 ~ 0.20 mm3
Theta range for data collection 2.71 — 32.901
Limiting indices — 18r h r 22, — 6r k r 10, — 29 rl r 27
Re?ections collected/unique 16,634/6897 [R(int) ¼ 0.0331]
Completeness to theta¼ 25.00 98.1%
Absorption correction Semi-empirical from equivalents
Max. and min. transmission 0.8311 and 0.7615
Re?nement method Full-matrix least-squares on F2
Data/restraints/parameters 6897/34/383
Goodness-of-?t on F2 1.015
Final R indices [I 42sigma(I)] R1 ¼ 0.0402, wR2¼ 0.1001
R indices (all data) R1 ¼ 0.530, wR2¼ 0.1075
Absolute structure parameter 0.071(10)
Largest diff. peak and hole 1.027 and — 0.779 e A? — 3
Table 3
System, space group and cell parameters of some cobalt(II)- urea complexes.

Following equation:
v ¼ 1:8544 ~ P=d kg=mm ,
where P is the applied load in kg and d is the mean diagonal length of the indentation impression in micrometer. A plot of load (P) versus Vickers hardness number (Hv) reveals that the hardness of the grown crystal increases as the load increases (Fig. 9). Cracks started developing around the indentation mark beyond a load of 100 g. This may be due to the internal stresses released during the indentation. Mayer’s index number (n) or work hardening index is calculated from the slope of the straight line plot between log d and log P and it is equal to 5.3, classifying HUCS crystal to soft material category.
G. Dielectric properties
Fig. 10(a–c) are the plots of dielectric constant (er), dielectric loss (tan d) and AC conductivity (sac) versus temperature at different frequencies. It can be seen that dielectric parameters, viz. dielectric constant, dielectric loss and AC conductivity increase with the increase in temperature. er and the tan d values decrease with the increase in frequency while sac increases with the increase in frequency.
The dielectric constant of the material is generally composed of four different types of contributions like ionic, electronic, orientational and space charge polarizations. The large value of dielectric constant at low frequencies may be due to the contribution of all these polarizations. The decreased dielec- tric constant at higher frequencies could be due to the reduction in the space charge polarization. Space charge polarization is generally active at lower frequencies and high temperatures indicating the purity and perfection of the grown crystal [24]. The increase in conductivity could be attributed to the reduction in the space charge polarization at higher frequencies [25]. In the present study, dielectric constant varying proportionally with temperature is essentially due to the temperature variation of the polarizability [26]. The low er value dielectric materials have potential applications in microelectronic industries.
Conclusion
Transparent pink colored crystals of hexakis(urea)cobalt(II) sulfate monohydrate were grown in de-ionized water by slow condensation of aqueous solution. It belongs to orthorhombic system with noncentrosymmetric space group Pca21. The various functional groups and crystallinity of the as-grown specimens were con?rmed by FT-IR and powder X-ray diffraction analyses. The direct and indirect band gap energies fall in close range and they are lower than the Eg of urea. The low dielectric constant at high frequency is indicative of a less defective good quality optical crystal. The central metal atom cobalt is coordinated by six oxygen atoms of urea molecules in a distorted octahedral geometry.
References
[1] C.C. Catella, J.H. Bohn, J.R. Luken, IEEE Journal of Quantum Electronics QE-24 (1988) 1201. [2] L. Zeng, M. Zha, M. Aridoino, P. Franzosi, L. Zanotti, G. Zuccalli, C. Paorici, Journal of Crystal Growth 166 (1996) 528. [3] V.G. Dmitriev, G.G. Gurzadyan, D.N. Nikogosyam, Handbook of Nonlinear Optical Crystals, second edition, Verlag, Berlin Heidelberg New York, 1997 148 pp. [4] T. UmaDevi, N. Lawrence, R. RameshBabu, S. Selvanayagam, H. Stoeckli-Evans, K. Ramamurthi, Journal of Crystal Growth 311 (2009) 3485. [5] M. Fanqing, L. Mengkai, Z. Hong, Crystal Research and Technology 31 (1996) 33. [6] V.K. Dixit, S. Vanishri, H.L. Bhat, E.M. Gomes, M. Belsley, C. Santinha, G. Arunmozhi, V. Venkataramanan, F. Proena, A. Criado, Journal of Crystal Growth 253 (2003) 460. [7] F.Q. Meng, M.K. Lu, S.J. Zhang, J. Chen, Materials Research Bulletin 31 (1996) 761. [8] T. Theophanides, P.D. Harvey, Coordination Chemistry Reviews 76 (1987) 237. [9] L. Drakopoulou, C. Papatriantafyllopoulou, A. Terzis, S.P. Perlepes, E.M. Zoupa, G.S. Papaefstathiou, Bioinorganic Chemistry and Applications 51567 (2007) 1. [10] N.E. Kuzmina, K.K. Palkina, E.V. Savinkina, I.A. Kozlova, N.T. Kuznetzov, Russian Journal of Inorganic Chemistry 45 (2000) 6. [11] N.E. Kuzmina, K.K. Palkina, E.V. Savinkina, N.T. Kuznetsov, I.A. Kozlova, Russian Journal of Inorganic Chemistry 45 (2000) 697. [12] M.T. Toshev, K.B. Dustov, S.O. Saidov, Russian Journal of Inorganic Chemistry 21 (1995) 124. [13] K. Suleimanov, A.S. Antsyshkina, V.Y. Dudarev, L.V. Fykin, M.A. Porai-Koshits, Soviet Journal of Coordination Chemistry 10 (1985) 699. [14] P.S. Gentile, J. White, S. Haddad, Inorganica Chimica Acta 8 (1974) 97. [15] A. Krawczuk, K. Stadnicka, Acta Crystallographica C63 (2007) m448. [16] L.F. Larkworthy, M.H.O. Nelson-Richardson, Inorganica Chimica Acta 28 (1978) 251. [17] J.P. Barbier, R. Hugel, Inorganica Chimica Acta 10 (1974) 93. [18] V.I. Ponomarenko, E.N. Kurkutova, M.A. Porai-Koshits, K. Sulaimankulov, Doklady Akademii Nauk SSSR 234 (1977) 1074. (JCPDS ?le no. 83-2097). [19] M. Auernhammer, T. Bauer, E. Tillmans, R.X. Fischer, University of Wuerzburg, Germany, ICDD, Grant-in-Aid, 1991 (JCPDS ?le no. 42-0675). [20] M. Auernhammer, T. Bauer, E. Tillmans, R.X. Fischer, University of Wuerzburg,Germany, ICDD, Grant-in-Aid, 1991 (JCPDS ?le no. 42-0678). [21] G. Yagupsky, R.H. Negrotti, R. Levitus, Journal of Inorganic and Nuclear Chemistry 27 (1965) 2603. [22] P. Kubelka, Journal of the Optical Society of America 38 (1948) 448. [23] Z. Lin, Z. Wang, C. Chen, The Journal of Chemical Physics 118 (2003) 2349. [24] P.N. Prasad, G. Prasad, T. Bhimasankaran, S.V. Suryanarayan, G.S. Kumar, Indian Journal of Pure and Applied Physics 4 (5) (1996) 639. [25] A.K. Jonscher, Nature 267 (1997) 673. [26] M. Priya, C.K. Mahadevan, Physica B—Condensed Matter 403 (2008) 67. [27] M.S. Lupin, G.E. Peters, Thermochimica Acta 73 (1984) 79.
Copyright
Copyright © 2025 Shaik Alla Nazeer, G. Ramasamy. This is an open access article distributed under the Creative Commons Attribution License, which permits unrestricted use, distribution, and reproduction in any medium, provided the original work is properly cited.

Download Paper
Paper Id : IJRASET66537
Publish Date : 2025-01-15
ISSN : 2321-9653
Publisher Name : IJRASET
DOI Link : Click Here
 Submit Paper Online