Ijraset Journal For Research in Applied Science and Engineering Technology
- Home / Ijraset
- On This Page
- Abstract
- Introduction
- Conclusion
- References
- Copyright
Simulation of Rainfall Run off Process using HEC-HMS: A Case Study of Upper Godavari Basin (M.S., India)
Authors: Dr. Dattatray K. Rajmane, Mr. Shubham D. Ghungarde, Mr. Satyam B. Daule, Mr. Devidas G. Darandale, Mr. Dnyaneshwar D. Kashid
DOI Link: https://doi.org/10.22214/ijraset.2023.54899
Certificate: View Certificate
Abstract
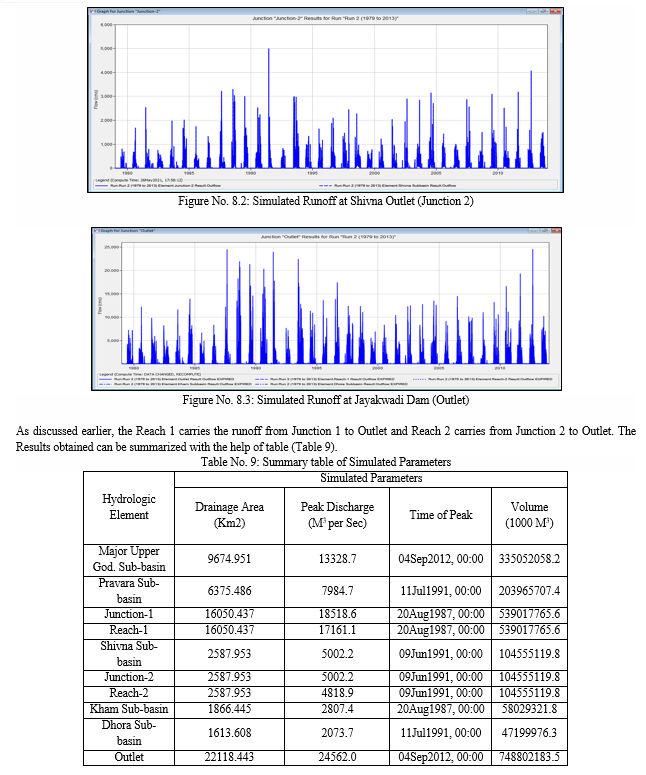
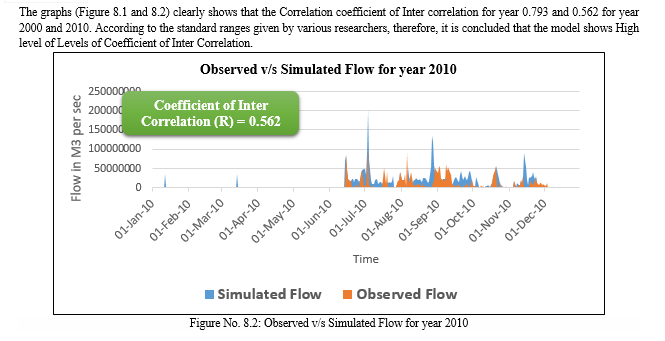
Runoff plays an important role in the hydrological cycle by returning excess precipitation to the oceans and controlling how much water flows into stream systems. “Modelling runoff can help to understand, control, and monitor the quality and quantity of water resources.” (Jan Sitterson et. al.) Therefore, the present work entitled “Simulation of Rainfall Runoff process using HEC-HMS; A Case study of Upper Godavari Basin (M.S., India)”is undertaken for the present research work. The latest version Q-GIS 3.18 is used for numerous purposes such as Maps preparation, Implementation of Theisen polygon method and Delineation of watershed, sub-watersheds and inclusive streams while HEC-HMS 4.7.1 is used to simulate the complete hydrologic processes of the present dendritic watershed system. Estimation of all input parameters with their appropriate methods are discussed in detail in this study and Runoff is simulated at outlet of each sub-basin. The Model efficiency is assessed with the help of Coefficient of Inter Correlation, it gives values as 0.793 and 0.562 for year 2000 and 2010. It is concluded that the model shows High level of Coefficient of Inter Correlation. On the line of present study, it is concluded that, “The Hydrologic Engineering Centres Hydrologic Modelling System (HEC-HMS) watershed model can be effectively used to simulate Rainfall Runoff process to estimate basin’s hydrological phenomenon caused due to precipitation.” “The increase in Urbanization & change in Landuse pattern in the Upper Godavari basin have definitely increased the peak runoff significantly especially in Kham sub-basin.”
Introduction
I. INTRODUCTION
WATER is scarce and there are millions of people across this globe who spend their entire day searching for it; so there is primary need to save water. “Runoff plays an important role in the hydrological cycle by returning excess precipitation to the oceans and controlling how much water flows into stream systems.” “Modelling runoff can help to understand, control, and monitor the quality and quantity of water resources.” (Jan Sitterson et. al., 2017) [1]
In the view of above discussion;
- Watershed management is really an important subject which is helpful in future planning of Hydro projects & Natural resource management.
- Extensive care should be given to the operation & management of river basins & dam reservoirs – no matter are they used for water supply or flood control or both.
Therefore, the present research paper entitled “Simulation of Rainfall Runoff process using HEC-HMS; A Case study of Upper Godavari Basin (M.S., India)” is undertaken for the study.
II. AIM AND OBJECTIVES
“The present study aims at finding out significance of Q-GIS and HEC-HMS in delineation and simulation of Rainfall-Runoff process in the Upper Godavari basin with outlet point at Jayakwadi (Nathsagar) dam.” The following specific objectives can be useful to carry out the present study;
- To Delineate the Watershed and Streams using open source Q-GIS software.
- To use the HEC-HMS for estimating the basin’s hydrological response to Precipitation.
- To assess the change in Runoff with response to urbanisation within the basin.
III. STUDY AREA
The Upper Godavari Watershed is selected as the study area in the state of Maharashtra, India. The catchment lies in the rain shadow zone of the western ghat. The catchment lies between 1901’54’’ to 20026’11’’ N Latitude and 73027’32’’ to 75028’21’’ E Longitude. The region with irregular shape has 1298.160 km perimeter spread over an area of 22118.443 sq. km.

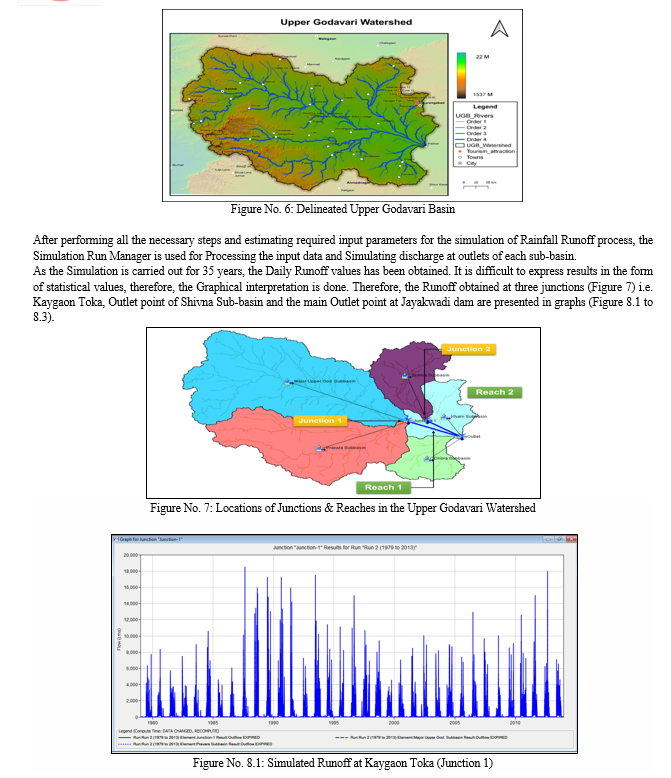
The location of study area in India / Maharashtra is presented in location map (Fig. No. 1). The delineated Upper Godavari Basin is spread across three districts of Maharashtra viz., Nashik, Aurangabad and Ahmednagar.
IV. DATABASE
In the present study, the simulation of Rainfall-Runoff process has been carried out. The factors such as topography, climate, landuse and landcover, soil and evapotranspiration aspects are considered for this study. The secondary data is collected from various legal sources. The collected data have been compiled, processed and summarized with the help of suitable statistical, computer and GIS techniques. The collected data with respective sources is presented in table (Table 1).
Table No. 1: Data types and Sources
|
Sr. No. |
Data Types |
Data Sources |
|
1 |
DEM (Digital Elevation Model) |
Shuttle Radar Topography Mission (SRTM) by NASA |
|
2 |
Landuse and Landcover |
Quick Open street map (Quick OSM) |
|
3 |
Soil |
India – Water Resources Information System (India-WRIS) |
|
4 |
Evapotranspiration |
India – Water Resources Information System (India-WRIS) |
|
5 |
Station wise Rainfall data (From 1 Jan 1979 to 30 Dec 2013) |
Global Weather data for SWAT (www.globalweather.tamu.edu) |
V. METHODOLOGY
In the present research, the latest version Q-GIS 3.18 is used for numerous purposes such as Maps preparation, Implementation of Theissen polygon method and Delineation of watershed and streams while HEC-HMS 4.7.1 is used to simulate the complete hydrologic processes of the present dendritic watershed system.
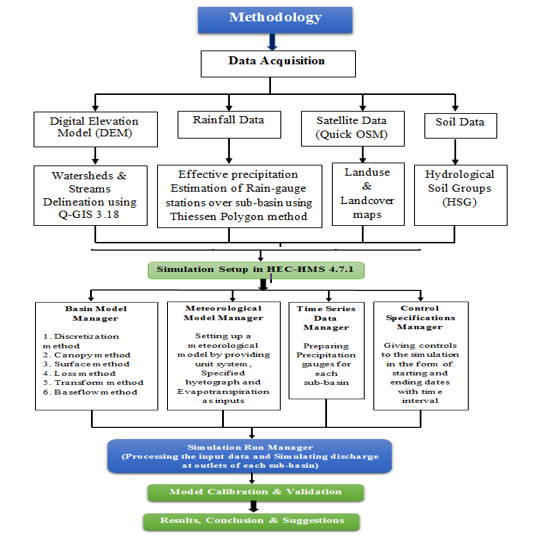
The methodology includes various Model applications, Statistical techniques, Computer techniques, GIS techniques, several tools used in delineation of watershed and streams and Components of HEC-HMS etc. The methodology followed for the present research is given in the flowchart (Figure 2). The statistical techniques such as Average, Weighted Values, Correlation Analysis and Theissen Polygon Method are used to estimate input parameters as well as computing results. In the present study, the database has a matrix of number of Geographical, Hydrological and Meteorological parameters. For such a large sized quantitative data computer techniques are essential to obtain mean, standard deviation, correlation etc. Computer techniques are also essential for representation of data with tables, graphs, maps and diagrams.
A significant development and growth is observed in Population, Urban & Industrial sector during late 20th century and in 21st century. Therefore, it would be interesting to understand the change in Precipitation distribution, Landuse pattern and Resulting runoff pattern during this time period. Therefore, the study period of 35 years is considered for the present study dated from 1 January 1979 to 30 December 2013.
A. Delineation of watershed using Q-GIS 3.18
In the present study, The Digital Elevation Model tiles (DEM) with 30 m resolution are downloaded from www.earthdata.nasa.gov using Shutter Radar Topography Mission (SRTM) plugin. Total six DEM tiles were required to cover the considered study area up to full extent. The un-necessary tiles covering other regions such as Arabian Sea etc., were removed. The steps followed in the delineation of the watershed is given in the flowchart (Figure No. 3).
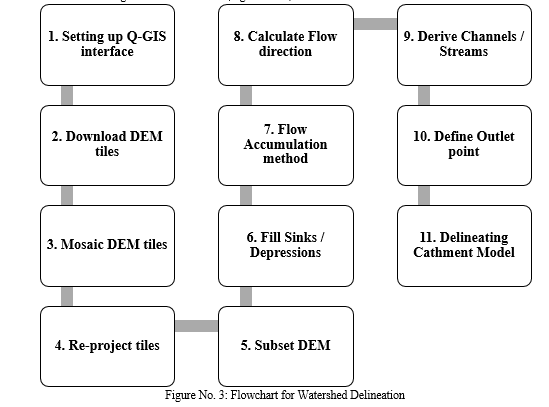
Various tools and plugins such as Build Virtual Raster, r.fill.dir tool, r.stream.extract, r.water.outlet etc. are used in the delineation process in Q-GIS 3.18. The outlet point is specified manually by selecting the outlet cell at Jayakwadi Dam for the Delineation of Upper Godavari Basin. The similar process is followed for the delineation of Sub-catchments.
B. Setting up basin model in HEC-HMS
The Hydrologic Modelling System is designed to simulate the precipitation-runoff processes of dendritic watershed systems. Total seven components are present in HEC-HMS to give all the necessary input data for simulation of Rainfall Runoff process. These components are Basin Model Manager, Meteorological Model Manager, Control Specifications Manager, Time-series Data Manager, Paired Data Manager, Grid Data Manager and Terrain Data Manager. Each component has its own purpose in the simulation process. These components are presented in flowchart of methodology (Figure 2).
C. Effective Rainfall estimation by Thiessen Polygon Method
The Daily Station-wise Rainfall data is collected from India – Water Resource Information System (India WRIS) and Indian Meteorological Department Grid. Total 35 Rain gauge stations lie in the extent of Upper Godavari Basin (UGB). There is a need to find the weight of each Rain gauge station. This weight is nothing but the ratio of Area contributed by Each Station to Whole area of Sub-basin. This weight is further multiplied by Rainfall data of respective station. At the end, all the values contributed by each station were added to get a daily Average Rainfall value for each sub-basin. The Thiessen/Voronoi Polygons around each Rain Gauge stations are presented in figure (Figure 4).

D. Structured Discretization Method
The discretization method defines how a sub-basin is discretized. Traditionally, the Mod Clark grid cell file has been used to define the spatially-discrete elements of a sub-basin. One limitation of the Mod Clark grid cell file is that it does not use absolute spatial references. Grid cell locations are referenced from an arbitrary lower left corner. Structured and Unstructured discretization provide spatial-awareness to spatially-discrete sub-basin elements. Advantages of the spatially-aware approach include the ability to view discrete elements, the ability to sample values from other geospatial data, and the ability to visualize results for discrete elements.
In the present study, the Structured Discretization method is used. Two inputs are required for this method. (Table 2)
Table No. 2: Input Parameters for Structured Discretization method
|
Sr. No. |
Sub-basin |
Input Parameters |
|
|
Projection |
Cell Size |
||
|
1 |
MUG |
UTM Zone 43 N |
20 |
|
2 |
Kham |
UTM Zone 43 N |
|
|
3 |
Dhora |
UTM Zone 43 N |
|
|
4 |
Pravara |
UTM Zone 43 N |
|
|
5 |
Shivna |
UTM Zone 43 N |
|
The Structured Discretization creates a Cartesian grid within the bounds of the sub-basin. The Structured Discretization gives options for Standard Hydrologic Grid (SHG) or Universal Transverse Mercator (UTM) projection and 50, 100, 200, 500, 1000, 2000, 5000, or 10000-meter grid cell sizes. The present study area lies in UTM Zone 43 N with projection of 20 m cell size.
E. Simple Surface Method
The depression storage of an impervious surface such as a parking lot is generally close to zero. However, the depression storage for an agricultural field can be quite large if conservation tillage practices are used. Precipitation through-fall from the canopy, or direct precipitation if there is no canopy, impacts on the surface. The net precipitation accumulates in the depression storage and infiltrates as the soil has capacity to accept water. Surface runoff will begin when the precipitation rate exceeds the infiltration rate, and the surface storage is filled. Precipitation residing in the surface storage can infiltrate after precipitation stops and is subject to potential evapo-transpiration.
In the present study, a Simple Surface method is selected. This method is a simple representation of the soil surface. All precipitation or precipitation through-fall that arrives on the soil surface is captured in storage until the storage capacity of the surface is filled. Water in surface storage infiltrates into the soil whenever it is present in storage.
That is, water will infiltrate even when the storage capacity is not full. Surface runoff will be generated when the storage capacity is filled, and the precipitation through-fall rate exceeds the infiltration rate.
Table No. 3: Standard Parameters for Simple Surface method
|
Sr. No. |
Surface Depression |
Slope (%) |
Maximum Surface Storage (mm) |
|
1 |
Paved Impervious Area |
NA |
3.2 – 6.4 |
|
2 |
Steep, Smooth Slopes |
> 30 |
1 |
|
3 |
Moderate to Gentle Slopes |
5 - 30 |
12.7 – 6.4 |
|
4 |
Flat, Furrowed Land |
0 - 5 |
50.8 |
(Source: According to T.H. Bennet et.al & M. Fleming et. al.)
The initial condition of the surface should be specified as the percentage of the surface storage that is full of water at the beginning of the simulation. In the present study it is assumed that before simulation, there is no surface storage. The maximum surface storage values depend upon the Surface Depression and Topographical slope (%). The standard values given by T.H. Bennet et.al & M. Fleming et. al. is given in table (Table 3).
Surface storage represents the maximum amount of water that can be held on the soil surface before surface runoff begins. The amount of storage is specified as an effective depth of water. The slope for each sub-basin has been computed using DEM tiles in Q-GIS 3.18 and four ranges were prepared and presented in table (Table 4).
Table No. 4: Estimated input Parameters for Simple Surface method
|
Sr. No. |
Sub-basin |
Input Parameters |
|
|
Initial Storage |
Weighted Maximum Storage (mm) |
||
|
1 |
MUG |
0 |
3 |
|
2 |
Kham |
0 |
3 |
|
3 |
Dhora |
0 |
1 |
|
4 |
Pravara |
0 |
1 |
|
5 |
Shivna |
0 |
3 |
F. SCS CN Loss Method
While a sub-basin element conceptually represents infiltration, surface runoff, and subsurface processes interacting together, the actual infiltration calculations are performed by a loss method contained within the sub-basin. A total of twelve different loss methods are provided. Some of the methods are designed primarily for simulating events while others are intended for continuous simulation.
All methods work on mass conservation. That is, the sum of infiltration and precipitation left on the surface will always be equal to total incoming precipitation. In the present study, Soil Conservation Service (SCS) Curve Number method is implemented.
The Soil Conservation Service (SCS) Curve number method implements the curve number methodology for incremental losses (NRCS, 2007). Originally, the methodology was intended to calculate total infiltration during a storm. The program computes incremental precipitation during a storm by recalculating the infiltration volume at the end of each time interval. Infiltration during each time interval is the difference in volume at the end of two adjacent time intervals.
The Soil Conservation Service (SCS) Curve number requires three input parameters. The Curve Number (CN) can be considered as the most important parameter of the present study. The remaining two parameters are Initial Abstraction (Ia) and Impervious area (%). Their definitions are given below;
a. Initial abstraction (Ia): defines the amount of precipitation that must fall before surface excess results.
b. Curve Number (CN): It is composite curve number that represents all of the different soil group and land use combinations in the sub-basin.
c. Impervious (%): The composite curve number should not include any impervious area that will be specified separately as the percentage of impervious area.
- Initial abstraction (Ia): It can be calculated by the formula given by HEC-HMS technical reference manual as below;

Where, Ai = Area for ith Landuse Type, CNi = Curve Number for ith Landuse Type
The area under each landuse type is estimated using Landuse Landcover maps. These maps are also prepared with the help of Q-GIS 3.18. The area under Water bodies (Reservoirs) and Roads is taken as Impervious area and % area is Calculated for each sub-basin. The last column in the following figures gives the weighted CN values. (Table No. 5.1 to 5.5). The estimated input parameters are presented in table (Table No. 6). In the similar way, CN for different years have been found out and taken as a input parameter while setting up the basin model in HEC-HMS.
Table No. 6: Input Parameters for SCS Curve Number Loss method
|
Sr. No. |
Sub-basin |
Input Parameters |
||
|
Initial Abstraction (mm) |
Weighted CN |
Impervious (%) |
||
|
1 |
MUG |
6.86 |
88 |
0.0010 |
|
2 |
Kham |
8.79 |
85 |
0.0140 |
|
3 |
Dhora |
6.91 |
88 |
0.0035 |
|
4 |
Pravara |
6.85 |
88 |
0.0117 |
|
5 |
Shivna |
8.97 |
85 |
0.0060 |
G. SCS Unit Hydrograph Transform Method
While a sub-basin element conceptually represents infiltration, surface runoff, and subsurface processes interacting together, the actual surface runoff calculations are performed by a transform method contained within the sub-basin. A total of nine different transform methods are provided. The choices include various unit hydrograph methods, a kinematic wave implementation, a linear quasi-distributed method, and a two-dimensional (2D) diffusion wave method.
The SCS Unit Hydrograph method is selected as transform method. The Soil Conservation Service (SCS) unit hydrograph method defines a curvilinear unit hydrograph by first setting the percentage of the unit runoff that occurs before the peak flow (NRCS, 2007). A triangular unit hydrograph can then be fit to the curvilinear unit hydrograph so that the total time base of the unit hydrograph can be calculated. The standard unit hydrograph is defined with 37.5% of unit runoff occurring before the peak flow. This definition corresponds to a peak rate factor of 484 which incorporates the percentage of unit runoff before the peak, calculated total time base, and unit conversions when applying the equations within the US Customary unit system.
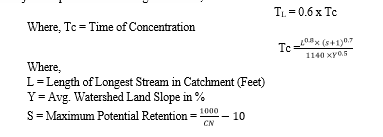
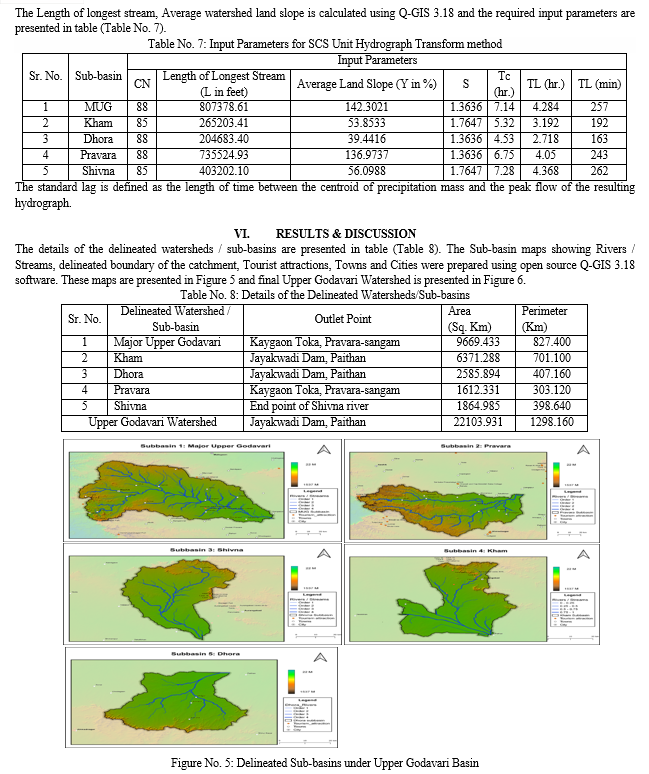
The SCS CN method requires two inputs, the one is Graph type and another is Lag time (TL). The default Graph type standard PRF 484 is used. The Lag time is calculated using empirical equation given by HEC-HMS Technical Reference manual and other reputed journal publications. It is given below;

Conclusion
It is concluded that, “The Hydrologic Engineering Centres Hydrologic Modelling System (HEC-HMS) watershed model can be effectively used to simulate Rainfall Runoff process to estimate basin’s hydrological phenomenon caused due to precipitation.” “The increase in Urbanization & change in Landuse pattern in the Upper Godavari watershed have definitely increased the peak runoff significantly especially in Kham sub-basin.”
References
[1] Jan Sitterson et. al. (2017): “An Overview of Rainfall Runoff model types”, A report by EPA United States Environmental Protection Agency, Washington DC, EPA/600/R-14/152, Pg:3 [2] United States Geological Survey (USGS): Created by an act of Congress in 1879, the U.S. Geological Survey has evolved over the decades, matching its talent and knowledge to the progress of science and technology, (www.usgs.gov) [3] Visweshwaran R. (2017): “Application of the HEC-HMS model for runoff simulation in the Krishna basin”, A project submitted to Department of applied mechanics & Hydraulics, National institute of technology, Karnataka, Surathkal – 575025, Pp: 1 to 17 [4] Shuttle Radar Topography Mission (SRTM) by NASA [5] Quick Open street map (Quick OSM); A plugin by Q-GIS [6] India – Water Resources Information System (India-WRIS) [7] Global Weather data for SWAT (www.globalweather.tamu.edu) [8] HEC-HMS User manual [9] HEC-HMS Technical Reference manual [10] Sintayehu Legesse Gebre (2015): A research article on “Application of the HEC-HMS Model for Runoff Simulation of Upper Blue Nile River Basin”, submitted to Hydrology: Current Research journal, ISSN:2157-7587 HYCR, an open access, Volume 6, Issue 2, 1000199. [11] Makkena jyothi et al. (2017): A research article on “Modelling the Hydrology of Watershed by using HEC-HMS”, submitted to International Journal of Engineering Science and Computing, ISSN 2321 3361 © 2017 IJESC, Volume 7, Issue 6, http://ijesc.org/ , Pp: 13129 to 13132 [12] Praveen Rathod et al. (2015): A research paper on “Simulation of Rainfall - Runoff Process Using HEC-HMS (Case Study: Tapi River, India)”, presented in HYDRO 2015 INTERNATIONAL 20th International Conference on Hydraulics, Water Resources and River Engineering, IIT Roorkee, India, 17-19 December, 2015. [13] Ram chandra paudel et al. (2019): A research paper on “Application of HEC-HMS Model for Runoff Simulation: A Case Study of Marshyangdi River Basin in Nepal”, presented in Peer Reviewed Proceedings of IOE Graduate Conference, 2019-Winter, ISSN: 2350-8914 (Online), 2350-8906 (Print), Volume 7, Pp: 127 to 140
Copyright
Copyright © 2023 Dr. Dattatray K. Rajmane, Mr. Shubham D. Ghungarde, Mr. Satyam B. Daule, Mr. Devidas G. Darandale, Mr. Dnyaneshwar D. Kashid. This is an open access article distributed under the Creative Commons Attribution License, which permits unrestricted use, distribution, and reproduction in any medium, provided the original work is properly cited.

Download Paper
Paper Id : IJRASET54899
Publish Date : 2023-07-21
ISSN : 2321-9653
Publisher Name : IJRASET
DOI Link : Click Here
 Submit Paper Online

