Ijraset Journal For Research in Applied Science and Engineering Technology
- Home / Ijraset
- On This Page
- Abstract
- Introduction
- Conclusion
- References
- Copyright
Statistical Analysis and Optimization of a Single-Effect Vapor Absorption Refrigeration Cycle
Authors: Kapil Jain, Basant Kumar Chourasia
DOI Link: https://doi.org/10.22214/ijraset.2024.58129
Certificate: View Certificate
Abstract
This study employs Response Surface Methodology (RSM) with a Box-Behnken design to optimize the Coefficient of Performance (COP) in a Single-Effect Vapor Absorption System. The thermodynamic model considers a 1-ton refrigeration (TR) system utilizing Lithium bromide-water as the refrigerant, and simulations are conducted using the Engineering Equation Solver (EES). The optimization process identifies optimal values for the generator, absorber, condenser, and evaporator temperatures, set at 90°C, 33°C, 33°C, and -5°C, respectively, resulting in an achieved optimum COP of 0.716. Statistical analysis through ANOVA of the quadratic regression model reveals a significant F-value of 110.62, with a low probability value (p=0.0003), attesting to the model\'s robustness. Key statistical metrics for the model encompass a standard deviation (Std. Dev.) of 0.0059, a mean of 0.8956, a coefficient of variation (C.V. %) of 0.6559, an R² of 0.9901, an adjusted R² of 0.9811, a predicted R² of 0.9159, and an adequate precision of 38.2967. This research offers crucial insights into enhancing the performance of a Single-Effect Vapor Absorption System, thereby contributing to the advancement of energy-efficient refrigeration technologies.
Introduction
I. INTRODUCTION
The depletion of fossil fuels, such as coal, oil, and natural gas, as well as the growing harm these fuels cause, make renewable energy sources more and more necessary. As a result, the adoption of absorption refrigeration systems (ARSs) in lieu of vapor compression refrigeration systems has gained traction in recent years. The following are the main benefits of ARSs: Depending on the working fluid pairs employed in the system, they don't harm the ozone layer and can take advantage of a number of sustainable energy sources such as solar energy (Wang et al. [1]) or geothermal energy (Salhi et al. [2]). Marashli et al. [3] created a model for a solar-powered cooling system using Lithium Bromide-Water. Using MATLAB/Simulink, they found the best operating temperatures to avoid crystallization and investigated improving the heat exchanger solution. The system had a cooling capacity of 120 kW and used 243.3 m2 evacuated tube solar collectors. The generator's temperature was found to be the critical factor for optimal performance, achieving a COP of 0.74 at 110 °C.
Özak?n and Kaya [4] conducted an experimental and thermodynamical analysis to study the effects of mass flow rate, temperature, and material type on the thermal and exergy efficiency of an air-based PVT system. They used Taguchi and ANOVA methods to analyze the data. The study found that fin material, airflow rate, and panel temperature were the most effective control parameters on both thermal and exergy efficiencies. The researchers also determined the optimum combinations of control parameters for both frequent and sparse configurations of all fin materials. Based on the ANOVA results, fin material had a very dominant effect on both thermal and exergy efficiency, while fan speed had a relative effect, and the panel surface temperature had no effect.
Huirem and Sahoo [5] analyzed a 17.5 KW LiBr-H2O solar-assisted vapor absorption refrigeration system using the Box Behnken Design technique. They studied the impact of generator temperature, LiBr solution concentration, evaporator temperature, and heat exchanger effectiveness on COP, ECOP and TED. Optimal conditions include a 32°C absorber temperature, weak solution concentration of 55.5%, and strong solution concentration of 60%. Increasing heat exchanger effectiveness from 0.5 to 0.9 resulted in a 17.44% increase in COP and ECOP. The model identifies optimum parameters with a COP of 0.79, ECOP of 0.448, and TED of 0.821 kW under specific operational conditions.
S. Agarwal, Arora, and Arora [6] analyzed an absorption-compression cascade refrigeration system (ACCRS) for low-temperature applications. They used an EES software-based model to calculate the system's performance for different temperatures. The triple-effect cascade system saved 45.84% more electricity than the conventional VCR cycle. The COP and exergetic-efficiency of the VCR circuit in the cascade system increased by 85.26% and 85.28%, respectively. The system circulation pump and absorber had the lowest and highest irreversibility.
Azhar and Siddiqui [7] analyzed double-effect parallel flow direct and indirect fired vapor absorption refrigeration systems. They optimized temperatures and solution distribution ratio, comparing parallel and series flow configurations. The study found that the parallel flow cycle had 3-6% higher ECOP and 4% lower EDR than the series flow cycle. The optimum intermediate generator temperature for the parallel flow cycle was significantly lower than the series flow cycle, while the main generator temperature was higher.
In a study by Pandya et al. [8] compared double-effect solar-assisted systems using LiBr-H2O and LiCl-H2O pairs with ETC and PTC. The study aimed to optimize Tcutoff and collector type based on Solar COP, Solar exergy efficiency, Acollector , and product cost. ANOVA revealed the high-temperature condenser's significant impact. LiCl-H2O outperformed LiBr-H2O in all scenarios. Higher condensation temperatures increased costs and reduced performance. Thermodynamically, LiCl-H2O with PTC excelled, though ETC had a 27% smaller collector area. Despite PTC's higher initial cost, economic analysis showed a 17% higher cost for LiCl-H2O. However, PTC-based LiCl-H2O showed superior Solar COP and efficiency, favoring its integration despite the higher initial product cost.
Talpada and Ramana [9] conducted a review of various studies that focused on modifying absorption systems to improve the performance of absorption refrigeration systems. The study suggests that the performance of absorption refrigeration can be enhanced by using a double-effect and semi-generator absorber solution heat exchanger arrangement. The coefficient of performance of absorption refrigeration can also be improved by combining different refrigeration cycles, such as compression-absorption and ejector-absorption, to form a hybrid refrigeration cycle.
Iffa et al. [10] conducted an exergetic analysis of absorption refrigeration systems using the Design of Experiment approach. They used a Carré Hyper Greco-Latin plan consisting of 16 experiments with the MAPLE computer tool to optimize the coefficient of performance (COP) of the system. The study outcomes suggest that the refrigerating machine with a compressor between the evaporator and the absorber has an acceptable COP. It can operate at a low generator temperature of approximately 60°C while using NH3/LiNO3 as a refrigerant.
Using the Taguchi method, Sivasakthivel et al. [11] optimized a Ground Source Heat Pump’s operational parameter. They varied the temperature parameters in three levels and used the "higher the better" concept to obtain a higher coefficient of performance (COP). With a computer program in FORTRAN, they performed computations and analyzed the results using the Signal-to-Noise ratio and Analysis of Variance method. They obtained the maximum COP for heating and cooling operations as 4.25 and 3.32, respectively.
In a study by, M. ?. Karamangil et al. [12] conducted a thorough analysis of absorption refrigeration systems (ARSs) and working fluids. They found that COP values increase with generator and evaporator temperatures, but decrease with condenser and absorber temperatures, as expected. The H2O-LiBr mixture system has higher COP values, but has a limited operating range due to crystallization. In contrast, the NH3-LiNO3 solution is more advantageous at low generator temperatures. The study compared the performance of different types of heat exchangers and found that the SHE significantly outperforms the RHE and SRHE, with a maximum increase of 66% in COP.
Prashant et al. [13] employed Taguchi, Grey Relation Analysis, and ANOVA techniques to optimize a Vapor Absorption Refrigeration System (VARS) that utilizes nanoparticles. Their study revealed that incorporating copper-oxide nanoparticles into a VARS system with LiBr-H2O as the refrigerant resulted in a 17% increase in the Coefficient of Performance (COP). Among the system parameters, absorber temperature had the most significant impact on performance, followed by evaporator temperature.
Darwish, Al-Hashimi, and Almansoori [14] used Aspen Plus to analyze a Robur ARWA chiller. Aspen Plus provided a flexible platform for analyzing power cycles. The predicted results matched experimental and manufacturer data. The study analyzed performance parameters, including COP, heat duties, refrigerant concentration, and flow rates. The separator heat duty, representing waste heat, affected COP by a maximum of 1.8%. Separator efficiency is key; increasing the number of theoretical stages improved COP by up to 15%. Introducing a throttling process and using stripping gas improved COP by up to 20%.
Jadidi et al. [15] conducted a study to evaluate the performance of a 3.5 kW Solar Ejector Cooling System (SECS) in two office buildings located in different climates using two types of refrigerants, R600a and R290 hydrocarbon. The study involved the development of a mathematical model of the ejector, which is a constant area mixing type, using EES software and the ε-NTU method, and a simulation program on TRNSYS-EES co-simulator for dynamic study of the cooling cycle. The researchers assessed the thermodynamic energy and exergy of the cooling systems and found that the solar collector system and the ejector component in the cooling cycle were the primary exergy destruction processes. The study also found that R290 (COP = 0.2844) was more efficient in increasing the overall COP of the system than R600a (COP = 0.2797) for the office building located in the semi-arid region.
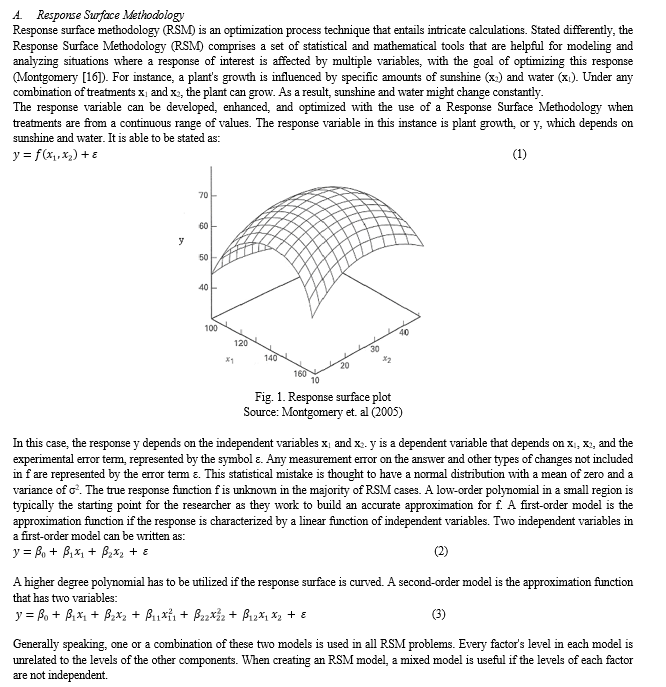
Using statistical techniques such as DOE, RSM, and ANOVA, this paper aims to establish the foundational context for the ARS. This is because the thermodynamical approach has the limitation of maintaining the other parameter constant when the process involves two or more parameters and the parameter's effect is changed. To determine how operational parameters impact the system's performance characteristics, fewer tests are needed thanks in large part to the statistical technique.


B. Assumptions for Thermodynamic Analysis
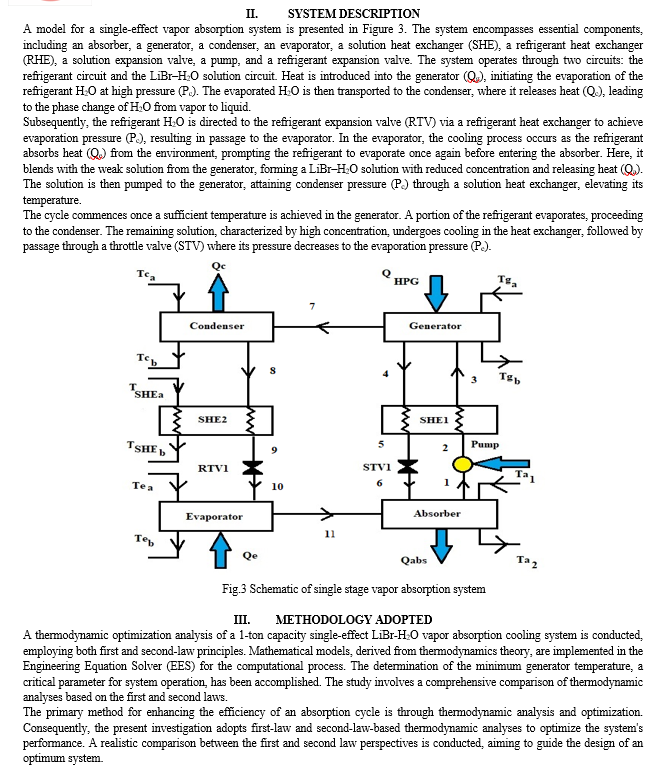
For this part we established a thermodynamic analysis of the single-effect machine with a heat exchanger operating with the pair (H2O/LiBr).
We adopt the following assumptions.
- There is saturated refrigerant at the condenser and evaporator outlets.
- There is no departure of chemical substances from the cycle to the environment.
- The kinetic and potential energy effects are neglected.
- The refrigerant (water) at the outlet of the condenser is saturated liquid and vapour.
- The Lithium bromide solution at the absorber outlet is a strong solution and it is at the absorber temperature.
- The outlet temperatures from the absorber and from generators correspond to equilibrium conditions of the mixing and separation respectively.
- Pressure losses in the pipelines and all heat exchangers are negligible.
- Heat exchange between the system and surroundings, other than in that prescribed by heat transfer at the generator, evaporator, condenser and absorber, does not occur.
C. Parameters and Levels
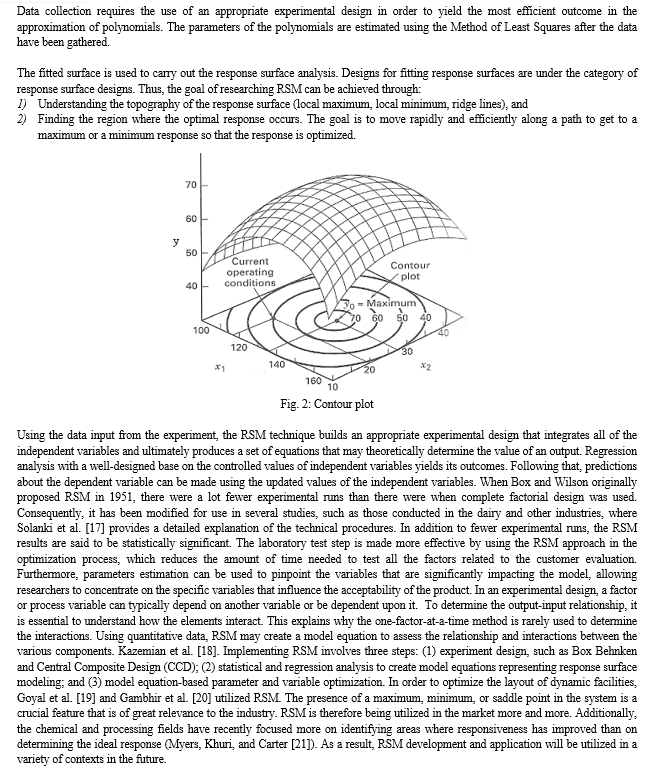
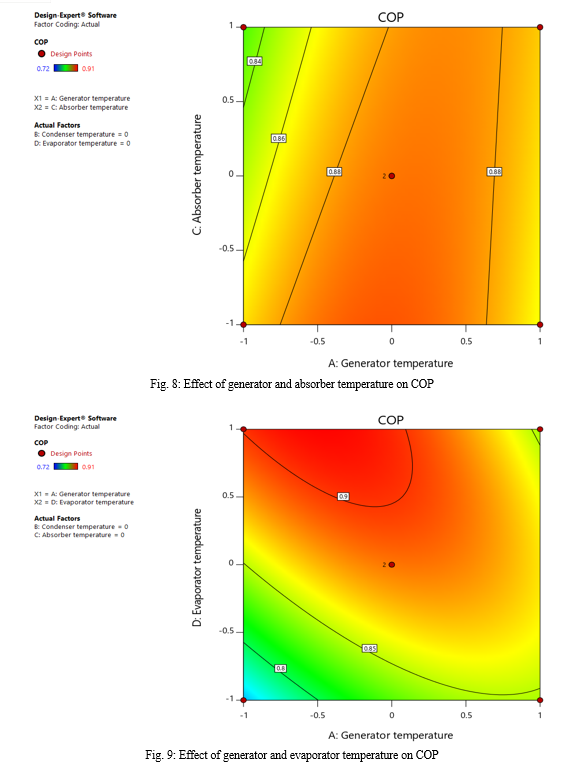
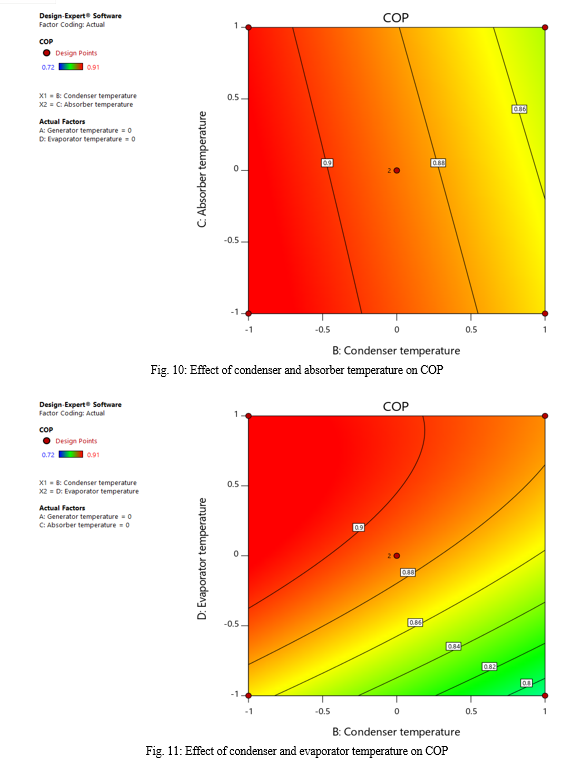
Four factors, including generator, evaporator, condenser, and absorber temperatures, are taken into account in this study to optimize the absorption refrigeration system. The literature review is used to determine the parameter levels, as Table 1 illustrates. By utilizing Box-Behnken design, the RSM technique maximizes system performance. A great deal of phenomena in engineering are based on hypotheses, and as a result, some of them are too complex to adequately capture mathematically, either because of unidentified mechanisms, a high number of governing factors, or both. In the design of experiments and engineering related sciences, response surface methodology (RSM) is one of the exploration methodologies.
It is a collection of statistical and mathematical techniques that are useful for modeling and analyzing issues where multiple variables influence the response parameter and are optimized. Using an appropriate test design, this technique looks for a way to estimate interactions, quadratic effects, and even the localized surface of the response. Following EES's numerical simulation of the single-stage LiBr-water absorption system in computer code and verification of the results' accuracy, the right mathematical model must be chosen in order to examine the significance of each desired parameter. A collection of sophisticated design of experiments (DOE) methods called response surface methodology aids in the improved comprehension and optimization of response.
One advantage of the Box-Behnken design is that it assumes fewer runs for three components. This benefit vanishes for four or more components. Although the Box-Behnken design can be rotated, some regions, like CCI, have low prediction quality. The experimenter may be prevented from overdoing the combination of elements by its "missing corners." The selection of the parameters and their design ranges is the next step. The parameter ranges (taken from Canbolat [22]) for the COP analysis are displayed in Table 1.
Table 1: Ranges of parameters for the analysis on the COP
|
Parameters |
Levels |
||
|
-1 |
0 |
1 |
|
|
Generator temperature, Tg |
90 |
110 |
130 |
|
Condenser temperature, Tc |
28 |
33 |
38 |
|
Absorber temperature, Ta |
28 |
33 |
38 |
|
Evaporator temperature, Te |
-5 |
2.5 |
10 |
D. COP Estimation
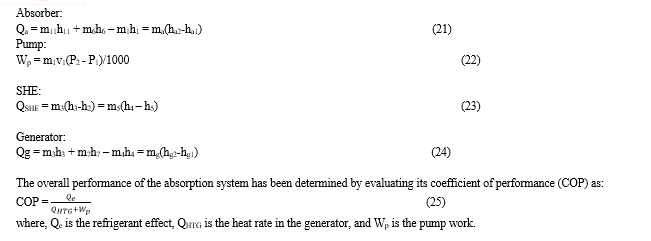
According to equations (4) to (25), a computational computer code was written in EES based on input parameters introduced in Table 2 to study the coefficient of performance of the cycle.
Table 2: COP results
|
Run |
Tg |
Tc |
Ta |
Te |
COP |
|
1 |
130 |
38 |
33 |
2.5 |
0.85 |
|
2 |
90 |
28 |
33 |
2.5 |
0.91 |
|
3 |
110 |
38 |
28 |
2.5 |
0.86 |
|
4 |
90 |
33 |
33 |
10 |
0.90 |
|
5 |
110 |
33 |
28 |
-5 |
0.863 |
|
6 |
90 |
33 |
28 |
2.5 |
0.883 |
|
7 |
90 |
38 |
33 |
2.5 |
0.799 |
|
8 |
110 |
33 |
38 |
-5 |
0.817 |
|
9 |
110 |
33 |
38 |
10 |
0.904 |
|
10 |
90 |
33 |
33 |
-5 |
0.72 |
|
11 |
130 |
33 |
33 |
-5 |
0.838 |
|
12 |
90 |
33 |
38 |
2.5 |
0.833 |
|
13 |
130 |
33 |
28 |
2.5 |
0.863 |
|
14 |
110 |
28 |
28 |
2.5 |
0.902 |
|
15 |
130 |
33 |
38 |
2.5 |
0.863 |
|
16 |
110 |
38 |
33 |
-5 |
0.802 |
|
17 |
110 |
28 |
33 |
10 |
0.909 |
|
18 |
110 |
28 |
38 |
2.5 |
0.905 |
|
19 |
110 |
33 |
28 |
10 |
0.887 |
|
20 |
130 |
33 |
33 |
10 |
0.870 |
|
21 |
110 |
28 |
33 |
-5 |
0.875 |
|
22 |
110 |
33 |
33 |
2.5 |
0.888 |
|
23 |
110 |
33 |
33 |
2.5 |
0.888 |
|
24 |
130 |
28 |
33 |
2.5 |
0.870 |
|
25 |
110 |
38 |
38 |
2.5 |
0.853 |
|
26 |
110 |
38 |
33 |
10 |
0.881 |
V. RESULTS AND DISCUSSION
A. Results Validation
EES code validation has been done by comparing the results of the current simulation with those of Ketfi et al. [23], Kaushik et al. [24], and Modi et al. [25] before moving on to statistical analysis. Table 3 presents a comparison of the results of the simulation. In comparison to Ketfi et al. [23], the COP divergence is -2.83%.
Comparing the current simulation results with those of Modi et al. [25] and Kaushik et al. [24], we find that the variation in COP is +6.63% and +6.71%, respectively. The irreversibility distribution among each component of the absorption process accounts for the diversity in findings. Furthermore, the simulation works satisfactorily with the existing single-impact vapor absorption system.
Table 3: Comparison of validation results of COP with the published literature
|
Sr. No. |
Published literature |
Tg (oC) |
Tc (oC) |
Ta (oC) |
Te (oC) |
COP |
COP Estimated using EES code |
Deviation |
|
1 |
Ketfi et al. [23] |
90 |
40 |
40 |
7 |
0.775 |
0.753 |
-2.83% |
|
2 |
Modi et al. [25] |
87.8 |
37.8 |
37.8 |
7.2 |
0.7615 |
0.812 |
6.63% |
|
3 |
Kaushik et al. [24] |
87.8 |
37.8 |
37.8 |
7.2 |
0.7609 |
0.812 |
6.71% |
B. ANOVA Results and Regression Model
Determination coefficient R2, adjusted R2, predicted R2, and coefficient of variation (CV%) were determined to check the adequacy and accuracy of the developed models. The R2 indicates the proportion of the total variation in the response predicted by the models. The higher correlation coefficients confirm the suitability of the models and correctness of the calculated constants.
Table 4: ANOVA table and statistical parameters of quadratic model
|
Source |
Sum of Squares |
df |
Mean Square |
F-value |
p-value |
|
|
Model |
0.0344 |
9 |
0.0038 |
110.62 |
< 0.0001 |
Significant |
|
A-Tg |
0.0080 |
1 |
0.0080 |
230.55 |
< 0.0001 |
|
|
B-Tc |
0.0053 |
1 |
0.0053 |
154.22 |
< 0.0001 |
|
|
C-Te |
0.0161 |
1 |
0.0161 |
465.64 |
< 0.0001 |
|
|
AB |
0.0005 |
1 |
0.0005 |
15.73 |
0.0027 |
|
|
AC |
0.0016 |
1 |
0.0016 |
47.17 |
< 0.0001 |
|
|
BC |
0.0008 |
1 |
0.0008 |
22.33 |
0.0008 |
|
|
A² |
0.0008 |
1 |
0.0008 |
22.87 |
0.0007 |
|
|
B² |
0.0001 |
1 |
0.0001 |
1.62 |
0.2313 |
|
|
C² |
0.0015 |
1 |
0.0015 |
42.64 |
< 0.0001 |
|
|
Residual |
0.0003 |
10 |
0.0000 |
|||
|
Lack of Fit |
0.0003 |
5 |
0.0001 |
|||
|
Pure Error |
0.0000 |
5 |
0.0000 |
|||
|
Cor Total |
0.0347 |
19 |
The Model F-value of 110.62 implies the model is significant. There is only a 0.03% chance that an F-value this large could occur due to noise. P-values less than 0.05 indicate model terms are significant. In this case A, B, C, AB, AC, BC, A², C² are significant model terms. The ANOVA of the quadratic regression model demonstrates that the model was highly significant. This was evident from the Fisher’s F-Test (F value=110.62) and a low probability value (p=0.0003). The CV% obtained is 0.65 for the response. The low value of CV% indicates the degree of precision with which the simulation is carried out. A low value of CV% suggests a high reliability of the experiment. Adequate precision value measures the signal-to-noise ratio, and a ratio greater than 4 is generally desirable which indicates adequate model discrimination. The adequate precision value obtained in this study is 12.13 which indicated adequate signal.
Table 5: Statistical data of quadratic model
|
Std. Dev. |
0.0059 |
R² |
0.9901 |
|
Mean |
0.8956 |
Adjusted R² |
0.9811 |
|
C.V. % |
0.6559 |
Predicted R² |
0.9159 |
|
+ |
|
|
|
|
Adeq. Precision |
38.2967 |
The empirical relationship between the simulation results obtained is expressed by a second-order polynomial equation and the equation arrived for coded factors is given by the eqn (26).
COP = 0.908858305582 + 0.024133930102172 A – 0.019738899025539 B + 0.03429826036581 C + 0.0082374999999999 AB – 0.0142625 AC + 0.0098125 BC – 0.0073990929138372 A2 – 0.0019720483682305 B2 – 0.010103776351876 C2 (26)
C. Comparison Between Predicted and Simulation Values
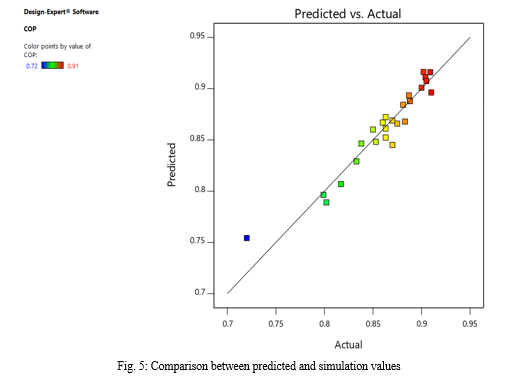
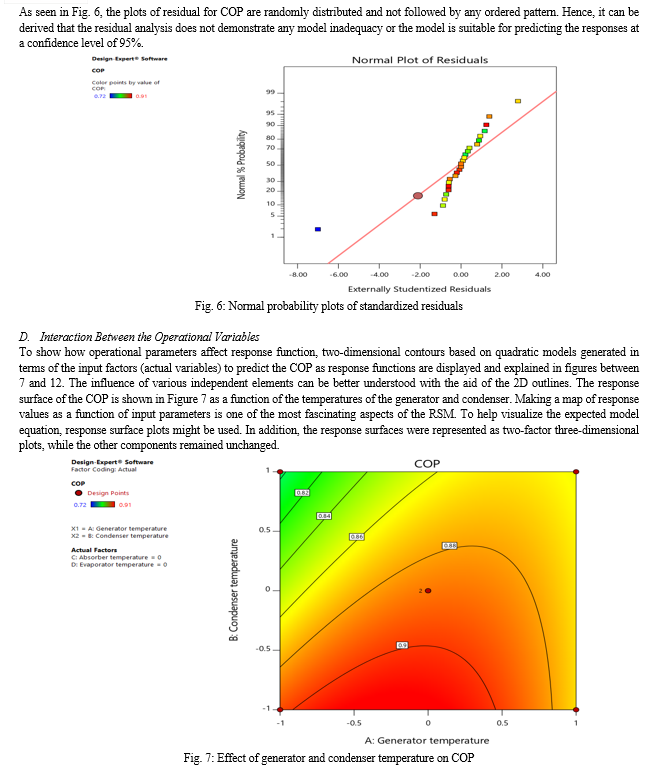
To determine whether the fitted model was a sufficient approximation to the actual values, the model's conformation was performed. The optimization of the fitted response surface is likely to produce poor or misleading results unless the model demonstrates a reasonable match. The diagnostic charts, which show predicted values against simulation results, were used to verify the model's satisfactoriness. The relationship between the experimental and anticipated values was also displayed in the charts. Fig. 5 displays the response's diagnostic plots. There was sufficient agreement between the actual data and the data derived from the models, as seen by the data points on this plot that reasonably approached the straight line. The normality of the residuals was checked by analyzing the data. The normal probability plot shown in Fig. 6 depicts the normal distribution of the residuals. The residuals provide the difference between the observed value of a response and the value that is fitted under the theoretical model. The small residual value indicates that the model prediction is accurate. The data points lie reasonably close to straight line in Fig.5. Some scatter was also found with normal data and it could be concluded that the data are normally distributed.

VI. FUTURE SCOPE OF WORK
Considering the comprehensive analysis conducted in the current study, the following future scope of work is proposed:
- Integration of Advanced Materials: Investigate the impact of incorporating advanced materials in the components of the LiBr-water absorption refrigerant system. This could include exploring materials with enhanced thermal conductivity, corrosion resistance, and durability to improve overall system efficiency.
- Dynamic Simulation Studies: Extend the scope by incorporating dynamic simulation studies to capture transient behaviors and responses of the system under varying operating conditions. Dynamic modeling can provide insights into the system's performance during start-up, shut-down, and transient states.
- Environmental Impact Assessment: Evaluate the environmental impact of the LiBr-water absorption refrigerant system. Assess the system's carbon footprint, energy consumption, and potential for utilizing eco-friendly refrigerants, contributing to sustainable and environmentally responsible cooling solutions.
- Integration of Renewable Energy: Explore the integration of renewable energy sources, such as solar or waste heat recovery, to power or enhance the LiBr-water absorption refrigerant system. Investigate the feasibility and efficiency of coupling the system with renewable energy technologies for sustainable operation.
- Optimization under Varying Operating Conditions: Extend the optimization studies to encompass a wider range of operating conditions, including variations in ambient temperature, humidity, and cooling load. This will provide a more comprehensive understanding of the system's performance across diverse scenarios.
- Multi-Objective Optimization: Undertake multi-objective optimization studies to concurrently optimize multiple responses, such as COP, environmental impact, and system cost. This holistic approach can lead to more balanced and sustainable system designs.
- Machine Learning Applications: Explore the application of machine learning techniques for predicting and optimizing the system's performance. Machine learning algorithms can analyze complex relationships within the system and offer insights for further improvements.
- Economic Feasibility Analysis: Conduct an economic feasibility analysis to assess the cost-effectiveness of implementing the optimized LiBr-water absorption refrigerant system. Consider factors such as initial investment, operational costs, and potential return on investment.
- Scale-Up Studies: Investigate the scalability of the optimized system for larger applications and explore the potential for commercialization. Scaling up the system would involve addressing challenges related to system dynamics, materials, and overall efficiency at an industrial scale.

Conclusion
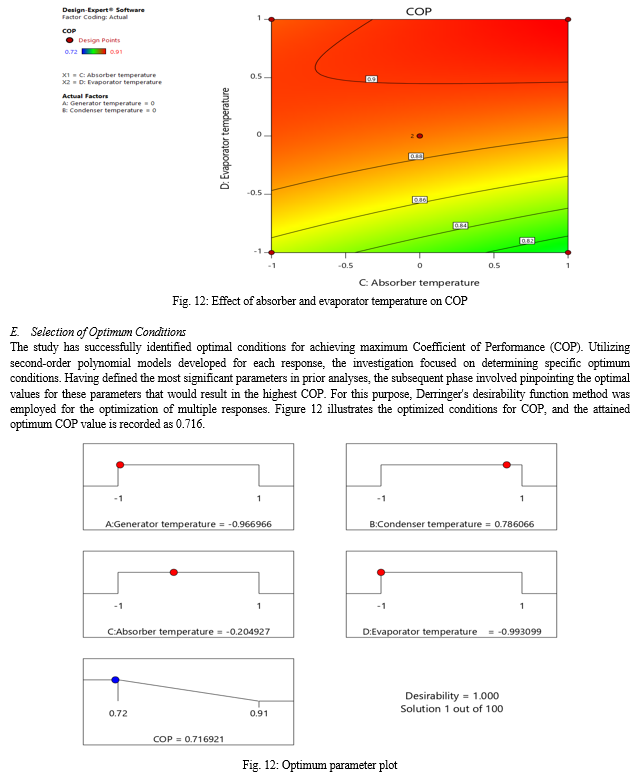
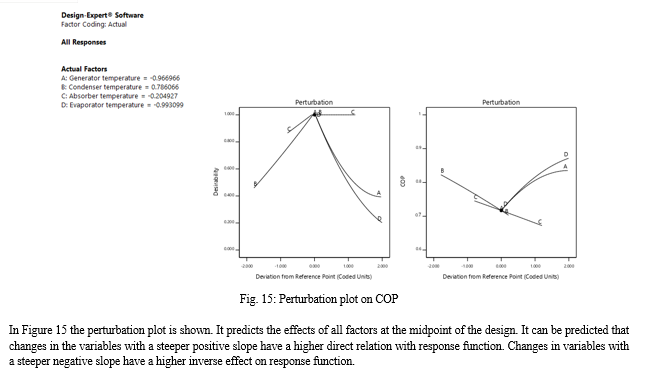
In the current study, Response Surface Methodology (RSM) designs, such as Box-Behnken Design (BBD), are employed for fitting quadratic equations and subsequently compared. Specifically, the BBD method within RSM is applied to investigate the influential parameters in the LiBr-water absorption refrigerant system. The simulation code for the LiBr-water absorption refrigerant system is explored in Engineering Equation Solver (EES), considering variations in maximum/minimum pressure, solution concentration, pure ammonia content, isentropic efficiency of the pump, mass flow rate, and effectiveness factor of the heat exchanger. An analysis of variance (ANOVA) is conducted to assess the impact of various factors on the coefficient of performance. The ANOVA results for the quadratic regression model indicate its high significance, substantiated by the Fisher’s F-Test (F value=9.77) and a low probability value (p=0.0003). The Coefficient of Variation (CV%) is found to be 2.04 for the response variable, signifying a high precision in the simulations. A low CV% suggests reliable experimentation. The Adequate Precision value, measuring the signal-to-noise ratio, is 12.13, exceeding the desirable ratio of 4, indicating sufficient model discrimination. Comparisons with the work by Canbolat et al [22] involving Taguchi and ANOVA methods reveal the determined importance order of parameters. Under operating conditions, the best Coefficient of Performance (COP) calculated in our study using the RSM technique is 0.716, surpassing the value obtained through Taguchi-Grey Relational Analysis (GRA) in Canbolat\'s study, which was 0.6255. Furthermore, the study highlights the impact of generator and evaporator temperature increase on COP enhancement, while an increase in condenser and absorber temperature results in COP reduction. Optimization using Derringer’s desirability function method yields an optimum COP value of 0.716.
References
[1] Wang, Rui, Z. Z. Xu, Q.W. Pan, S. X. Du, and Zefeng Xia. 2016. “Solar Driven Air Conditioning and Refrigeration Systems Corresponding to Various Heating Source Temperatures.” Applied Energy 169: 846–56. https://doi.org/10.1016/j.apenergy.2016.02.049. [2] Salhi, K., Mourad Korichi, and Khaled Mohamed Ramadan. 2018. “Thermodynamic and Thermo-Economic Analysis of Compression–Absorption Cascade Refrigeration System Using Low-GWP HFO Refrigerant Powered by Geothermal Energy.” International Journal of Refrigeration-Revue Internationale Du Froid 94: 214–29. https://doi.org/10.1016/j.ijrefrig.2018.03.017. [3] Marashli, Abdullah, Enas Alfanatseh, Mohammad Shalby, and Mohamed R. Gomaa. 2022. “Modelling Single-Effect of Lithium Bromide-Water (LiBr–H2O) Driven by an Evacuated Solar Tube Collector in Ma’an City (Jordan) Case Study.” Case Studies in Thermal Engineering 37: 102239. https://doi.org/10.1016/j.csite.2022.102239. [4] Özak?n, Ahmet Numan, and Ferhat Kaya. 2020. “Experimental Thermodynamic Analysis of Air-Based PVT System Using Fins in Different Materials: Optimization of Control Parameters by Taguchi Method and ANOVA.” Solar Energy 197: 199–211. https://doi.org/10.1016/j.solener.2019.12.077. [5] Huirem, Boris, and P.K. Sahoo. 2020. “Thermodynamic Modeling and Performance Optimization of a Solar-Assisted Vapor Absorption Refrigeration System (SAVARS).” International Journal of Air-Conditioning and Refrigeration 28 (01): 2050006. https://doi.org/10.1142/s2010132520500066. [6] Agarwal, Shyam, Akhilesh Arora, and B.B. Arora. 2020. “Energy and Exergy Analysis of Vapor Compression–Triple Effect Absorption Cascade Refrigeration System.” Engineering Science and Technology, an International Journal 23 (3): 625–41. https://doi.org/10.1016/j.jestch.2019.08.001. [7] Azhar, Md., and M. Altamush Siddiqui. 2020. “Comprehensive Exergy Analysis and Optimization of Operating Parameters for Double Effect Parallel Flow Absorption Refrigeration Cycle.” Thermal Science and Engineering Progress 16: 100464. https://doi.org/10.1016/j.tsep.2019.100464. [8] Pandya, Bhargav, Nishant Modi, Ravi Upadhyai, and Jatin Patel. 2019. “Thermodynamic Performance and Comparison of Solar Assisted Double Effect Absorption Cooling System with LiCl-H2O and LiBr-H2O Working Fluid.” Building Simulation 12 (6): 1063–75. https://doi.org/10.1007/s12273-019-0535-3. [9] Talpada, Jagdish S., and P.V. Ramana. 2018. “A Review on Performance Improvement of an Absorption Refrigeration System by Modification of Basic Cycle.” International Journal of Ambient Energy 40 (6): 661–73. https://doi.org/10.1080/01430750.2017.1423379. [10] Iffa, Ridha Ben, Nahla Bouaziz, and Lakdar Kairouani. 2017. “Optimization of Absorption Refrigeration Systems by Design of Experiments Method.” Energy Procedia 139: 280–87. https://doi.org/10.1016/j.egypro.2017.11.209. [11] Sivasakthivel, T., K. Murugesan, and Hywel Rhys Thomas. 2014. “Optimization of Operating Parameters of Ground Source Heat Pump System for Space Heating and Cooling by Taguchi Method and Utility Concept.” Applied Energy 116: 76–85. https://doi.org/10.1016/j.apenergy.2013.10.065 . [12] Karamangil, M. I., Salih Coskun, Omer Kaynakli, and Nurettin Yamankaradeniz. 2010. “A Simulation Study of Performance Evaluation of Single-Stage Absorption Refrigeration System Using Conventional Working Fluids and Alternatives.” Renewable and Sustainable Energy Reviews 14 (7): 1969–78. https://doi.org/10.1016/j.rser.2010.04.008. [13] Patil, Prashant, Nitin Kardekar, and Dhanapal Kamble. 2023. “Performance Analysis and Optimization of Nano Particle Base Libr-H2o Vapor Absorption System by Using Taguchi, Grey Relational Analysis and ANOVA.” Materials Today: Proceedings 72: 1413–19. https://doi.org/10.1016/j.matpr.2022.09.340. [14] Darwish, Naif A., S. Al-Hashimi, and Ali Almansoori. 2008. “Performance Analysis and Evaluation of a Commercial Absorption–Refrigeration Water–Ammonia (ARWA) System.” International Journal of Refrigeration-Revue Internationale Du Froid 31 (7): 1214–23. https://doi.org/10.1016/j.ijrefrig.2008.02.005. [15] Jadidi, H., Mansoor Keyanpour-Rad, Hamidreza Haghgou, B. Chodani, S. Kianpour Rad, and M. Hasheminejad. 2022. “Energy and Exergy Simulation Analysis and Comparative Study of Solar Ejector Cooling System Using TRNSYS for Two Climates of Iran.” Heliyon 8 (8): e10144. https://doi.org/10.1016/j.heliyon.2022.e10144. [16] Montgomery, Douglas C., Raymond H. Myers, Walter H. Carter, and G. Geoffrey Vining. 2005. “The Hierarchy Principle in Designed Industrial Experiments.” Quality and Reliability Engineering International 21 (2): 197–201. https://doi.org/10.1002/qre.615. [17] Solanki, Alka, and Yash Pal.2022. “Evaluation and Optimization of Single-Effect Vapour Absorption System for the Dairy Industry Using Design of Experiment Approach.” Journal of Thermal Engineering 8 (5): 619–31. https://doi.org/10.18186/thermal.1189093. [18] Kazemian, Mohammad, Gandjalikhan S. A. Nassab, and Ebrahim Jahanshahi Javaran. 2020. “Comparative Study of Box–Behnken and Central Composite Designs to Investigate the Effective Parameters of Ammonia–Water Absorption Refrigerant System.” Proceedings of the Institution of Mechanical Engineers, Part C: Journal of Mechanical Engineering Science 235 (16): 3095–3108. https://doi.org/10.1177/0954406220959097. [19] Goyal, Ashwni, Ahmad Faizan Sherwani, and Deepak Tiwari. 2019. “Optimization of Cyclic Parameters for ORC System Using Response Surface Methodology (RSM).” Energy Sources, Part A: Recovery, Utilization, and Environmental Effects 43 (8): 993–1006. https://doi.org/10.1080/15567036.2019.1633443. [20] Gambhir, Deshdeep, Ahmad Faizan Sherwani, Akhilesh Arora, and Ashwni. 2022. “Parametric Optimization of Blowdown Operated Double-Effect Vapour Absorption Refrigeration System.” Journal of Thermal Engineering 8 (1): 78–89. https://doi.org/10.18186/thermal.1067035. [21] Myers, Raymond H., André I. Khuri, and W. H. Carter. 1989. “Response Surface Methodology: 1966-1988.” Technometrics 31 (2): 137. https://doi.org/10.2307/1268813. [22] Canbolat, Ahmet Serhan, Ali Husnu Bademlioglu, Nurullah Arslanoglu, and Ömer Kaynakli. 2019a. “Performance Optimization of Absorption Refrigeration Systems Using Taguchi, ANOVA and Grey Relational Analysis Methods.” Journal of Cleaner Production 229: 874–85. https://doi.org/10.1016/j.jclepro.2019.05.020 . [23] Ketfi, Omar, Mustapha Merzouk, Nachida Kasbadji Merzouk, and Said El Metenani. 2015. “Performance of a Single Effect Solar Absorption Cooling System (LIBR-H2O).” Energy Procedia 74: 130–38. https://doi.org/10.1016/j.egypro.2015.07.534 . [24] Kaushik, S.C., and Akhilesh Arora. 2009. “Energy and Exergy Analysis of Single Effect and Series Flow Double Effect Water–Lithium Bromide Absorption Refrigeration Systems.” International Journal of Refrigeration-Revue Internationale Du Froid 32 (6): 1247–58. https://doi.org/10.1016/j.ijrefrig.2009.01.017. [25] Modi, Bhaumik, Anurag Mudgal, and Bhavesh Patel. 2017. “Energy and Exergy Investigation of Small Capacity Single Effect Lithium Bromide Absorption Refrigeration System.” Energy Procedia 109: 203–10. https://doi.org/10.1016/j.egypro.2017.03.040.
Copyright
Copyright © 2024 Kapil Jain, Basant Kumar Chourasia. This is an open access article distributed under the Creative Commons Attribution License, which permits unrestricted use, distribution, and reproduction in any medium, provided the original work is properly cited.

Download Paper
Paper Id : IJRASET58129
Publish Date : 2024-01-21
ISSN : 2321-9653
Publisher Name : IJRASET
DOI Link : Click Here
 Submit Paper Online

