

Ijraset Journal For Research in Applied Science and Engineering Technology
Smart River Water Level Monitoring System Using IoT
Authors: Mr. Subhankar Sarkar
DOI Link: https://doi.org/10.22214/ijraset.2024.66047
Certificate: View Certificate
Abstract
India is a riverine country; Riverine civilization has developed in India since ancient times. Our India has grown crops around this river. Just as the river has made our country rich in crops, the raging nature of the river has repeatedly brought our country to the brink of destruction. Almost every year, erosion along with floods cause financial and other losses in India. Due to climate change and the damming of rivers every year, river water dries up during summers, and floods during monsoons can cause sudden rises in water and cause loss of life and other damage to humans and other animals. I have tried to show here, Technically and using IoT - that there will be three dimensions to the water level of a river or sea. The first dimension will be the normal dimension second dimension will be the abnormal dimension third dimension will be the super abnormal dimension. And in this case of water level monitoring the three levels will be indicated by three different lights, when the water level in the river reaches the warning level or worse, the authorities in the river zone or sea zone will be notified through messages and warning sirens will be sounded if necessary. In this research paper of mine, the Smart River Water Level Monitoring System model I am trying to show, if implemented, People cattle or property can be saved from the damage caused by flash floods in riparian areas. Apart from that, how the research topics related to rivers can be further improved, those possible topics are discussed in this research paper.
Introduction
I. INTRODUCTION
Our India has been a riverine land since ancient times. India also has several natural and unnatural canals, bilges, lakes, etc. from North to South, east to West. And as a result, all these reservoirs naturally dry up in summer, and naturally rise in all these reservoirs during monsoons. Also, water in reservoirs can rise due to several natural or unnatural reasons. As a result, water rises in the riverbank or coastal areas and creates a flood-like situation. This results in massive loss of life and property. Due to these floods, every year in India, the loss is about several thousand crores of rupees, and several lakhs of agricultural lands are damaged. I tried to show in this project-based research paper that, riparian areas, coastal areas, or areas prone to flash floods, reduce the risk of flooding. Internet of Things and various sensor technologies used in computer science, also using cloud databases. So, warning messages can be given to common people in riparian areas as soon as the water rises in the river, and warning messages can also be sent to the local administration as soon as the water rises. Also, if the river water exceeds the danger level, the warning siren will sound immediately. Also, three different colored indicators will be used in this project, and by looking at those Indicators, common people and administration officials will be able to know about the current situation of river water level or about the advanced situation of flood. Also in this paper, IoT is used, IoT is one of the most widely used Internet technologies today. The Internet of Things is a technology that facilitates user connectivity with various devices and sensors through networks and the cloud. A cloud server is also used here through which the information about the increase or decrease in the water level of the river will be stored and sent as output to the user at specified intervals. Also used is microcontroller ESP-32 device, among other hardware devices. I have also used the online simulator platform-wokwi.com and C, and C++ programs to demonstrate this work experimentally. I will also try to discuss what other steps can be taken to deal with the risk of floods.
II. INTERNET OF THINGS
Internet of Things is a technology through which various devices connect to other network devices or the cloud and exchange data. It is embedded with different software, sensors, and different devices with different connections. That is, by interconnecting different devices, with the help of the internet and cloud, different data can be exchanged, and necessary decisions can be made with the help of different devices. In other words, the Internet of Things is a vast network of various devices, from which data can be collected as needed, data can be shared as per permission, and opportunities for automated systems can be created as needed.
Nowadays internet of technology is widely used in daily life, also through this technology, we can technically control another place from a remote place. The use of Internet of Things technology can be seen in various security applications including agriculture, vehicles, industry trade, hospitality, Robotic Applications, etc. I have used, in this paper, the Internet of Thoughts. So that you can take advanced measures to deal with natural disasters like floods. This time we will look at various applications of the Internet of Things-
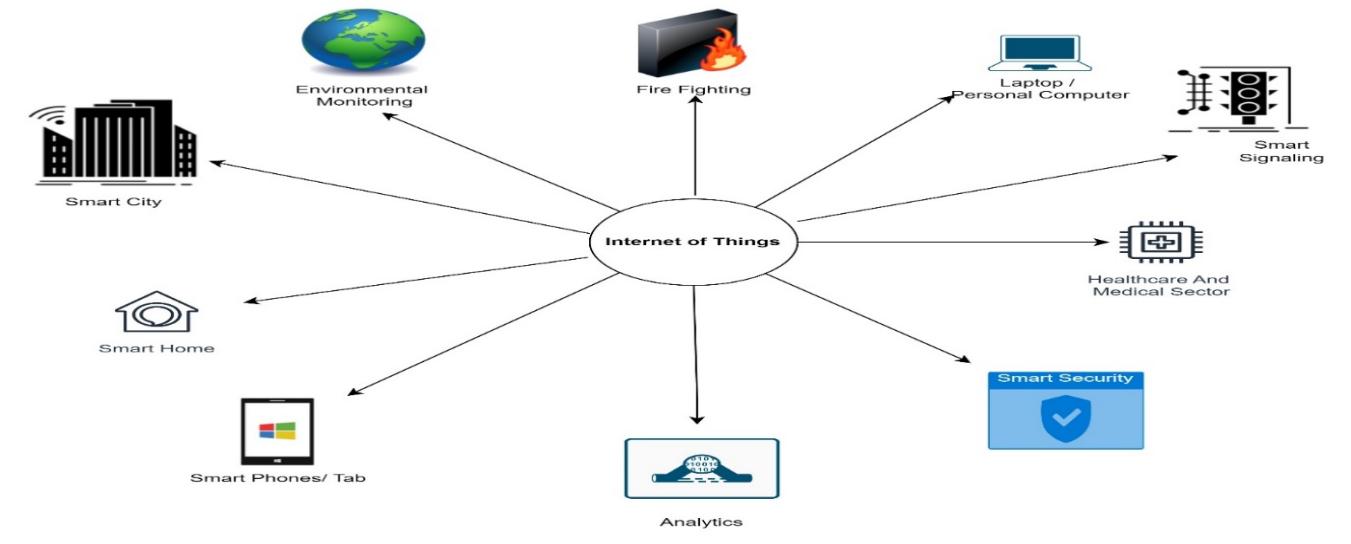
Figure-1. Internet of Things applications.
The use of the Internet of Things can be observed in several areas, such as smartphones, Smart Watch, Laptops or Personal Computers, the Industrial Sector, Vehicle Tracking, Fire Fighting, Home Security, Fire Fighting, Smart Health care, Smart Garden monitoring, etc. In this paper, I have used the Internet of Things keeping in mind the safety of people living in riparian areas or flood-prone areas.
III. LITERATURE REVIEW
- Development Of Portable Water Level Sensor for Flood Management System, V NAGARANI, SIRISHA 2016. In this research paper, they mainly want to show that early warning system for early flood management for flood control. They used Arduino board here in addition to GSM shield, different sensor technology to measure water level. Also, all information related to water level is sent to the user through SMS. Apart from the water level, multiple sensors have been used to measure the relative temperature or excess temperature of the water and also to measure the humidity. Basic information received in SMS was used, which detailed various topics related to population, Arduino board early warning issues, and floods.
- Design of an Automated River Water Level Monitoring System by using Global System for Mobile Communications, Agrey Kato, Ramadhan Sinde, Shubi Kaijage 2016 - This paper is also made for river water level monitoring. And GSM network based on a global system for mobile communication of river water level monitoring data is used. In this paper, it is shown that when the river water level reaches a critical level or a flood situation occurs, an alarm message is sent to the user through the GSM network, and an alarm is sounded if necessary. Arduino is also used as a microcontroller board and Web architecture with advanced sensing equipment. So that river water level or other information or data can be accessed from a remote location. Here all the data related to the river is stored in the database server and can be viewed as needed in the service monitor.
- IoT Based Water Level Monitoring System for Lake in a Cloud Environment S.Sheeba Rani, S.Balakrishnan, V.Kamatchi Sundari, K.C.Ramya 2019. This paper is mainly developed for lake water monitoring using Internet of Things and cloud computing. Basically, a proposal paper on how to monitor the lake water and the related data has been sent to the user. It monitors the water level from an inaccessible source and sends the information related to that monitoring to the cloud server through internet communication technology Status information is stored in the cloud and can be managed through web monitoring services.
- A Review on Water Level & Quality Monitoring System Rakshitha M R, C M Maheshan, Dept. of Electrical Engineering, Assistant Professor, Dept. of Electrical Engineering, University Visvesvaraya College of Engineering 2020, In this review research paper what they mainly try to say is - about the use of water level monitoring system and its implementation in different industrial sector or domestic water storage. Apart from this, the monitoring of water level increase through Arduino board with different sensors is also mentioned along with the increase in water level of the river or the increase in tidal water. Besides and other water level monitoring along with flood monitoring river water level monitoring groundwater is also discussed here. Water quality is also mentioned here. Also in the proposed methodology, they have shown the use of ultrasonic sensors and pH sensors with a water pump, and LCD to see output here with an Arduino board and buzzer when the water level rises.
- WATER LEVEL MONITORING SYSTEM Mr. Pawar Vikrant Subhash, Mr. Kale Swapnil Baba, Miss. Patil Shivani Adesh, Mr. Vhankade Rajesh Narendra, Prof. A.A Bamnikar 2022. This paper is mainly done to alert the user as the water level rises, The project is designed to prevent wastage of water. And here's the whole system - using an AVR, a Raspberry Pi as a microcontroller, and a Wi-Fi modem to send data with an LCD screen. A buzzer is also used to sound a warning when the water level rises above normal levels. This project based on IoT is a water level monitoring system to be used to prevent water wastage, which will prevent water storage from overflowing.
- IoT-BASED FLOOD MONITORING AND ALERTING SYSTEM Mr. J. Rajanikanth, Bandi Saahithi, Dorigundla Sreelatha Reddy, Gangireddygari Sumanth Kumar Reddy, Areddula Sangeetha, Ravulacheruvu Suhaib Ahamad 2023-In this research paper also explores the use of Internet of Things to deal with natural disasters like floods. Here also Arduino mega board is used as a microcontroller also DHC11 sensor, and a GSM model is used. Also, complete monitoring of river water has been done through the application. Here too information on water level as well as water temperature and humidity flow is collected. And GSM module is used to send all the received data. Here too the sensors connected to the system measure the relevant parameters and the entire report is viewed through the LCD and sent to the IOT Web Application. ThinkSpeak web application is used to store all these data.
IV. PROBLEM STATEMENTS
After studying several research papers on the rise in river levels, and after observing several flood-prone areas. Most of the research papers have been written on water quality management, or sometimes on water level and multiple issues including water speed, temperature, humidity, etc. Also, some research papers have seen the use of web applications for monitoring. And in research papers, cloud applications, and GSM Shield have been used to exchange information. Most research papers use Arduino boards as microcontroller devices. I have visited several flood-prone areas for research and other purposes. In most cases, a manual scale is used to measure the water level of the river. At that scale there is no technical touch, manpower is required to watch the rise in the water level of the river. Nor have I seen the use of any of the smart flood detection systems described above at flood sites. So I tried using some sensor devices and an ESP-32 microcontroller board and at a very low cost, email or get information about the water level of river or sea through SMS every 5 minutes. Besides receiving SMS or email, in my research paper, I have also tried to show the Use of three types of color indicators to indicate water level (Normal level - Green, Yellow alert - Yellow, Red alert – Use Red Indicator) When the water level rises above the danger level, alerting the people living in the riparian areas through the buzzer.
V. SYSTEM REQUIREMENTS
A. Hardware Descriptions:
1) ESP-32 Microcontroller: ESP-32 Microcontroller is an open-source platform, It is also a hardware part, which can be called a physical programmable circuit device it is used in various projects of the Internet of Things. This device can also provide Wi-Fi and Bluetooth functionality and interface with other systems. Not only this, but this platform does not require any separate hardware to load the code. It is therefore a popular device among programmers, as it generally consumes less power than other microcontrollers.
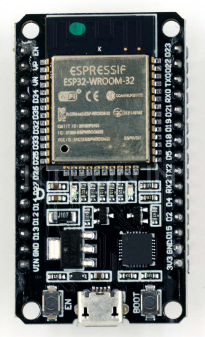
Figure-2. ESP 32 Microcontroller Board.
2) Water Level Sensor: A water level sensor is a widely used hardware device, this device is used to detect water levels. It measures the height of the water liquid level and converts it into an electrical signal for output. Here also, I have used the water label sensor which will know the current status of the water level through the indicator as the water level rises.
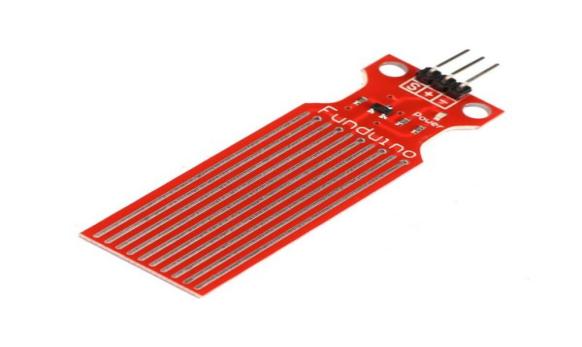
Figure-3. Water level Sensor.
3) Resistor: A resistor is an electrical component that is passive and serves to control the flow of electricity in a circuit. resistors in electrical circuits help reduce current flow and maintain voltage levels. Resistors are commonly found in various circuits to reduce the voltage in a particular part of the circuit.
4) LED Indicator: It is an illuminated element used to show the output of various circuits, that is, these lights are used to show an experiment circuit the result of a circuit, or a permanent result of a circuit, and they are of different colors. Here I have used three colors of indicator (Red, Yellow, and Green) that indicate different conditions of water level for water level measurement.
5) Buzzer: Buzzer generally refers to an electromechanical audio signaling device. This device usually converts various signals into audio or sound as required. It is usually powered by DC voltage and is used to generate various music bell sounds for various types of alarms or warning alarms. Bazars are also used here, as the water level of the river rises, when the water level reaches its highest level, the bazaar is struck.
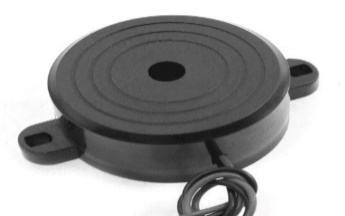
Figure-4. Buzzer.
6)BreadBoard:Thebreadboard is a tool used when testing a circuit or electrical test before completing it. A breadboard is a tool used when testing a circuit or electrical test before completing it. This board consists oftwo parts, the upper part is connected to the side, the lower part is connected up and down. users will use this card in various digital electronics laboratories or computer architecture laboratories or when designing circuits according to their needs.
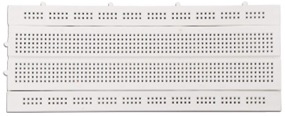
Figure-5. Breadboard.
6) Connecting Wires: In making various experimental electronic circuits, when microcontrollers different types of sensors, indicators, or ICs are placed on the breadboard, connecting wires are required to connect them to each other, and to supply power. In these cases connecting wires of different colours are used for ease of understanding.
7) LCD Screen / Output Monitor: LCD screen or Output Monitor is a device commonly used as an output of computer devices. When the entire circuit is run, the water level situation will be visualized in the output form. Here also the complete information regarding the river water level, the current situation of the river water level can be seen through the LCD screen.
8) Power Supply: A power supply is required for making any new electronic project or any new circuit and running microcontroller boards, here also electronic power supply is also required (For ESP-32, 5 volts are used here).
B. Software Descriptions
- Python: Python is a high-level object-oriented programming language; Python programming language is mainly used for rapid application development It is used as a scripting language to connect many components. Python language is used to work on the proposed model in this research paper.
- Arduino: Arduino programming language is somewhat similar to C language. Based on a common hardware programming language called Processing. Here, after sketching a plan, the program required for execution is uploaded to the Arduino board or ESP32 Board.
- Cloud application Server: A Cloud application server is an internet technology where users can store and access data from anytime anywhere if an Internet Connection and Computer Device are required. A Cloud Server is a virtual infrastructure that performs applications data processing and storage.
- AWS Lambda: Aws lambda is a Function as a Service (FaaS) product by AWS. This is also called a microservice platform. Lambda can run almost any type of application, as long as the application is not very CPU-heavy. AWS claims lambda is very responsive and highly scalable, which means lambda can handle many more incoming requests. In AWS lambda can achieve concurrency up to 1000 instances at a time. it can easily handle more than 500 simultaneous incoming HTTP requests. It is a serverless computing platform provided by Amazon. AWS Lambda is an infrastructure that performs multiple functions including coding, maintenance, automated scaling, and monitoring. AWS Lambda, it is possible to run code without server management.
- AWS API Gateway: AWS API gateway is used to create and expose Rest API URLs, API gateway has two options to expose URLs, rest API, and web socket. We need rest API because this HTTP call is a one-way connection and does not rely on the server response. Here we can create robust, secure, and scalable APIs easily, publish, maintain, and monitor APIs (Application Programming Interface) at any scale, as well as data stored in the AWS Cloud. Here I can create APIs to use my client applications or make APIs accessible to others.
- AWS SES: AWS SES is called Simple Email Service. It is an email client service offered by AWS. AWS SES can help to send emails to notify users about the Present situation. To send emails to users, a sender’s identity needs to be verified first, like an email address or a valid activated domain. Emails are sent when the sensing values are below or above the specified limit.
VI. PROPOSED SYSTEM AND SYSTEM FUNCTIONING
Mainly I want to show the Smart River Water Level Monitoring System, instead of the scales that were used in the old days to measure the water level of the river, I tried to make a smart modern water level meter to measure the water level of the river using Internet of Things. And as a result, the current water level of the river will be known through three different color indicators as the water level of the river increases and we can see and know it through the LCD screen. When the water level of the river rises above normal, the red indicator will flash, and the warning siren will sound. If necessary, the complete information will go to the local Disaster management office or the administration in the form of a message. Those local people can be saved from floods or given enough time to deal with floods. Here it is mainly tried to show that, instead of the old scale which was used to measure the water level of the river, the modern digital method of measuring the water level of the river and warning the people if necessary. I tried to explain how the smart river water level monitoring system can work through an algorithm so that the whole system can work like this.
Working Algorithm:
Step 1: To measure River water level
Green Blink River water level: 50 meters
Yellow Blink River water level: 51 to 80 meters
Red Blink and Sound River water level: 81 meters
Step 2: Initialize variables:
Present water level
Step 3: Repeat indefinitely:
a. Read the Present water level of the river.
b. If the River water level is below or equal to 50 meters;
then Blink Green LED.
c. If the River water level is between 51 to 80 meters;
then Blink Yellow LED.
d. If the River water level is above 80 meters;
then Blink Red LED and sound an alarm.
e. Wait for a while to avoid rapid blinking.
Step 4: End loop.
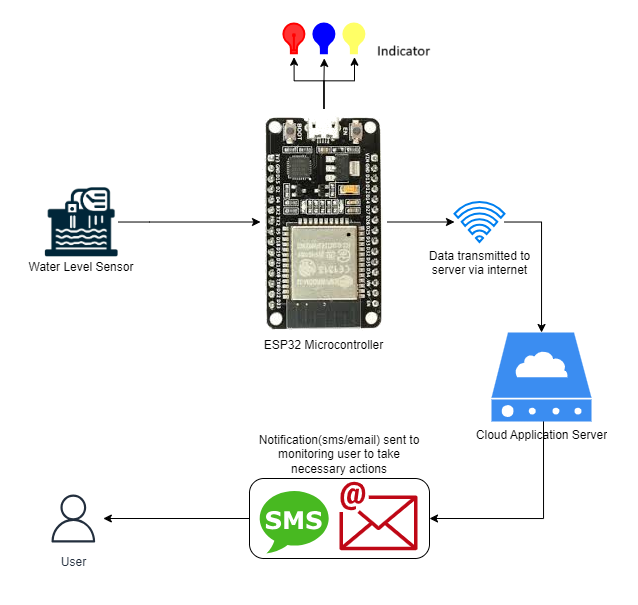
Figure 6. System Functioning.
VII. WORKING FLOWCHART
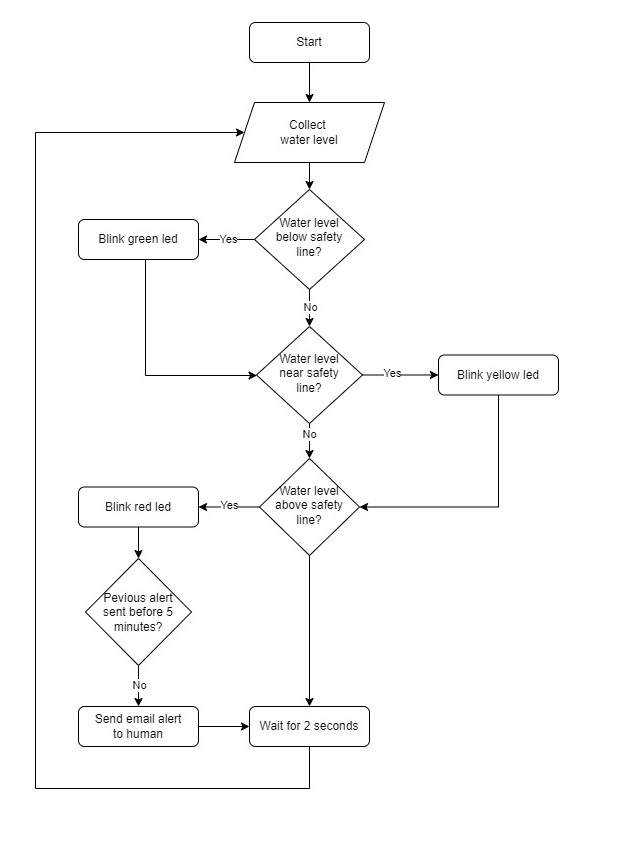
Figure-7. Flowchart Diagram.
VIII. CIRCUIT DIAGRAM AND NECESSARY EQUIPMENT
Equipment: - Breadboard, ESP-32 Microcontroller, Indicators (Red, Yellow, Green), Buzzer, Water level Sensor, LCD, Connecting wires.
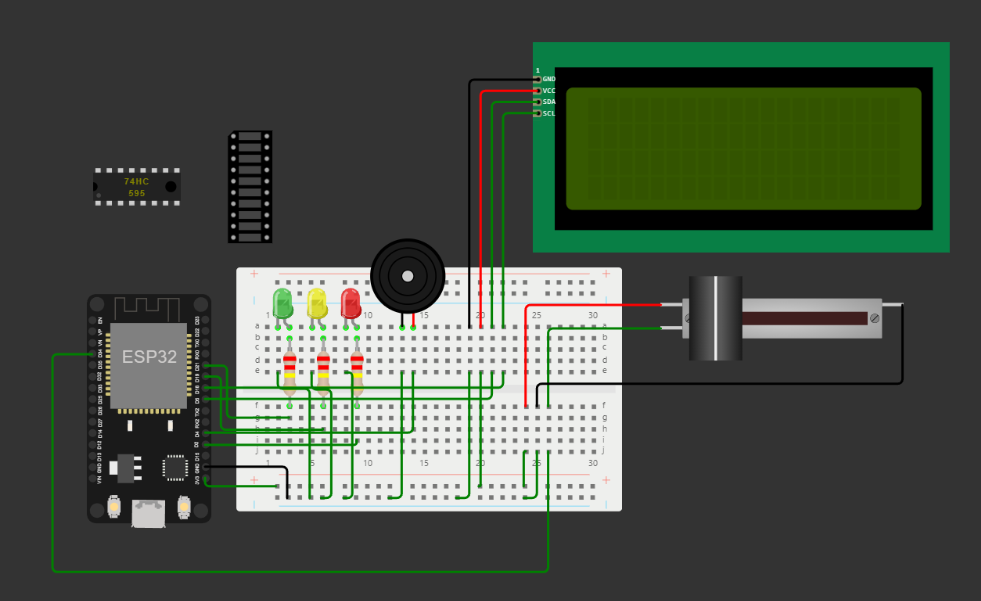
Figure-8. Experimental Circuit Diagram and Necessary Equipment.
IX. RESULTS
- Hello, Water Level is
- WiFi connected
- IP address: 10.10.0.2
- 0
- 0
- 0
- 19
- 19
- 41
- 47
- 66
- 70
- 70
- 78
- 84
- 88
- 94
- 94
- 94
- 94
- 100
- 94
- 69
- 69
- 50
- 50
- 41
- 66
- 72
- 80
- 80
- 80
- 88
- 88
- 88
- 88
- 88
- 80
- 70
- 70
- 60
- 62
- 50
- 55
- 57
- 60
- 70
- 80
- 88
- 90
- 100
- 100
- 100
- 100
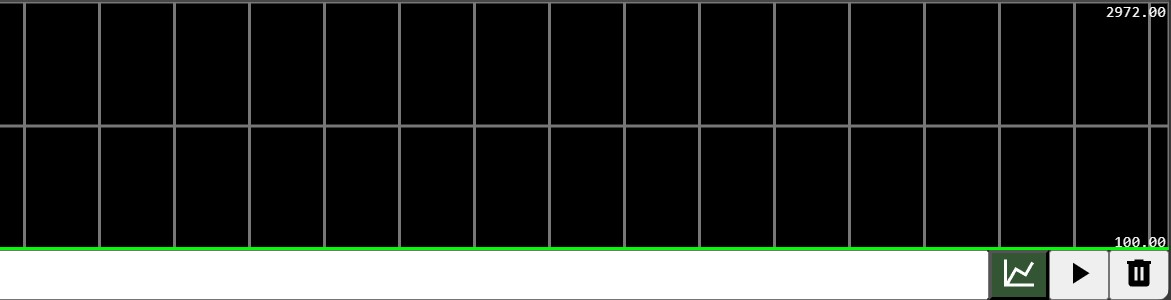
Figure-9. Graphical River Water Level Monitoring, When water level is 0-50 meters.
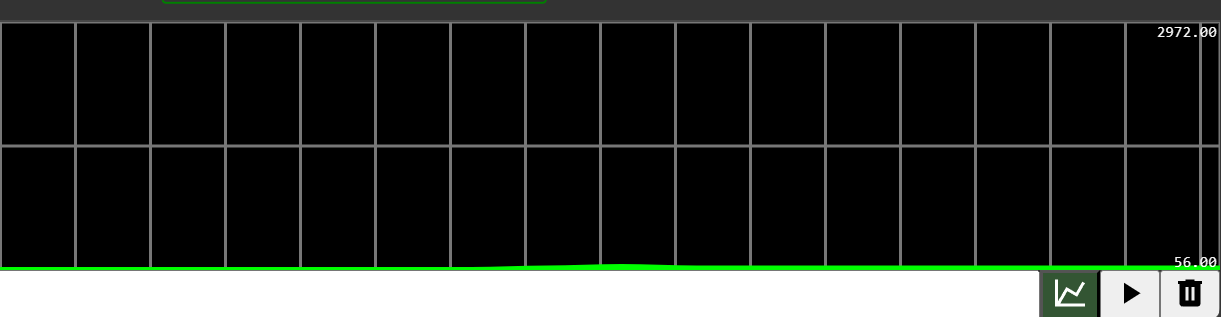
Figure-10. Graphical River Water Level Monitoring, when river water level crosses 50 Meters.
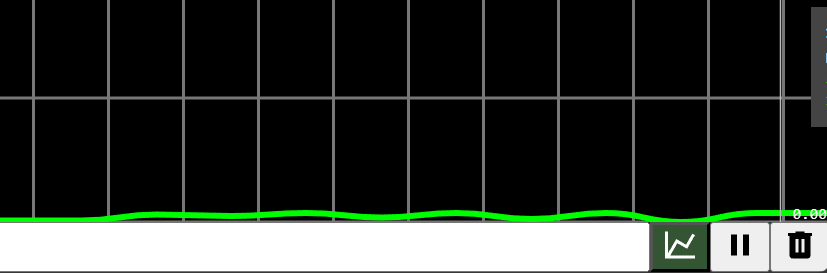
Figure-11. Graphical River Water Level Monitoring when river water level crosses 81 Meters.
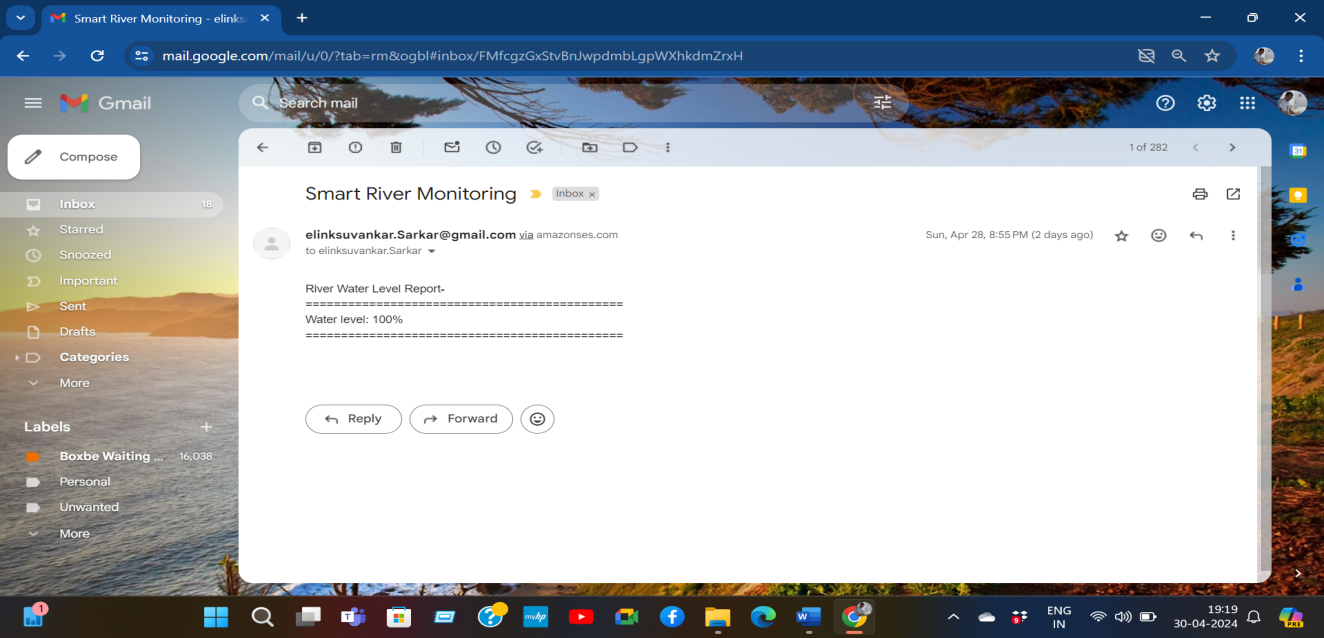
Figure-12. Email Alert.
Figure-13. Email Alert. (Every five minutes interval)
In this research paper, the result section, I have shown that. The proposed model for river water level measurement, after running it using an online simulator platform. The whole system runs successfully, and when the water level sensor is raised and lowered (used to measure the water level). The water level is then displayed on the output screen as a number. When the water level is close to the danger limit, the yellow indicator lights up, and when the water level exceeds the danger limit, the red indicator lights up, and a buzzer sounds as a warning. Also, water level information is sent to the user via email at regular intervals. Also in the results section, a part of the graph is shown, through which the information regarding the increase or decrease in the river level can be better understood. Also the graph that I have shown in the result section implies that when the water level rises excessively we can also know about the rise in water level through the graph.
X. FUTURE WORKS
In this research paper, I tried to show that it is possible to measure the water level of the river by using the Internet of Things and sensor technology without being physically present in the river bank area. This time I will discuss several points on how to improve the research on river water level or flood.
- Using IoT and AI jointly: If various devices of Internet of Things and Algorithms of Artificial Intelligence can be used jointly for river water level monitoring or river-related monitoring, or improve these related systems. Various sensors in the Internet of Things can collect real-time data such as water temperature or river flow. Also after analyzing the obtained data using artificial intelligence algorithms, A flood forecaster can accurately predict any anomaly related to the river.
- Use of Machine Learning (Predictive Analysis model): If predictive analysis models of machine learning can be used to analyze past data on river water levels or river-related other monitoring, However, the use of predictive analysis models can provide residents of riparian areas with an accurate prediction of sudden water level rise. As a result, the risks faced by the residents of riparian areas – namely from rising water levels or floods – will be reduced by using this machine learning model.
- Use of remote sensing technology for river water level monitoring: Remote sensing technology is one of the most widely used technologies today, Using this advanced technology can be monitored from one place to another through remote control. This technology is mainly used for remote monitoring. River water level monitoring in remote areas mainly requires the use of remote sensing technologies, such as satellite imagery or the use of drones or LIDAR-Light Detection and ranging technology, This can provide coverage of current water level conditions in large area rivers or remote areas river basins, and allow accurate water level measurements.
- Use of Block Chain Technology: Blockchain is a type of technology that is commonly used and applied to protect the integrity and security of stored data. In this case, all the data related to river water level monitoring obtained through sensor devices can be used to protect the security and integrity of the data. Blockchain technology can also act as a tamper-proof platform to bring transparency and trust in water management processes.
- Collection of river water level data using a mobile application: A person should be appointed in the river bank area who can report the water level of the river using a smart mobile application. That requires specially developed mobile applications to collect information about river water levels a result, by analyzing the river water level data obtained through the mobile application, necessary steps can be taken for early flood forecasting or early warning.
- Involvement and education in riparian communities: Greater awareness needs to be raised among local communities to reduce the risk of rising river levels and flooding. Local communities need to come forward with knowledge and tools to inform the local situation, including monitoring changes in water level rise, and empowering them, if necessary, with training to deal with floods. Besides, in flood-prone areas and schools, provision should be made for detailed geographical and technical education related to river flooding and water level rise. Also, from time to time seminars should be organized along with education on how to deal with floods, and protect the environment and river ecosystems.
- Integration with Urban planning: Along with the integration of river water level monitoring system emphasis should be given to developing urban planning. That is, urban planning should be done with modern technology considering the flood risk. Urban planning in riverside areas should be done in such a way that if there is a sudden rise in water level in the riverside areas due to climate change or if a situation like a flood occurs, the damage can be planned.
Conclusion
This paper is generally designed keeping in mind the people living in riparian areas or flood-prone areas, I have done this research paper to digitally monitor the complete information related to rivers or floods. India is a riverine country, and natural calamities especially floods occur every year. In dealing with floods, in most cases, detailed information about river water levels is not available. As a result, various problems have to be faced while dealing with floods. In my research paper, I have shown the measurement of river water level and its data through the online simulator (wokwi.com). Here, if the water level of the river rises suddenly, the graph also shows that the water level of the river has increased more than normal. Also, if the water level of the river rises excessively, besides the siren buzzer, it will be known through email or SMS at a fixed interval. For receiving SMS or email, I used the Amazon web service here. As three indicators are arranged to understand the current situation in the river water level, we can also know about the water level with the help of an LCD or output monitor. Finally, several points on how to improve river level rise or river-related research are also highlighted in this paper. If the work of this research paper is implemented, our country will take several steps forward in dealing with disasters - especially floods in the future.
References
[1] ESP-32 Microcontroller device: https://www.tutorialspoint.com/esp32_for_iot/esp32_for_iot_introduction.htm [2] Internet of Things and Applications: https://www.techtarget.com/iotagenda/definition/Internet-of-Things-IoT. [3] Water Level Sensor: https://techatronic.com/what-is-water-level-sensor-working-explanation-of-water-level-sensor/ [4] Resistor: https://en.wikipedia.org/wiki/Resistor [5] BreadBoard: https: //hibp.ecse.rpi.edu/~connor/education/breadboard.pdf [6] Buzzer: - https://www.elprocus.com/buzzer-working-applications/ [7] River Water level Parameter: https://www.ysi.com/parameters/level [8] Online Simulator Platform: wokwi.com [9] AWS: https://docs.aws.amazon.com/whitepapers/latest/aws-overview/introduction.html [10] AI And Machine Learning used in River Water monitoring: https://iwaponline.com/wst/article/88/9/2297/98121/Application-of-machine-learning-in-river-water [11] Remote sensing technology for river water level monitoring: https://www.cyient.com/blog/advances-in-remote-sensing-technologies-for-monitoring-river-water-quality [12] Collection of river water level data using a mobile application: https://www.envirotech-online.com/news/water-wastewater/9/in-situ-inc/androidtrade-mobile-app-technology-for-water-level-is-announced/44051 [13] Blockchain-based Internet of Things for Smart River Monitoring System M K Tajudin1, M A Sarijari2, A K M Ibrahim3 and R A Rashid4 1,2,3,4Telecommunication Software and Systems Research Group, Communication Engineering Department, School of Electrical Engineering, Faculty of Engineering, Universiti Teknologi Malaysia, Skudai, MALAYSIA. [14] DEVELOPMENT OF PORTABLE WATER LEVEL SENSOR FOR FLOOD MANAGEMENT SYSTEM- V NAGARANI, SIRISHA. Department of ECE Megha Institute of Engineering & Technology For Women’s Edulabad, Ghatkesar Mandal, RangaReddy Dist. Telangana, India, © October 2016 | Volume 1, Issue 10. Paper Code- IJSDR1610039. Journal- IJSDR. ISSN: 2455-2631 [15] IOT Based Real-Time River Water Quality Monitoring System Bhoomika R1, Netra Jalagar2, Pooja F B3, Sangeetha Sontera4, & Shanthveeresh N S(Asst., Professor)5 Department of Electrical and Electronics Engineering PES Institute of Technology and Management, Shivamogga, Karnataka. Publication Journal -IJRES. and ISSN (for Online): 2320-9364, ISSN (for Print): 2320-9356 www.ijres.org Volume 9 Issue 7 ?Year of Publication 2021 ? Page No. 11-14. [16] A Review on Water Level & Quality Monitoring System by Rakshitha M R, and C M Maheshan Dept. of Electrical Engineering, Assistant Professor, Dept. of EE (Electrical Engg.). University Visvesvaraya College of Engineering, India. Publication Journal- International Journal of Engineering Research & Technology. www.ijert.org NCETESFT - 2020 Conference Paper. [17] Internet of Things BASED FLOOD MONITORING AND ALERTING SYSTEM Mr. J. Rajanikanth, M.Tech(Ph.D), Bandi Saahithi , Dorigundla Sreelatha Reddy, Gangireddygari Sumanth Kumar Reddy , Areddula Sangeetha, Ravulacheruvu Suhaib Ahamad. J. Rajanikanth, Associate Professor, 5jrajanikanth@gmail.com. Bandi Saahithi, Student, bandisaahithi@gmail.com Dorigundla Sreelatha Reddy, Student, sree80502@gmail.com. 4 Gangireddygari Sumanth Kumar Reddy, Student, sumanthkumarreddy2002@gmail.com 5. Areddula Sangeetha, Student, sangeetha1423100@gmail.com 6. Ravulacheruvu Suhaib Ahamad, Student, jsuhaib710@gmail.com Department of Electronics and Communication Engineering, Siddharth Institute of Engineering & Technology, Puttur, Andhra Pradesh, India. Vol-9 Issue-2 2023 IJARIIE-ISSN(O)-2395-4396. 19486 ijariie.com [18] Design of an Automated River Water Level Monitoring System by using Global System for Mobile Communications Agrey Kato Electronics and Telecommunication Engineering The Nelson African Institution of Science and Technology Arusha, Tanzania katoa@nm-aist.ac.tz Ramadhan Sinde1, Shubi Kaijage2 Electronics and Telecommunication Engineering The Nelson African Institution of Science and Technology Arusha, Tanzania 1ramadhani.sinde@nm-aist.ac.tz, 2shubi.kaijage@nm-aist.ac.tz s See discussions, stats, and author profiles for this publication at: https://www.researchgate.net/publication/295393736 [19] WATER LEVEL MONITORING SYSTEM Mr. Pawar Vikrant Subhash*1, Mr. Kale Swapnil Baba*2, Miss. Patil Shivani Adesh*3, Mr. Vhankade Rajesh Narendra*4, Prof. A.A Bamnikar*5*1,2,3,4Electronics & Communications Engineering, Pdea\'s College Of Engineering, Manjri, Pune, India.*5Guide, Electronics & Communications Engineering, Pdea\'s College Of Engineering, Manjri, Pune, India. Volume:04/Issue:05/May-2022 Impact Factor- 6.752e-ISSN: 2582-5208. Publication Journal: IRJMETS. www.irjmets.com. [20] IoT Based Water Level Monitoring System for Lake in a Cloud Environment 2019 S.Sheeba Rani1, S.Balakrishnan2, V.Kamatchi Sundari3, K.C.Ramya1 1 Associate Professor, Department of Electrical and Electronics Engineering, 2 Professor, Dept. of CSE, 1 and 2 - Sri Krishna College of Engineering and Technology, Coimbatore, Tamilnadu, India. and 3 Professor, Department of Electronics & Communication Engineering, Prince Shri Venkateshwara Padmavathy Engineering College, Chennai. International Journal of Lakes and Rivers. ISSN 0973-4570, Volume 12, Number 1 (Year of Publication 2019), Page no . 21-25 © Research India Publications http://www.ripublication.com
Copyright
Copyright © 2024 Mr. Subhankar Sarkar. This is an open access article distributed under the Creative Commons Attribution License, which permits unrestricted use, distribution, and reproduction in any medium, provided the original work is properly cited.

Download Paper
Paper Id : IJRASET66047
Publish Date : 2024-12-21
ISSN : 2321-9653
Publisher Name : IJRASET
DOI Link : Click Here
 Submit Paper Online