

Ijraset Journal For Research in Applied Science and Engineering Technology
Social Network Fake Profile Identification
Authors: Mr. Saroj Subedi
DOI Link: https://doi.org/10.22214/ijraset.2025.66738
Certificate: View Certificate
Abstract
The social network, a crucial part of our life is plagued by online impersonation and fake accounts .Fake profiles are mostly used by the intruders to carry out malicious activities such as harming person , identity theft and privacy intrusion in Online Social Network(OSN). Hence identifying an account is genuine or fake is one of the critical problem in OSN .In this paper we proposed many classification algorithm like Support Vector Machine algorithm and deep neural network .It also studies the comparison of classification methods on SpamUser dataset which is used to select the best.
Introduction
I. INTRODUCTION
A. Background
Online Social Networks (OSNs), such as Facebook, Twitter and LinkedIn, have become popular over the last few years. People use OSNs to keep in touch with each other’s, share news, organize events, and even run their own e-business. Facebook community continues to grow with more than 2.2 billion monthly active users and 1.4 billion daily active users, with an increase of 11% on a year-over-year basis. In today's digital age, the ever-increasing dependency on computer technology has left the average citizen vulnerable to crimes such as data breaches and possible identity theft. These breaches often target social media networks. this emerges the incentive for social networks to improve their cyber security.
In today's digital age, the ever-increasing dependency on computer technology has left the average citizen vulnerable to crimes such as data breaches and possible identity theft. These attacks can occur without notice and often without notification to the victims of a data breach. At this time, there is little incentive for social networks to improve their data security. These breaches often target social media networks such as Facebook and Twitter. They can also target banks and other financial institutions.
The other dangers of personal data being obtained for fraudulent purposes is the presence of bots and fake profiles. Bots are programs that can gather information about the user without the user even knowing. This process is known as web scraping. What is worse, is that this action is legal. Bots can be hidden or come in the form of a fake friend request on a social network site to gain access to private information
There seems to be a newsworthy issue involving social media networks getting hacked every day. Recently, Facebook had a data breach which affected about 50 million users. Facebook provides a set of clearly defined provisions that explain what they do with the user's data. The policy does very little to prevent the constant exploitation of security and privacy. Fake profiles seem to slip through Facebook's built-in security features.
B. Brief history of Technology and Concept
The solution presented in this paper intends to focus on the dangers of a bot in the form of a fake profile on your social media. This solution would come in the form of an algorithm. The language that we chose to use is Python. The algorithm would be able to determine if a current friend request that a user gets online is an actual person or if it is a bot or it is a fake friend request fishing for information. Our algorithm would work with the help of the social media companies, as we would need a training dataset from them to train our model and later verify if the profiles are fake or not. The algorithm could even work as a traditional layer on the user's web browser as a browser plug-in.
C. Applications
Object detection is definitely spotting an anomaly and it has industry specific usages. For instance, in the field of agriculture object detection helps in identifying infected crops and thereby helps the farmers take measures accordingly. It could also help identify skin problems in healthcare. In the manufacturing industry the object detection technique can help in detecting problematic parts fast and thereby allow the company to take the right step. It is needless to point out that in the field of security and surveillance object detection would play an even more important role. With object tracking it would be easier to track a person in a video.
D. Motivation
In today’s online social networks there have been a lot of problems like fake profiles, online impersonation etc., Till date , no one has come up with a feasible solution to these problems .In this project we intend to give a framework with which the automatic detection of fake profiles can be done so that the social life of people become secured and using automatic detection technique we can make it easier for the sites to manage the huge number of profiles which can’t be done manually.
II. LITERATURE SURVEY
A. Introduction
A literature review is the identification and examining of the existing research work in the chosen field to gain valuable information. Literature review was performed to understand the existing learning algorithms and to choose the suitable supervised and unsupervised method for image classification. As the study was made to compare supervised and unsupervised algorithms, the literature review was performed to identify the most effective algorithm of each kind. The algorithms identified were further used in experimentation.
B. Related Work
1) Zhou, Bolei; Lapedriza Garcia, Agata; Xiao, Jianxiong; Torralba, Antonio; “Oliva, Aude Learning Deep Features for Scene Recognition using Places Database”
Understanding the world in a single glance is one of the most accomplished feats of the human brain: it takes only a few tens of milliseconds to recognize the category of an object or environment, emphasizing an important role of feedforward processing in visual recognition. One of the mechanisms subtending efficient human visual recognition is our capacity to learn and remember a diverse set of places and exemplars; by sampling the world several times per second, our neural architecture constantly registers new inputs even for a very short time, reaching an exposure to millions of natural images within just a year. Besides the exposure to a dense and rich variety of natural images, one important property of the primate brain is its hierarchical organization in layers of increasing processing complexity, an architecture that has inspired Convolutional Neural Networks or CNNs. These architectures together with recent large databases (e.g., ImageNet) have obtained astonishing performance on object classification tasks . However, the baseline performance reached by these networks on scene classification tasks is within the range of performance based on hand-designed features and sophisticated classifiers learned by object-centric versus scene-centric CNNs are different: iconic images of objects do not contain the richness and diversity of visual information that pictures of scenes and environments provide for learning to recognize them.
Here we introduce Places, a scene-centric image dataset 60 times larger than the SUN database. With this database and a standard CNN architecture, we establish new baselines of accuracies on 1 various scene datasets (Scene15, MIT Indoor67, SUN database, and SUN Attribute Database), significantly outperforming the results obtained by the deep features from the same network architecture trained with ImageNet1 . The paper is organized as follows: in Section 2 we introduce the Places database and describe the collection procedure. In Section 3 we compare Places with the other two large image datasets: SUN and ImageNet. We perform experiments on Amazon Mechanical Turk (AMT) to compare these 3 datasets in terms of density and diversity. In Section 4 we show new scene classification performance when training deep features from millions of labeled scene images. Finally, we visualize the units’ responses at different layers of the CNNs, demonstrating that an object-centric network (using ImageNet [12]) and a scene-centric network (using Places) learn different features.
2) O. Chapelle, V. Sindhwani and S. S. Keerthi, “Optimization Techniques for Semi Supervised Support Vector Machines,” Journal of Machine Learning Research, Vol. 9, 2008, pp. 203-233.
In many applications of machine learning, abundant amounts of data can be cheaply and automatically collected. However, manual labeling for the purposes of training learning algorithms is often a slow, expensive, and error-prone process. The goal of semi-supervised learning is to employ the large collection of unlabeled data jointly with a few labeled examples for improving generalization performance. The design of Support Vector Machines (SVMs) that can handle partially labeled data sets has naturally been a vigorously active subject. A major body of work is based on the following idea: solve the standard SVM problem while treating the unknown labels as additional optimization variables. By maximizing the margin in the presence of unlabeled data, one learns a decision boundary that traverses through low data-density regions while respecting labels in the input space. In other words, this approach implements the cluster assumption for semi-supervised learning—that is, points in a data cluster have similar labels (Seeger, 2006; Chapelle and Zien, 2005).
This idea was first introduced by Vapnik and Sterin (1977) under the name Transductive SVM, but since it learns an inductive rule defined over the entire input space, we refer to this approach as Semi-Supervised SVM (S3VM). Since its first implementation by Joachims (1999), a wide spectrum of techniques have been applied to solve the non-convex optimization problem associated with S 3VMs, for example, local combinatorial search (Joachims, 1999), gradient descent (Chapelle and Zien, 2005), continuation techniques (Chapelle et al., 2006a), convex-concave procedures (Fung and Mangasarian, 2001; Collobert et al., 2006), semi-definite programming (Bie and Cristianini, 2006; Xu et al., 2004), non-differentiable methods (Astorino and Fuduli, 2007), deterministic annealing (Sindhwani et al., 2006), and branch-and-bound algorithms (Bennett and Demiriz, 1998; Chapelle et al., 2006c). While non-convexity is partly responsible for this diversity of methods, it is also a departure from one of the nicest aspects of SVMs. Table 1 benchmarks the empirical performance of various S 3VM implementations against the globally optimal solution obtained by a Branch-and-Bound algorithm. These empirical observations strengthen the conjecture that the performance variability of S 3VM implementations is closely tied to their susceptibility to sub-optimal local minima. Together with several subtle implementation differences, this makes it challenging to cross-compare different S 3VM algorithms.
3) Cloud Cover Assessment in Satellite Images via Deep Ordinal Classification
ChaominShenetal. discuss that the percentage of cloud cover is one of the key indices for satellite imagery analysis. To date, cloud cover assessment has performed manually in most ground stations. To facilitate the process, a deep learning approach for cloud cover assessment in quicklook satellite images is proposed. Same as the manual operation, given a quicklook image, the algorithm returns 8 labels ranging from A to E and *, indicating the cloud percentages in different areas of the image. This is achieved by constructing 8 improved VGG-16 models, where parameters such as the loss function, learning rate and dropout are tailored for better performance. The procedure of manual assessment can be summarized as follows. First, determine whether there is cloud cover in the scene by visual inspection. Some prior knowledge, e.g., shape, color and shadow, may be used. Second, estimate the percentage of cloud presence. Although in reality, the labels are often determined as follows. If there is no cloud, then A; If a very small amount of clouds exist, then B; C and D are given to escalating levels of clouds; and E is given when the whole part is almost covered by clouds. There is also a label * for no-data.
This mostly happens when the sensor switches, causing no data for several seconds. The disadvantages of manual assessment are obvious. First of all, it is tedious work. Second, results may be inaccurate due to subjective judgement. A novel deep learning application in remote sensing by assessing the cloud cover in an optical scene is considered. This algorithm uses parallel VGG 16 networks and returns 8 labels indicating the percentage of cloud cover in respective subscenes. The proposed algorithm combines several stateof-the-art techniques and achieves reasonable results.
4) Learning Multiscale Deep Features for HighResolution Satellite Image Scene Classification
QingshanLiuetal. discuss about a multiscale deep feature learning method for high-resolution satellite image scene classification. However, satellite images with high spatial resolution pose many challenging issues in image classification. First, the enhanced resolution brings more details; thus, simple lowlevel features (e.g., intensity and textures) widely used in the case of low-resolution images are insufficient in capturing efficiently discriminative information. Second, objects in the same type of scene might have different scales and orientations. Besides, highresolution satellite images often consist of many different semantic classes, which makes further classification more difficult. Taking the commercial scene comprises roads, buildings, trees, parking lots, and so on. Thus, developing effective feature representations is critical for solving these issues.
III. SYSTEM ANALYSIS
Analysis is the process of breaking a complex topic or substance into smaller parts to gain a better understanding of it. Gathering requirements is the main attraction of the Analysis Phase. The process of gathering requirements is usually more than simply asking the users what they need and writing their answers down. Depending on the complexity of the application, the process for gathering requirements has a clearly defined process of its own.
A. Proposed System
The aim of the project is to design a system Detection and classification of objects in satellite image using Deep learning techniques. The model is mainly divided into two phases. The first phase was collecting datasets. Datasets used were collected from DOTA. The second phase was training the model using YOLOv3 and detection process.
B. Hardware Requirements
One machine is needed with following minimal requirement for this
|
• |
System |
:Intel Core i3,i5,i7 and 2GHz Minimum |
|
• |
Ram |
:4 GB |
|
• |
Hard Disk |
:10 GB or above |
|
• |
Input Device |
:Keyboard and Mouse |
- Output Device :Monitor or PC
C. Software Requirements
Landuage: PYTHON
Software :Visual Studio, JupyterNoteBook
Libraries :NumPy, OpenCV, Voila and ipywidgets
D. User Requirements
The requirements of the product is given as use cases below.
|
Sl.no |
Requirements |
|
|
|
|
Req.1 |
User can upload any image |
|
|
|
|
Req.2 |
The object must be detected and displayed |
|
|
|
|
Req.3 |
The layout must be drown across each frame |
|
|
|
|
Req.4 |
Output image of current image would be stored in output |
|
|
format |
|
Req.5 |
Object must be detected if there are trained for it |
|
Req.6 |
The accuracy of solution in term of number of correctly |
|
|
detected count. |
Table 3.1 User Requirements
IV. DESIGN
A. Purpose
This chapter gives an overview of the design of the proposed system. The design covers the overall architecture of the system, starting with conceptual design and details added during subsequent phases of design. The static as well as dynamic behavior of the individual entities is detailed. The implementation and testing phases of the project are influenced by this documentation. The details are expected to evolve during the entire design process.
1) Different Types of Software Design Levels
In the software engineering field software designing is a main section. Software design can be categorized into:
- Architectural Design
This is the first level of the designing. Architectural design is the greatest summarize edition of the system. This determines to the software or application as a method with more elements collaborating with each. Generally, this is a designing level where the designers obtain the idea or thought of a suggested clarification domain or province.
- High-level Design
This is the second level of the designing. The high level design splits the theory or concept single entity-multiple component into less-abstracted prospect of modules and subsystems. And also represents their cooperation with each. Basically the high level design concentrates on how the system besides its entire element can be applied as modules. High level design concept identifies modular arrangement of all subsystems and also their connection and cooperation between them.
- Detailed Design
This is the third level of the designing. This is the level where the designing deals with the accomplishment part, which will be finally seen by the system. This level of designing is more elaborated as compared to previous modules design and implementations. In this level of design we determine the logical structure of all previous modules.
Scope
The proposed system predicts the popularity of a talk show using regression analysis. Regression model is built between the variables, the dataset is split into training and test data and the accuracy is predicted. Given a new data sample, the model must be able to predict its estimated accuracy and it is compared with the test data.
B. System Architecture
Abstract design
The system architecture gives a high-level overview of the functions and responsibilities of the system. It defines the breakdown of the system into various subsystems and the individual roles played by them.
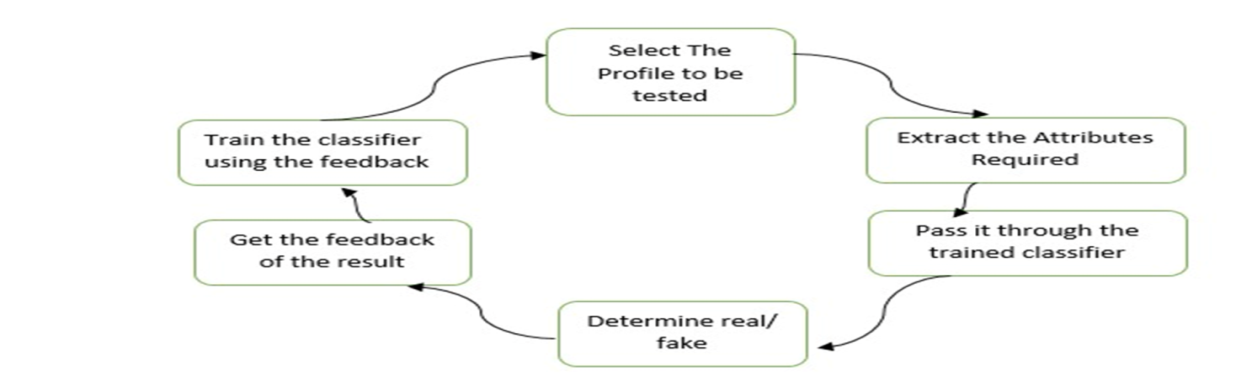
Fig. 4.1 System Architecture
2) Modules
Data Preprocessing
Real world data are generally incomplete, noisy and redundant. In order to avoid those data hasto be pre-processed. In this project the data preprocessing includes removing of the redundant attributes. One such processing is the conversion of UNIX time stamp into user readable form, seconds.
Design
The design phase briefly explains the modules contained in the project through a architectural pattern. The architecture is a system that unifies its components or elements into logical functional blocks. The architecture shows the structure of the system and modules included in system.
Implementation
Implementation is the realization of an application, or execution of plan, idea, model, design, specification, standard, algorithm, or policy. Implementation encompasses all the processes involved in getting new software or hardware operating properly in its environment, including installation, configuration, and running, testing and making necessary changes. In this project the regression model is built and tested using various test cases in order to predict the popularity of the model and its accuracy.
Body Part Map
It models visual appearance and context structure of pedestrian body parts and creates based on single pedestrian parsing model. It merges the segmentation masks of all pedestrians to create the body part map. The body part map is proposed to model the body-part semantic structures of individual pedestrians, which can serve as an important cue to judge whether there exists a person at a certain location. We introduce it into our framework as a novel supervised label to address the difficulties in crowd counting problem.
C. Use Case Model
A use case defines a goal-oriented set of interactions between external entities and the system under consideration. The external entities which interact with the system are its actors. A set of use cases describe the complete functionality of the system at a particular level of detail and it Can be graphically denoted by the use case diagram. The use case diagram of the proposed system is shown in Figure 5.2. The system broadly classifies the functionality of the system into seven different use cases.
A usecase model consists of a number of a model elements. The most important model elements are usecase, actors and the relationships between them. A use case diagram is used to graphically depict a subset of the model to simply communications. Use case diagram is one of them and its specific purpose is to gather system requirements and actors. Use case diagrams specify the events of a system and their flows. But use case diagram never describes how they are implemented.
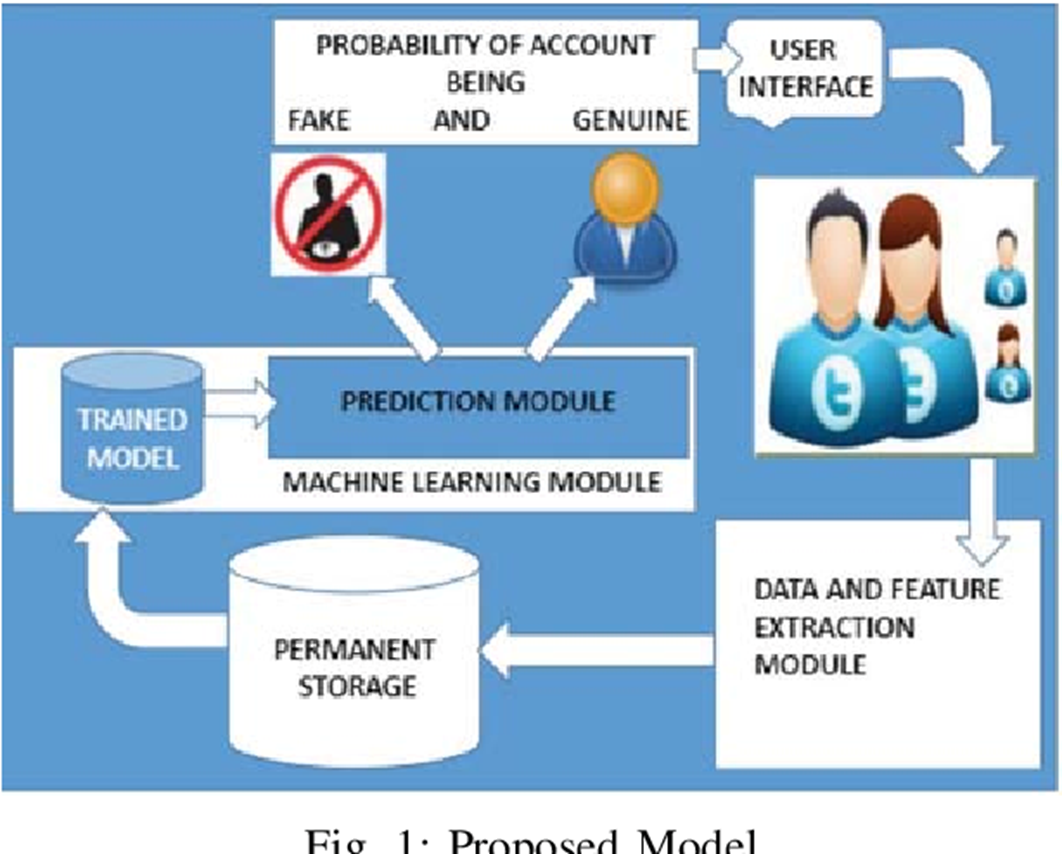
Fig. 4.2 Use Case Model
D. Sequence Diagram
The sequence model elaborates the themes of the use cases. A sequence diagram shows an interaction arranged in a time sequence in its logical order. It also shows objects participating in the behavior, and the messages that they exchange. The sequence diagram of the system under consideration is as shown in Figure 4.3.
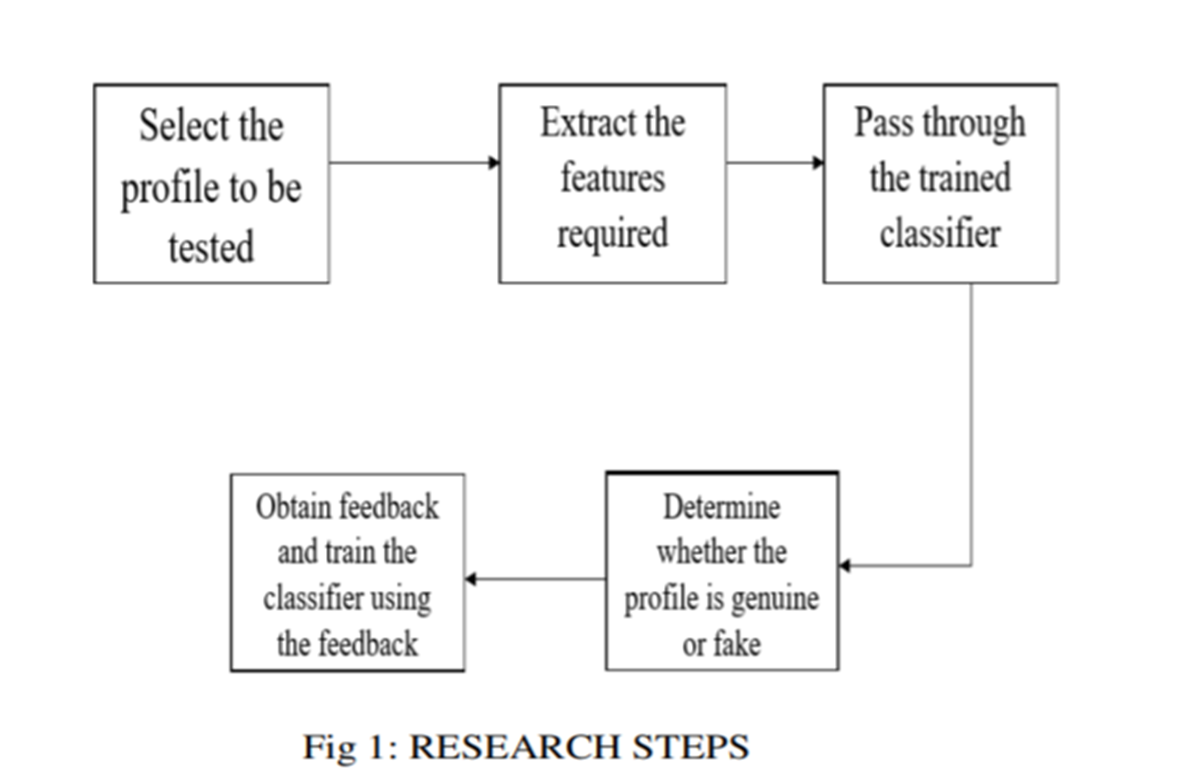
Fig .4.3 Sequence Diagram
Here at first user selects the profile which to be tested. Then, extract the feature from the selected profile and pass the extracted feature through the trained classifier. After passing it through the classifier, it determines whether the profile is genuine or fake. At last obtain the feedback and train the classifier using the feedback.
V. IMPLEMENTATION
A. Methodology
In this paper using Artificial Neural Networks we are identifying whether given account details are from genuine or fake users. ANN algorithm will be trained with all previous users fake and genuine account data and then whenever we gave new test data then that ANN train model will be applied on new test data to identify whether given new account details are from genuine or fake users.
Online social networks such as Facebook or Twitter contains users details and some malicious users will hack social network database to steal or breach users information, To protect users data we are using ANN Algorithm.
To train ANN algorithm we are using below details from social networks
1) Account_Age, Gender, User_Age, Link_Desc, Status_Count, Friend_Count, Location, Location_IP, Status
All fake users main intention is to send friend request to normal users to hack their machine or to steal their data and never they will have many number of posts or have many following friends and their account age also will have less number of years. By analysing this features Facebook will mark whether user profile is fake or genuine. This Facebook profile data we downloaded from Facebook website and using this data to train ANN model. Below are some values from profile dataset.
2) Account_Age, Gender, User_Age, Link_Desc, Status_Count, Friend_Count, Location, Location_IP, Status
10, 1, 22, 0, 1073, 237, 0, 0, 0
10, 0, 33, 0, 127, 152, 0, 0, 0
10, 1, 46, 0, 1601, 405, 0, 0, 0
7, 1, 34, 1, 64, 721, 1, 1, 1
7, 1, 30, 1, 69, 587, 1, 1, 1
7, 1, 52, 1, 96, 827, 1, 1, 1
In above dataset all bold names are the dataset column names and all integer values are the dataset values. As ANN will not take string value so we convert gender values to 0 or 1, if male value is 1 and if female value is 0. In above dataset last column give us information of fake or genuine account if last column contains value 0 then account is genuine otherwise fake. All fake account will have less number of posts as their main intention is to send friend requests not posts, so by analysing this features Facebook mark that record with value 1 which means it’s a fake account. We are using above dataset to train ANN model and this dataset saved inside code ‘dataset’ folder. After building train model we input test data with account details and ANN will give result as fake or genuine. Below are some values from test data
3) Account_Age, Gender, User_Age, Link_Desc, Status_Count, Friend_Count, Location, Location_IP
10, 1, 44, 0, 280, 1273, 0, 0
10, 0, 54, 0, 5237, 241, 0, 0
7, 0, 42, 1, 57, 631, 1, 1
7, 1, 56, 1, 66, 623, 1, 1
In above test data STATUS column and its value is there and ANN will predict status and give us result whether above test data is fake or genuine. In output we can see result of above test data.
References
[1] ”Detection of Fake Twitter accounts with Machine Learning Algorithms” Ilhanaydin,Mehmetsevi, Mehmet umutsalur. [2] ”Detection of fake profile in online social networks using Machine Learning” Namansingh, Tusharsharma, AbhaThakral, Tanupriya Choudhury. [3] ”Detecting Fake accounts on Social Media” Sarah Khaled, Neamat el tazi, Hoda M.O. Mokhtar. [4] ”Twitter fake account detection”, BuketErsahin, OzlemAktas, Denizkilinc, CeyhunAkyol. [5] ”a new heuristic of the decision tree induction” ning li, li zhao, ai-xiachen, qing-wumeng, guo-fang zhang. [6] ”statistical machine learning used in integrated anti-spam system” peng-feizhang, yu-jiesu, congwang. [7] ” a study and application on machine learning of artificial intellligence” mingxue, changjunzhu. [8] ”learning-based road crack detection using gradient boost decision tree” peng sheng, li chen, jingtian. [9] ”verifying the value and veracity of extreme gradient boosted decision trees on a variety of datasets” adityagupta, kunalgusain, bhavyapopli. [10] ” fake account identification in social networks” loredanacaruccio, domenicodesiato, giuseppepolese.
Copyright
Copyright © 2025 Mr. Saroj Subedi. This is an open access article distributed under the Creative Commons Attribution License, which permits unrestricted use, distribution, and reproduction in any medium, provided the original work is properly cited.

Download Paper
Paper Id : IJRASET66738
Publish Date : 2025-01-29
ISSN : 2321-9653
Publisher Name : IJRASET
DOI Link : Click Here
 Submit Paper Online