

Ijraset Journal For Research in Applied Science and Engineering Technology
Statistical Analysis for Storage Utilization Forecasting
Authors: Bala kishore Gonga, Masthan Babu Padarthi, Indrani Chuppala
DOI Link: https://doi.org/10.22214/ijraset.2025.66803
Certificate: View Certificate
Abstract
Sonatype Nexus is a robust repository management tool commonly utilized in DevOps and CI/CD workflows. It facilitates the efficient management, storage, and retrieval of binary artifacts. Nexus is integral to software development, offering centralized storage and organization for build artifacts, dependencies, and containers, thereby enhancing team collaboration and ensuring control over the software supply chain. On a daily operational basis, various artifacts are uploaded across multiple repositories in each Nexus instance. It is the administrator’s duty to free up space whenever it exceeds a certain threshold. Failing to do so may result in server shutdowns, negatively impacting business operations. While the administrator can utilize automated tasks from Nexus, these have certain constraints, especially when it comes to deleting specific artifacts. This poses a challenge when valuable artifacts occupy a significant portion of space, causing a reduction in available storage without clear indication of when the server will fail. This paper addresses the issue by applying a machine learning model, specifically Linear Regression, to analyze space usage patterns. The regression model will derive an equation based on existing data, enabling predictions of future space consumption and offering a proactive solution to manage server capacity.
Introduction
I. INTRODUCTION
Nexus Repository serves as a centralized platform designed to organize and handle software artifacts [1], such as libraries, packages, and dependencies, in different formats. It functions as a universal repository manager that supports formats including Maven, npm, NuGet, Docker [2], and others, enabling teams to store, retrieve, and exchange these artifacts throughout the software development lifecycle. Nexus [3] stores build artifacts like JAR files, Docker images, and more, making them available to development and deployment pipelines.
It can also proxy external repositories (e.g., Maven Central) and locally cache dependencies, thus optimizing build times and minimizing network traffic. Nexus allows teams to manage multiple versions of artifacts with consistent versioning policies. Additionally, it can operate as a private Docker registry [4], ensuring secure management and storage of container images for containerized applications. Nexus integrates smoothly with continuous integration and continuous deployment tools such as Jenkins [5] and Bamboo, automating the process of retrieving and publishing build artifacts.
It provides detailed role-based access control (RBAC) and can scan repositories for security vulnerabilities, ensuring adherence to security protocols. Nexus is widely adopted in DevOps pipelines for managing dependencies [6], storing build outputs, and maintaining a secure software supply chain. Each business unit has its own Nexus instance, and users begin uploading artifacts to the relevant repositories. These repositories are categorized as snapshot and release repositories. Artifacts for non-production environments are stored as snapshot artifacts, while production artifacts are stored as release artifacts. ReactJS and NodeJS artifacts are stored in npm-hosted repositories.
II. LITERATURE REVIEW
Nexus instances are linked to a load balancer, as depicted in Figure 1. Various client types are supported for interacting with the Nexus Repository Manager (NXRM).
In response to the development team's request, the NXRM administrator [7] will set up hosted repositories according to the specific delivery types. For Java development, hosted repositories such as SNAPSHOT and RELEASE will be established, while for Node.js development, npm repositories will be configured. Docker registries will be created to facilitate the uploading of Docker images.
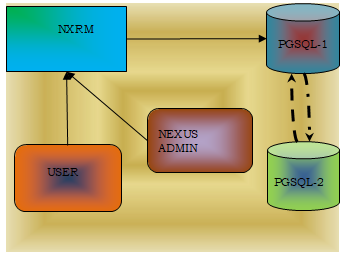
Fig: 1 Sonatype Nexus Repository Management Architecture diagram
Figure 1 illustrates the architecture of Sonatype Nexus Repository Management. Users interact with the NXRM tool to upload or download artifacts. The data is stored in a PostgreSQL database [8], with two instances of PostgreSQL configured for periodic backups. The NXRM administrator is responsible for granting access to the appropriate users. In cases where multiple users require access to the same repository, the administrator creates Active Directory (AD) Groups, adding users to the relevant groups instead of assigning repository access to individual users. Permissions are then assigned to these AD groups [9]. For the Java development team, artifact files are typically created as JAR files. These are uploaded to either the snapshot or release repository depending on the artifact’s version. A fixed version will be directed to the release repository, whereas a snapshot version will go to the snapshot repository. In the case of web development, npm packages are created and uploaded to the hosted npm repository [10]. For .NET development, the corresponding packages are uploaded to the NuGet repository, and Docker images are stored in the Docker registry.
On daily basis artifacts from the different deveopers will be uploaded to corresponding repositories[11]. The access has been given by the NXRM admin team to work with the uploads. We can not re upload if it is NON SNAPSHOT artifact. If it is SNAPSHOT version it will be re uploaded.
In a development environment, code typically undergoes frequent revisions, so it's not possible to finalize the artifact in the initial development cycles. For each completed cycle or delivery, the artifact is uploaded. To accommodate this, we use the SNAPSHOT [12] version (e.g., 1.0.0-SNAPSHOT), which appends a timestamp to the artifact name each time it’s uploaded. For instance, if the artifact is generated on 10/17/2024 at 21:03, the resulting artifact name would be abc-1.0.0-171020242103. In this example, 'abc' represents the artifact’s name. If the same artifact is built again just five minutes later, the new artifact name would be 1.0.0-171020242603, with the timestamp reflecting the updated time. This process ensures that each build generates a unique artifact name. Therefore, rebuilds occur without any issues. A snapshot repository supports this rebuild process. However, it's technically incorrect to say we're uploading the same artifact each time, as each upload results in a distinct artifact with a different timestamp.
After all development cycles in the environment have been completed and it's determined that the build is functioning as expected, the artifact version can be updated to a fixed version. At this point, the artifact’s version is no longer tied to the date or timestamp. For example, the artifact name will simply be abc-1.0.0 without any timestamp appended. In this case, re-uploading the artifact is not permitted unless the option to allow re-uploads is explicitly enabled. For the subsequent release, the artifact name will increment to abc-1.0.1, which will be derived from the earlier SNAPSHOT version, such as abc-1.0.1-SNAPSHOT [13].
Each team maintains its own repositories within the Nexus instance. For example, if Team A needs to access artifacts from Team B, they can configure the repositories in the Maven settings.xml [14] file. This allows Maven to scan the repositories based on the dependencies specified in the pom.xml file. To use an artifact, the groupId, artifactId, and version must be specified in the pom.xml. If the artifact is hosted internally, it will be fetched from the repositories listed in the settings.xml file. However, if the artifact is hosted externally, Maven will generate an error unless the correct external repository location is specified in the settings.xml [15]. External URLs should be configured as proxies within this file.
Maven will first check the local cache for the artifact. If it’s not found locally, Maven will then search the internal organizational repositories. If the artifact is not available internally, it will attempt to retrieve it from the external proxies. Once Maven successfully locates the artifact whether from the local cache, internal repositories, or external proxies—it will download it to the local cache for future use, ensuring it's available for subsequent builds.
Consider the scenario where the current artifact is named 'nexus.' When creating a development branch in GitHub, the version is set as nexus-1.0.0-SNAPSHOT. This version is uploaded to the Nexus SNAPSHOT repository as nexus-1.0.0-171020241136. If a subsequent build is triggered, the artifact name will change to nexus-1.0.0-171020241138 (2 minutes after the previous build). After completing all development cycles, if the version is finalized by removing the '-SNAPSHOT' suffix, the artifact will be named nexus-1.0.0 and uploaded to the releases repository. Once this artifact is available, anyone in the organization referencing its GAV [16] (GroupId, ArtifactId, Version) will be able to download it locally from the Nexus release repository. For the next cycle, a new GitHub branch will be created with the version nexus-1.0.1-SNAPSHOT. Each new development build will generate time-stamped artifacts such as nexus-1.0.1-171020241142, nexus-1.0.1-171020241145, and so on. Finally, the release version nexus-1.0.1 will be created during the release build and uploaded to the Nexus release repository. Any of these versions can be referenced in the pom.xml file using the appropriate GAV parameters.
Nexus can serve as a private repository for Docker images, enabling secure storage and management of containerized applications. To do this, a Docker registry [17] must be set up within the Nexus instance, similar to how snapshot and release repositories are created. After configuring the registry, users can log in through the terminal and begin pushing Docker images to it. These images can later be pulled from the registry to the local environment as needed for deployment purposes.
N Nexus works effortlessly with continuous integration [18] and continuous deployment tools like Jenkins and Bamboo, automating the process of fetching and publishing build artifacts. When the build process begins by pulling the GitHub code to the local environment, the artifact is generated. This artifact must then be uploaded to the Nexus repository via the Nexus plugin, which is already integrated into Jenkins. Authentication is required using Nexus credentials. Once the development team commits the code, it automatically triggers the build job, causing the code to be checked out within Jenkins (CI/CD tool). Upon successful completion of the build, the artifact is created based on the specifications in the pom.xml file, which may result in a JAR, WAR, or ZIP file.
The artifact is initially saved in the local cache on the machine where the build runs. In the next stage, the artifact is uploaded to the Nexus repository. If the artifact is a snapshot version, it is pushed to the snapshot repository; if it’s a release version, it is uploaded to the release repository. This process can also be applied to npm packages or Docker images. Once a Docker image is created, it will be pushed to the Docker registry hosted within Nexus. For a detailed view of the entire process, from code commit to artifact upload to the NXRM repository, please refer to Figure 2.
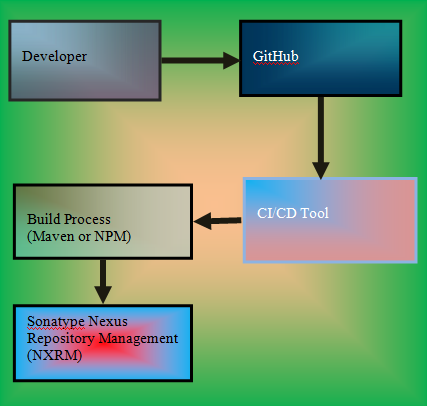
Fig 2: CI/CD Pipeline Integration
Administrator credentials are required for setting up and configuring the NXRM instance. After completing the configuration, we will be prompted to update the credentials by entering the password in an encrypted format. We can use our own credentials for this purpose. Additionally, we have the option to integrate the Linear Data Access Protocol (LDAP) [19] with the NXRM instance, enabling us to incorporate Active Directory (AD) Groups into the setup. A separate AD Group will be created for each project team and added to the instance. This integration simplifies user management, allowing us to easily add or remove members from the AD Groups.
|
SNo |
System IP |
Time Stamp |
Operation |
URL |
Size |
Status |
|
1 |
10.0.* |
100924 |
PUT |
url |
150 |
success |
|
2 |
10.1.* |
110924 |
DEL |
url |
200 |
success |
|
3 |
10.2.* |
120924 |
GET |
url |
250 |
success |
|
4 |
10.4.* |
130924 |
PUT |
url |
300 |
success |
|
5 |
10.3.* |
140924 |
GET |
url |
350 |
success |
|
6 |
10.6.* |
150924 |
PUT |
url |
400 |
success |
|
7 |
10.5.* |
160924 |
DEL |
url |
450 |
success |
|
8 |
10.4.* |
160924 |
GET |
url |
500 |
success |
Table 1. Nexus Repository log file entries.
Table 1 presents various metrics for a number of repositories, including the repository name, timestamp, repository subgroup, the type of operation (GET, PUT, or DELETE) [20], upload volume, and the success or failure of the upload. The metrics should be categorized based on the operation type. Of these operations, only the PUT operation has a direct impact on disk space. It is important to calculate the total volume of uploads for daily, weekly, and monthly analysis [21]. For instance, we have selected sample data for the PUT operation across different subgroups of the repository. These details are shown in Table 2. Please note that the values in Table 1 may not correspond to those in Table 2.
|
subgroup |
URL |
Time Stamp |
Size (Gb) |
Operation |
Status |
|
Sb1 |
url1 |
100924 |
5 |
PUT |
success |
|
Sb2 |
url2 |
120924 |
6 |
PUT |
success |
|
Sb3 |
url3 |
130924 |
10 |
PUT |
success |
|
Sb4 |
url4 |
140924 |
3 |
PUT |
success |
|
Sb5 |
url5 |
150924 |
4 |
PUT |
success |
|
Sb6 |
url6 |
160924 |
8 |
PUT |
success |
|
Sb7 |
url7 |
170924 |
10 |
PUT |
success |
|
Sb8 |
url8 |
180924 |
4 |
PUT |
success |
Table 2: Business unit vs Upload operations
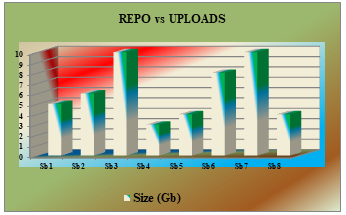
Graph 1: Business unit vs Upload operations
Please monitor the usage of space on a daily, weekly, and monthly basis. Unnecessary artifacts, such as snapshots and outdated fixed version files, should be manually removed. If these artifacts are not deleted, new uploads will fail, potentially disrupting the work of many developers. The administrator must either remove these files manually, use the administrative tasks available within NXRM, or collaborate with the development team to identify and delete the redundant artifacts. The amount of space recovered by deleting unwanted files should align with the volume of uploads to the NXRM repositories. Since the NXRM instance is shared across multiple business units, some of which may have high-volume usage while others have low-volume usage, we face two options: provide a dedicated instance for high-volume users or require them to submit lists of unnecessary artifacts frequently, so the administrator can delete them to free up space for ongoing activities. Failure to take either of these actions could result in upload failures for other business units, even if they consume much less storage.
Although we may have ample storage at the start of the NXRM operations, eventually we will need to address any issues related to space management. Rather than relying on manual intervention, which is highly time-consuming, predicting usage patterns based on daily, weekly, and monthly analysis would make it easier to estimate the required space for future activities. If we can anticipate in advance that available storage will only last for a limited period, we can take proactive measures, such as notifying developers to clean up unnecessary artifacts or expanding the disk capacity.
By following this approach, we can prevent disruptions like NXRM becoming unavailable for operations. This strategy would save a significant amount of man hours for the development team. For example, if 20 members in a single team are working, and 10 to 15 teams depend on the same NXRM, we could save 2400 man hours daily. Without such predictive analysis, any unexpected issues would lead to a waste of valuable man hours. The table below outlines the man hours saved through this approach.
|
SNo |
Num of developers |
Hours |
Hours Saved |
|
1 |
10 |
80 |
80 |
|
2 |
20 |
160 |
160 |
|
3 |
30 |
240 |
240 |
|
4 |
40 |
320 |
320 |
Table 3: Number of developers vs Man hours
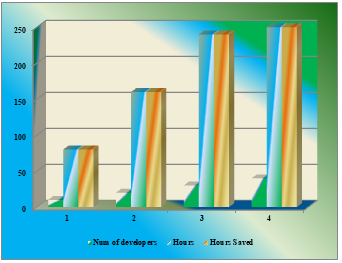
Graph 2: Number of developers vs Man hours
Graph 2 shows that number of hours saved by the developers once we get any solution to avoid abnormal incidents. What ever the man hours available in each team , 100% savings we can observe.
III. PROPOSAL METHOD
A. Problem Statement
Excessive space usage due to numerous uploads can result in unexpected issues with the NXRM instance. Rather than waiting until the disk is full and encountering these problems, forecasting space usage on a daily, weekly, or monthly basis allows us to proactively manage disk space. This approach will help prevent disruptions and save valuable man hours.
B. Proposal
A machine learning algorithm will be utilized to forecast space usage by analyzing historical data on space consumption. To do this, we need to examine log files from the past year to identify both dependent and independent variables (Feature Engineering). NXRM log files contain information such as repository URLs, timestamps, operation types, operation status, upload sizes, and the time taken to complete each upload. Using data analysis tools like Python’s Pandas and NumPy, we can extract the repository name from the URL that the development team used when uploading artifacts to the Nexus Repository Manager. This analysis will yield the repository name, timestamp, artifact size, operation type, and the time spent on the corresponding task.
In the next phase of the analysis, we will filter the data by operation type, specifically focusing on the PUT operation (upload operation). We will apply this filtering process to gather data for the entire month for each repository. For example, repositories such as TCT, RFR, CFC, PRD, GST, TGB, and SCY each represent a different business unit, with multiple users in each unit uploading artifacts to the NXRM repository. The analysis will be organized by repository and then broken down on a monthly basis for each business unit. Please refer to Table 4 for a detailed breakdown of the analysis we’ve described.
|
SNo |
URL |
Name |
Activity |
Size(Gb) |
Status |
|
1 |
UI |
PUT |
4 |
Success |
|
|
2 |
Back |
GET |
NA |
Success |
|
|
3 |
Middle |
DEL |
NA |
Success |
|
|
4 |
UI |
GET |
NA |
Success |
|
|
5 |
Back |
GET |
NA |
Success |
|
|
6 |
UI |
GET |
NA |
Success |
|
|
7 |
Middle |
PUT |
6 |
Success |
Table 4: Nexus log file data attributes and values
Within the TCT business unit, various repositories such as UI, Middle, and Backend have been set up. The primary issue that TCT is facing is a lack of available space. To address this, we’ve begun analyzing the repository names, operation types, timestamps, and artifact sizes for uploads. We will compile the total volume uploaded to each repository on a monthly basis. This will provide a comprehensive view of the space usage for the entire business unit, taking into account all its repositories (UI, Middle, and Backend).
IV. IMPLEMENTATION
We have utilized Python libraries such as NumPy, Pandas, and Scikit-learn to perform data analysis. The data has been gathered on a daily, weekly, and monthly basis to assess usage patterns. This analysis helps estimate the space needed to run the NXRM instance without encountering unexpected issues.
Once we have historical usage data for each business unit on a monthly scale, we can apply this data in a machine learning model to forecast future requirements. The same approach is used across all business units, where we perform feature engineering to identify relevant parameters for input into the machine learning algorithm (using techniques like Linear Regression). This model will predict the dependent variable, where time serves as the independent variable and the total size of artifacts (representing the space consumed by all artifacts within a business unit in a given month) is the dependent variable.
|
SNo |
Repo Name |
Volume (GB) |
|
1 |
Repo1 |
40 |
|
2 |
Repo2 |
50 |
|
3 |
Repo3 |
79 |
|
4 |
Repo4 |
54 |
|
5 |
Repo5 |
87 |
|
6 |
Repo6 |
98 |
|
7 |
Repo7 |
120 |
Table 5: Repo vs Volume consumption
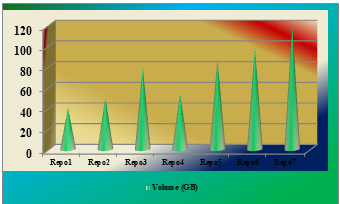
Graph 3: Repo vs Volume consumption
Graph 3 illustrates the space usage for each repository (Repo1 → R1, Repo2 → R2, Repo3 → R3, Repo4 → R4, Repo5 → R5, Repo6 → R6, and Repo7 → R7). The usage data for all repositories within a single business unit is shown on a monthly basis. We need to aggregate the total space consumed by the business unit within one month. For the analysis, we have collected daily usage data over a 12-day period, which will allow us to forecast the space requirements for the next several days. Below is the table showing the data for the first 12 days of October.
|
SNo |
Day |
Total space consumption (Gb) |
|
1 |
1 |
12 |
|
2 |
2 |
14 |
|
3 |
3 |
16 |
|
4 |
4 |
18 |
|
5 |
5 |
21 |
|
6 |
6 |
27 |
|
7 |
7 |
27 |
|
8 |
8 |
29 |
|
9 |
9 |
36 |
|
10 |
10 |
39 |
|
11 |
11 |
42 |
|
12 |
12 |
55 |
Table 6: Space consumption on daily basis
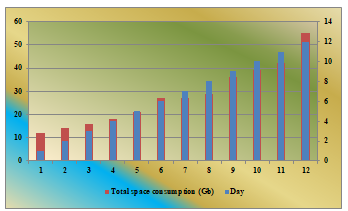
Graph 4: Day vs Volume consumption
Calculating the Slope (m) and Intercept (b):
To compute the values of m and b, we use the least squares method [18], which minimizes the sum of the squared differences between the actual and predicted values. The formulas for the slope (m) and intercept (b) are
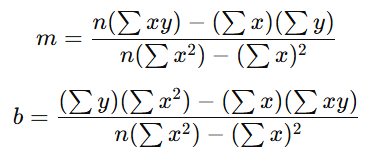
Let 'n' represent the total number of data points (in this case, days). The term ∑xy refers to the sum of the products of corresponding x and y values, ∑x is the sum of all x values, ∑y is the sum of all y values, and ∑x² is the sum of the squares of all x values. Using the space consumption data across several months (with months represented numerically), we computed the coefficients m = 3.50 and b = 5.27. Therefore, the final linear regression equation [19] for predicting space usage is y = 3.50x + 5.27. For example, when x = 1, the predicted y value is 8.77GB, and for x = 2, y is 12.7GB. This equation allows us to forecast future space requirements based on historical trends.
Figure 3 illustrates both the actual and predicted daily volume usage values derived from the regression model.
|
SNo |
Day |
Total space consumption (Gb) |
Predcicted Space consumption |
|
1 |
1 |
12 |
8.769 |
|
2 |
2 |
14 |
12.265 |
|
3 |
3 |
16 |
15.762 |
|
4 |
4 |
18 |
19.258 |
|
5 |
5 |
21 |
22.795 |
|
6 |
6 |
27 |
26.251 |
|
7 |
7 |
27 |
29.748 |
|
8 |
8 |
29 |
33.244 |
|
9 |
9 |
36 |
36.741 |
|
10 |
10 |
39 |
40.237 |
|
11 |
11 |
42 |
43.734 |
|
12 |
12 |
55 |
49.23 |
Table 7: Actual vs Predected values
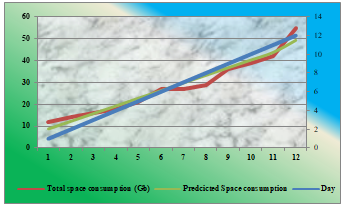
Graph 5: Actual vs Predected values
As per the values from the Table 7 , the predicted values are near by actual values. The difference between actual and predicted values are called residual points. Since the difference actual and predicted values is not having much with these values.
Conclusion
The NXRM instance has been experiencing space-related issues. To prevent unexpected disruptions, we have implemented linear regression analysis to forecast the space requirements for upcoming days. With this predictive model, we can take proactive steps, such as collaborating with the development team to identify and remove unnecessary artifacts, thereby freeing up space. If the forecast indicates that space will not be sufficient, we can request additional storage to prevent potential disruptions in the NXRM instance. Without such analysis, we would only be aware of the issue when the system crashes. By implementing this analysis, we save a significant amount of man hours. There are several strategies available, such as working with the development team to remove unwanted artifacts or scheduling cron jobs through admin tasks. However, these methods will only be effective as long as the volume of new business and artifact uploads remains manageable. If the number of artifacts being uploaded consistently exceeds the rate at which they are removed, we will eventually need to add more disk space to avoid system performance issues. Otherwise, we risk facing a scenario where the system becomes unresponsive, leading developers to seek urgent help, which may not be possible to address quickly. To prevent such situations, the approach we have proposed will be highly beneficial. Looking ahead, future work will focus on extending the analysis to include two independent variables. In this paper, we have considered time as the independent variable, with volume as the dependent variable, which is known as univariate linear regression. However, incorporating additional factors, such as the number of users, into the analysis could further enhance our ability to prevent future disruptions.
References
[1] Apache Maven cookbook by RaghuRam Barathan. [2] UNI VARIATE LINEAR REGRESSION ANALYSIS FOR SONATYPE NEXUS REPOSITORY SPACE MANAGEMENT , Renukadevi Chuppala, Dr. B.Purnachandra Rao , International Journal of Applied Engineering & Technology , Roman Science Publications Ins. Vol. 5 No.1, January, 2023 [3] Kubernetes Ip-Tables Performance Using Trie Tree And Radix Tree Implementation, Renukadevi Chuppala , Dr. B. PurnachandraRao, International Journal for Multidisciplinary Research (IJFMR) E-ISSN: 2582-2160, Volume 5, Issue 2, March-April 2023 [4] Kubernetes IP Hash Set For Managing Addresses in IP-Tables, Renukadevi Chuppala , Dr. B. Purnachandra Rao, International Journal of Innovative Research and Creative Technology 2023 IJIRCT ISSN: 2454-5988 Volume 9 Issue 5. [5] Kubernetes Etcd Implementation Using Btree and Fractal Trees ,Renukadevi Chuppala, Dr. B. PurnachandraRao. International Journal of Innovative Research in Engineering & Multidisciplinary Physical Sciences, IJIRMPS | ISSN: 2349-7300 , Volume 12 Issue 1 , January - February 2024 [6] Log Structured Hash Table Tree For Efficient CPU Utilization In ETCD, Renukadevi Chuppala ,Dr.B.PurnachandraRao, International Journal of Leading Research Publication (IJLRP) E-ISSN: 2582-8010, Volume 5, Issue 6, June 2024 [7] Adelson-Velsky Landis and Log Structured Merge Tree for Kubernetes ETCD , Renukadevi Chuppala , Dr. B. Purnachandra Rao, Advanced International Journal of Multidisciplinary Research E-ISSN: 2584-048, Volume 2, Issue 5, September-October 2024 [8] Hadoop Distributed File System Write Operations , Renukadevi Chuppala , Dr. B. Purnachandra Rao, International Journal of Intelligent Systems and Applications in Engineering IJISAE, 2024, 12(23s), 720–731 [9] Kubernetes Ip-Tables Time Complexity Using Trie Tree And Radix Tree Implementation , Kishore Kumar Jinka, Dr.B.Purnachandra Rao , International Journal of Applied Engineering & Technology, ISSN: 2633-4828 , Volume 5, Issue 2, June 2023 [10] Kubernetes IP Hash Set For Enhanced CPU Utilization , Kishore Kumar Jinka, Dr.B.Purnachandra Rao, International Journal for Multidisciplinary Research, E-ISSN: 2582-2160 , Volume 2, Issue 5, September-October 2023 [11] Btree And Fractal Tree For Kubernetes ETCD Implementation , Kishore Kumar Jinka, Dr.B.Purnachandra Rao, International Journal of Innovative Research and Creative Technology, E-ISSN: 2454-5988 , Volume 10, Issue 1, January 2024 [12] Kubernetes Ip-Tables Time Complexity Using Trie Tree And Radix Tree Implementation, Kishore Kumar Jinka, Dr.B.Purnachandra Rao, International Journal of Applied Engineering & Technology, ISSN: 2633-4828, Volume 5, Issue 2, June 2023 [13] Kubernetes IP Hash Set For Enhanced CPU Utilization, Kishore Kumar Jinka, Dr.B.Purnachandra Rao , International Journal for Multidisciplinary Research, E-ISSN: 2582-2160, Volume 2, Issue 5, September-October 2023 [14] Btree And Fractal Tree For Kubernetes ETCD Implementation, Kishore Kumar Jinka, Dr.B.Purnachandra Rao, International Journal of Innovative Research and Creative Technology, E-ISSN: 2454-5988, Volume 10, Issue 1, January 2024 [15] ETCD Implementation Using Log Structured Merge Tree To Improve CPU Utilization, Kishore Kumar Jinka, Dr.B.Purnachandra Rao, International Journal of Innovative Research in Engineering & Multidisciplinary Physical Sciences, E-ISSN: 2349-7300, Volume 12, Issue3, May-June 2024 [16] Multi Variate Linear Regression Analysis ForSonatype Nexus Repository Space Management, Kishore Kumar Jinka, Dr.B.Purnachandra Rao, International Journal of Intelligent Systems and Applications in Engineering, ISSN: 2147-6799, Volume 12, Issue 23S, August 2024, [17] Log Structured Merge Tree and Log Structured Hash Table Tree for Kubernetes ETCD, Kishore Kumar Jinka, Dr.B.Purnachandra Rao, International Journal of Multidisciplinary Research, E-ISSN: 2584-0487, Volume 2, Issue 5, September-October 2024 [18] Kubernetes IP-Tables Bitmap Compaction Using Regular And Irregular Intervals , Kishore Kumar Jinka, Dr.B.Purnachandra Rao October-2024 , Beyond Intelligence: AI for a Changing Planet/ Beijing, China International Conference, [19] One Dimensional Regression Analysis For Disk Space Management , Kishore Kumar Jinka, Dr.B.Purnachandra Rao, November-2024 LASMCER - Latest Advancements in Science, Management, Commerce, and Educational Research [20] Multi Variate Linear Regression Analysis For Sonatype Nexus Repository Space Management , Kishore Kumar Jinka, Dr.B.Purnachandra Rao , International Journal of Intelligent Systems and Applications in Engineering, ISSN: 2147-6799, Volume 12, Issue 23S, August 2024 [21] Log Structured Merge Tree and Log Structured Hash Table Tree for Kubernetes ETCD, Kishore Kumar Jinka, Dr.B.Purnachandra Rao , International Journal of Multidisciplinary Research, E-ISSN: 2584-0487, Volume 2, Issue 5, September-October 2024.
Copyright
Copyright © 2025 Bala kishore Gonga, Masthan Babu Padarthi, Indrani Chuppala. This is an open access article distributed under the Creative Commons Attribution License, which permits unrestricted use, distribution, and reproduction in any medium, provided the original work is properly cited.

Download Paper
Paper Id : IJRASET66803
Publish Date : 2025-02-02
ISSN : 2321-9653
Publisher Name : IJRASET
DOI Link : Click Here
 Submit Paper Online