Ijraset Journal For Research in Applied Science and Engineering Technology
- Home / Ijraset
- On This Page
- Abstract
- Introduction
- Conclusion
- References
- Copyright
Moment Curvature and P-M Interaction Analysis of Steel and GFRP Reinforced Concrete Column
Authors: Olipilli Dinesh Kumar, Ms. M. Durga, Rahul Kumar Singh, Nageswara Rao Pasupuleti
DOI Link: https://doi.org/10.22214/ijraset.2024.64501
Certificate: View Certificate
Abstract
This research explores the use of Glass Fiber Reinforced Polymer (GFRP) bars and GFRP circular sections as longitudinal reinforcement in Reinforced Concrete (RC) columns, specifically to mitigate corrosion issues in harsh coastal environments. Twelve concrete specimens were prepared and tested under various loading conditions to evaluate the performance of GFRP as a substitute for conventional steel reinforcement. The experimental findings indicated that GFRP-RC columns displayed slightly lower axial load and bending moment capacities compared to steel-RC columns, though the ductility of both types was found to be similar. The study also highlights the significance of considering the role of GFRP bars in compression, supported by experimental results. This research offers valuable insights into the behavior and performance of both steel and GFRP-reinforced concrete columns, particularly in environments vulnerable to corrosion, with assessments conducted at 28 and 60-day intervals. A comparison of the outcomes from these timeframes reveals the effectiveness of GFRP as a reinforcement option in corrosive conditions. The findings contribute to ongoing efforts to develop sustainable construction materials and offer essential guidance for engineers and researchers focused on creating environmentally friendly, structurally reliable concrete solutions.
Introduction
I. INTRODUCTION
Reinforced Concrete (RC) columns play a vital role in building construction by providing structural support and stability. Traditionally, steel has been the primary material for reinforcing these columns due to its strength and flexibility. However, with advancements in material science, Glass Fiber Reinforced Polymer (GFRP) is now being explored as an alternative or supplementary reinforcement to steel.
GFRP, which is composed of glass fibers combined with a polymer matrix, offers distinct properties that can enhance the performance of RC columns. Using both steel and GFRP together aims to increase the strength and durability of the columns, while also addressing issues such as corrosion.
This study focuses on evaluating the behavior of RC columns reinforced with a combination of steel and GFRP under various load conditions. The objective is to determine the potential benefits of this hybrid reinforcement approach, including improved load-bearing capacity, increased flexibility, and enhanced resistance to corrosive environments.
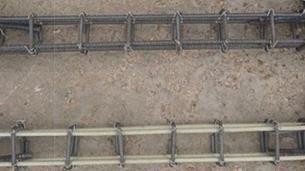
Figure 1 Reinforcement specimen
II. MATERIAL PROPERTIES AND COMPATIBILITY
The combined use of steel and Glass Fiber Reinforced Polymer (GFRP) in Reinforced Concrete (RC) columns enhances structural performance. Steel is well-known for its high strength and flexibility, which allows it to withstand dynamic loads and forces effectively, preventing sudden failures and ensuring that structures respond safely to applied stress.
GFRP, composed of glass fibers embedded in a polymer matrix, offers distinct advantages. Unlike steel, it does not corrode, making it ideal for use in harsh and corrosive environments. Additionally, GFRP is much lighter than steel, which simplifies handling during construction and reduces the overall weight of the structure. This weight reduction is particularly beneficial in earthquake-prone areas or when retrofitting older buildings. However, integrating steel and GFRP requires meticulous design considerations to ensure their compatibility. Precautions must be taken to prevent galvanic corrosion, which can occur when dissimilar materials come into contact. Additionally, the varying mechanical properties of steel and GFRP, such as differences in flexibility and thermal expansion, need to be carefully managed to maintain structural integrity under load.
Steel’s susceptibility to rust, especially in coastal areas, presents a significant maintenance challenge. Repairing corroded steel in concrete structures is often costly. While epoxy-coated steel bars are used to combat rust, they can weaken the bond between steel and concrete. Fiber Reinforced Polymer (FRP) bars, made from glass or carbon fibers embedded in a resin matrix, offer a promising alternative. These FRP bars are resistant to corrosion, lightweight, and possess high strength, making them ideal for demanding environments. They also provide a durable and cost-effective solution for creating long-lasting concrete structures.
A. GFRP Reinforced
GFRP stands for Glass Fiber Reinforced Plastic, and it refers to a composite material made by reinforcing a polymer matrix with glass fibers. This type of composite material combines the strength and stiffness of glass fibers with the lightweight and corrosion-resistant properties of the polymer matrix. GFRP is commonly used in various industries for applications where a combination of strength, low weight, and resistance to corrosion is desirable.
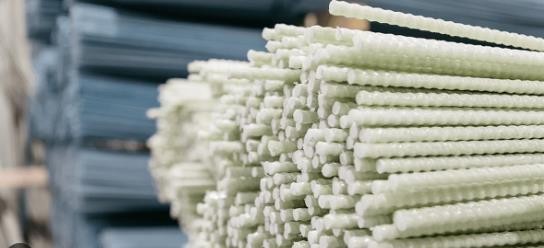
Figure 2 Steel Bars
III. MOMENT-CURVATURE
The moment-curvature diagram is a graph that shows how the bending resistance (moment) of a section changes with its curvature (bending). This is particularly important for columns and beams. For columns, this relationship is defined for a specific axial compressive load. The moment of resistance is created by the compressive and tensile stresses within the column. Curvature, measured in radians, is the angle between the axis of the beam or column and the position of the cross-section based on the expected strain in the outer fibers.
This moment-curvature relationship is crucial for both nonlinear static and dynamic analyses, especially under earthquake loads, where RC columns are key components in RC structures. The diagram helps us understand how the reinforced concrete column deforms under load, showing the ductile behavior of the structural member and aiding in the design of earthquake-resistant columns.
Studies, both experimental and analytical, have been done to examine the moment-curvature behavior of steel and GFRP reinforced concrete columns. Various factors are analyzed, including:
- Axial load
- Longitudinal reinforcement ratio
- Transverse reinforcement ratio
- Transverse reinforcement spacing
These studies help in understanding the ductile behavior of steel and GFRP reinforced concrete columns through moment-curvature analysis.
A. P-M Interaction Curve
P-M interaction diagram is used to design the reinforced concrete column in which axial load and bending moment act simultaneously. A P-M interaction diagram provides the estimation of the maximum axial load and moment carrying capacity of the GFRP reinforced concrete column and a parametric study was also conducted. And also, the interaction diagram is drawn for the geopolymer GFRP reinforced concrete column
1) Objectives of the Project
Comparison of Material Performance: Evaluate and compare the moment-curvature and P-M interaction characteristics of steel and GFRP-reinforced concrete columns. Assess how the material properties of steel and GFRP influence the structural behavior under various loading conditions.
Identification of Key Differences: Identify and analyze the key differences in the structural performance of steel and GFRP-reinforced concrete columns. Explore how factors such as tensile strength, ductility, and weight affect the behavior of the columns.
Influence of Reinforcement Percentage: Investigate the impact of varying reinforcement percentages on the moment-curvature and P-M interaction responses of both steel and GFRP- reinforced columns. Understand how changes in reinforcement levels influence the structural performance.
Effect of Concrete Strength: Analyze the influence of different concrete strengths on the moment- curvature and P-M interaction behavior of columns reinforced with steel and GFRP. Explore how variations in concrete strength affect the overall structural response.
B. Scope of the Project
The "Moment-Curvature and P-M Interaction Analysis of Steel and GFRP Reinforced Concrete Column" project holds significant potential for future research and applications. The scope of the project could extend into several areas, paving the way for advancements in structural engineering and material science.One potential future scope involves an in-depth exploration of the long-term performance and durability of GFRP-reinforced concrete columns compared to their steel-reinforced counterparts. Understanding how these materials withstand environmental factors, such as cyclic loading, exposure to aggressive substances, and variations in temperature, would provide valuable insights for designing resilient and sustainable structures. Further research could focus on optimizing the composition of GFRP and developing enhanced coatings to enhance its resistance to environmental degradation
IV. METHODOLOGY
1) Concrete Mix Formulation
- Prepared concrete blends targeting two strength classes: M20 and M30.
- Followed the IS-10262:2009 guidelines.
- Used ordinary Portland cement, natural sand, and crushed ballast with a maximum particle size of 20mm.
2) Casting and Curing
- Cast columns and de-molded them after 24 hours.
- Cured the columns by immersing them in fresh water tanks in controlled laboratory settings for 28 days before testing.
3) Materials for Reinforcement
- Employed Glass Fiber Reinforced Polymer (GFRP) bars from Xian Kig Technology Co. Ltd.
- Used GFRP bars with diameters ranging from 8mm to 16mm as the principal longitudinal reinforcement in the RC Columns.
- Utilized steel bars with diameters of 8mm and 12mm for the primary longitudinal reinforcement in some RC beams.
- Used 8mm steel bars of Fe 500 grade for shear reinforcement as stirrups.
4) Properties of GFRP Bars
- GFRP bars had an elastic modulus of 60,000 MPa.
- Adopted a hybrid reinforcement approach, combining GFRP and steel bars to capitalize on the advantages of both materials.
5) Experimental Program:
- Conducted an extensive experimental program involving 32 RC Columns.
- Performed three-point bending tests on each column until failure.
- Each RC Column had cross-sectional dimensions of 150mm × 150mm and a length of 700mm.
- Divided the RC Columns into two series for testing: the GFRP series and the Steel series.
V. MATERIALS USED
A. Materials Used
This study incorporates fundamental constituents of concrete, complemented by additional additives designed to improve both performance and sustainability. The subsequent sections provide a detailed exploration of the following materials:
B. Cement
Concrete relies on cement as its principal binding agent, providing strength and cohesion to the mixture. In this study, the selected material is Ordinary Portland Cement 53 grade, sourced from Ultra-tech Cement Company, and adhering to the standards outlined in IS 12269-1987.The physical properties are shown in Table 1 below.
Table 1 Physical Properties of Cement
|
S.NO |
PARTICULARS |
RESULTS |
|
1 |
Specific Gravity |
3.10 |
|
2 |
Initial setting time |
36 min |
|
3 |
Final setting time |
320 min |
|
4 |
Fineness (%) |
94 |
C. Fine Aggregate
Within the domain of concrete, fine aggregate plays a pivotal role by filling voids amidst coarse aggregate, thereby enhancing the overall density and strength of the concrete matrix. In this study, the selected fine aggregate is natural sand sourced from the Vegavathi River near Vantaram in the Vizianagaram district. The sand's specific gravity, gauged at 2.6, offers valuable information regarding its density in relation to water
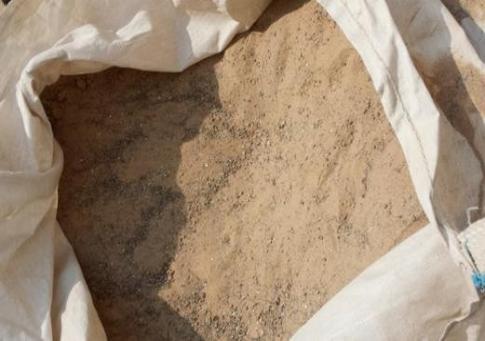
Figure 3 Fine aggregate
Table 2 Physical properties of fine aggregates
|
S.NO |
PARTICULARS |
RESULTS |
|
1 |
Type |
Normal sand |
|
2 |
Specific gravity |
3.14 |
|
3 |
Grading size |
4.75mm – 0.075mm |
|
4 |
Water absorption |
0.6% |
|
5 |
Fineness modulus |
2.70 |
|
6 |
Bulk density in Loose state Compacted state |
1378.82 kg/m3 1544.67 kg/m3 |
1) Sieve Analysis
The gradation of the fine aggregate is determined through sieve analysis, a standardized procedure for assessing particle size distribution. The results of the sieve analysis for the fine aggregate are presented in Table 3 below
Table 3 Sieve Analysis of Fine Aggregates
|
Sieve size (mm) |
Weight of the sample (kg) |
Cumulative sample weight (kg) |
Cumulative% of Weight retained (Kg) |
Cum % of passin |
|
4.75 |
0 |
0 |
0 |
100 |
|
2.36 |
0.04 |
0.04 |
4 |
96 |
|
1.18 |
0.23 |
0.27 |
27 |
73 |
|
600 µ |
0.25 |
0.52 |
52 |
48 |
|
425 µ |
0.020 |
0.54 |
54 |
46 |
|
300 µ |
0.13 |
0.67 |
67 |
33 |
|
150 µ |
0.20 |
0.87 |
87 |
13 |
|
Pan |
0.1 |
1.000 |
- |
0 |
The sieve analysis offers valuable insights into the particle size distribution of the fine aggregate, a factor crucial in shaping the workability, strength, and durability of the concrete mix. To encapsulate, the fine aggregate utilized in this study possesses distinctive characteristics, including specific gravity and origin from the Vegavathi River, with its particle size distribution meticulously determined through sieve analysis. These attributes play a pivotal role in refining concrete mix designs, ensuring the targeted performance, and bolstering the durability of the ensuing concrete structures
D. Coarse Aggregate
Coarse aggregate, with its larger particle size, plays a critical role in providing bulk and stability to concrete mixes. In this study, crushed granite aggregate with a particle size of 20mm is employed as the coarse aggregate. The specific gravity of the coarse aggregate is determined to be 2.7, indicating its density relative to water
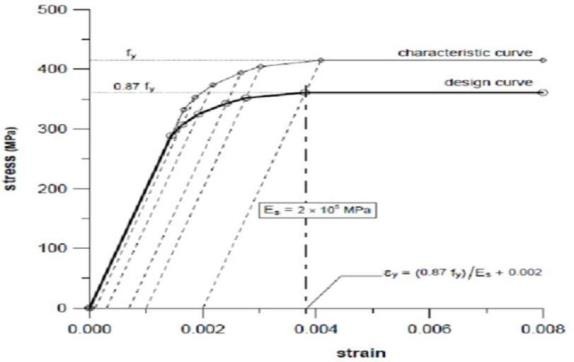
Table 4 Specific Gravity
|
S.NO |
PARTICULARS |
RESULTS |
|
1 |
Type |
Crushed stone |
|
2 |
Specific gravity |
2.66 |
|
3 |
Maximum size |
20mm |
|
4 |
Water absorption |
0.45% |
|
5 |
Fineness modulus |
3.9 |
|
6 |
Bulk density |
1688 kg/m3 |
E. Steel
- Type: High-yield strength deformed (HYSD) bars conforming to IS 1786:2008 were used as reinforcement.
- Diameter: The bars used had diameters of 8 mm and 12 mm.
- Properties: Tensile strength, yield strength, and elongation properties were tested as per IS standards.
F. Glass Fiber Reinforced Polymer (GFRP)
- Type: GFRP bars with diameters of 10 mm and 16 mm were used as an alternative to steel reinforcement.
- Properties: The bars were tested for tensile strength, shear strength, and bond strength as per ASTM standards.
- Surface Treatment: The GFRP bars were sand-coated to improve the bond between the concrete and reinforcement material.
VI. RESULTS AND DISCUSSIONS
A. After 28 days Result of G1 and S1 Models Overview
The results of a deflection test on two beam specimens—one made from Glass Fiber Reinforced Polymer (GFRP) and the other from steel—were analyzed. The specimens were reinforced with either M20 or M30 rebar. The test measured the deflection of the specimens under various loads.Load vs. Deformation Data
Table 5 Deformation at different loads
|
LOAD(KN) |
S1 M20deformation(mm) |
G1 M20 deformation(mm) |
S1 M30 deformation(mm) |
G1 M30 deformation (mm) |
|
10 |
0.856 |
0.962 |
0.144 |
0.55 |
|
20 |
0.129 |
1.573 |
0.243 |
1.284 |
|
30 |
0.182 |
2.671 |
0.384 |
2.056 |
|
40 |
0.509 |
3.219 |
0.715 |
2.672 |
|
50 |
1.38 |
3.812 |
1.32 |
3.394 |
Observations
- Deflection: GFRP specimens exhibited greater deflection compared to steel specimens at the same load, likely due to the flexibility of GFRP.
- Reinforcement Type: Specimens reinforced with M30 rebar demonstrated less deflection than those with M20 rebar, attributed to the larger diameter of M30 providing more support.
- Test Limitations: The graph represents results from a single test; variations may occur in other tests, and failure modes are not depicted.
.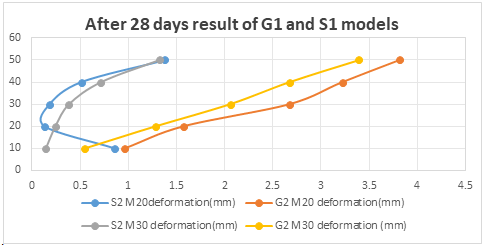
The Y-axis of the graph is labelled "Load (KN)," and the X-axis is labelled "Deflection (mm)." The lines on the graph show how much each specimen deflected under different loads. For example, the line labelled "G1 M20" shows how much a GFRP specimen reinforced with M20 rebar deflected under different loads.
B. After 28 days of G2 and S2 models
The graph shows that the GFRP specimens deflected more than the steel specimens under the same load. This is likely because GFRP is a more flexible material than steel. The graph also shows that the specimens reinforced with M30 rebar deflected less than the specimens reinforced with M20 rebar. This is likely because M30 rebar is a larger diameter rebar than M20 rebar, and so it can provide more support to the specimen.
It is important to note that the graph only shows the results of one test. The results of other tests may be different. Additionally, the graph does not show how the specimens failed. The specimens may have failed in a few different ways, such as by breaking, yielding, or crushing.
Table 6 Deformations at different loading
|
LOAD (KN) |
S2 M20deformation (mm) |
G2 M20 deformation (mm) |
S2 M30 deformation (mm) |
G2 M30 deformation (mm) |
|
10 |
0.019 |
0.548 |
0.057 |
0.572 |
|
20 |
0.0297 |
1.097 |
0.104 |
1.048 |
|
30 |
0.067 |
1.7914 |
0.123 |
1.613 |
|
40 |
0.214 |
2.134 |
0.157 |
2.134 |
|
50 |
0.427 |
2.468 |
0.216 |
2.431 |
|
60 |
1.37 |
3.027 |
0.603 |
3.11 |
Observations
- Strength Comparison: M30 cement columns generally outperformed M20 columns in load capacity.
- Material Comparison: S2 steel reinforced columns demonstrated greater load capacity compared to G2 glass fiber columns.
- Lowest Capacity: The combination of G2 with M30 cement had the lowest load-carrying capacity.
- Highest Capacity: S2 with M30 cement exhibited the highest load-carrying capacity.
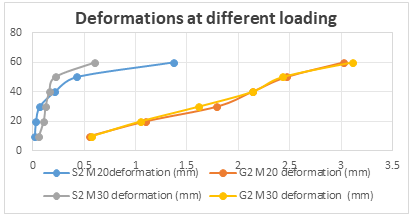
The graph illustrates the load vs. deformation response of four reinforced concrete columns made with two cement grades (M20 and M30) and two reinforcement types (G2 glass fiber and S2 steel). Key observations include:
- M30 cement columns exhibit higher load-carrying capacity than M20 columns due to the superior strength of M30.
- S2 steel reinforcement provides greater load capacity than G2 glass fiber reinforcement.
- Among the column types, G2 M30 has the lowest capacity, while S2 M30 has the highest.
Note that the graph only displays behavior up to a certain deflection, excluding post-deflection responses.
C. After 28 days of G3 and S3 models
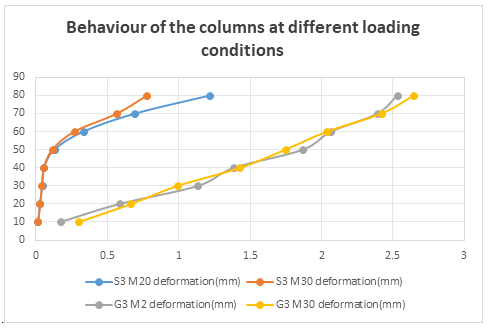
After 28 days, the observations for the G3 and S3 models are as follows:
- M30 cement columns have a higher load-carrying capacity than M20 columns.
- S3 steel reinforcement outperforms G3 glass fiber reinforcement in load capacity.
- S3M30 columns exhibit the highest capacity of all types.
- G3M20 columns have the lowest load-carrying capacity.
These trends are consistent with previous findings.
Table 7 Deformation at different loads
|
LOAD (KN) |
S3 M20 deformation (mm) |
S3 M30 Deformation (mm) |
G3 M20 Deformation (mm) |
G3 M30 Deformation (mm) |
|
10 |
0.0141 |
0.014 |
0.169 |
0.297 |
|
20 |
0.0283 |
0.028 |
0.582 |
0.665 |
|
30 |
0.0427 |
0.042 |
1.132 |
0.99 |
|
40 |
0.056 |
0.056 |
1.386 |
1.429 |
|
50 |
0.127 |
0.113 |
1.867 |
1.745 |
|
60 |
0.33 |
0.268 |
2.066 |
2.037 |
|
70 |
0.693 |
0.566 |
2.39 |
2.419 |
|
80 |
1.216 |
0.777 |
2.53 |
2.646 |
This section evaluates the G3 and S3 models to further investigate the performance of GFRP and steel reinforcements under axial loads. By examining various reinforcement configurations, the study contributes to a comprehensive understanding of how these materials behave under typical loading scenarios encountered in coastal environments.
 .
.
The analysis reinforces the notion that while GFRP may have lower load-carrying capacities compared to steel, its corrosion resistance offers significant long-term advantages. This is particularly relevant in areas prone to harsh weather conditions, making GFRP a favorable option.
D. After 60 Days Results
Following an extended curing period, this section evaluates the performance of the S1 and G1 models after 60 days. This extended timeframe allows for the assessment of durability and the material's response to prolonged loading conditions, essential for understanding the long-term viability of GFRP reinforcement.
Table 8 Deformations at different loading
|
LOAD (KN) |
G1 M20 Deformation(mm) |
G1 M30 Deformation(mm) |
S1 M20 Deformation(mm) |
S1 M30 Deformation |
|
10 |
0.71 |
0.41 |
0.13 |
0.009 |
|
20 |
1.3 |
0.98 |
0.16 |
0.13 |
|
30 |
2.31 |
1.74 |
0.25 |
0.16 |
|
40 |
3 |
2.45 |
0.5 |
0.34 |
|
50 |
3.64 |
3.16 |
1.21 |
0.89 |
|
60 |
4.12 |
3.66 |
1.51 |
1.35 |
Observations
- Maximum Load Capacity: The S1 M30 model exhibited the highest load capacity, able to withstand up to 70 kN before a deflection of 5 mm.
- Lowest Performance: The G1 M20 model showed the least load capacity, only sustaining 20 kN before reaching 5 mm deflection.
- Test Variability: Results may vary depending on specific mix compositions and curing conditions.
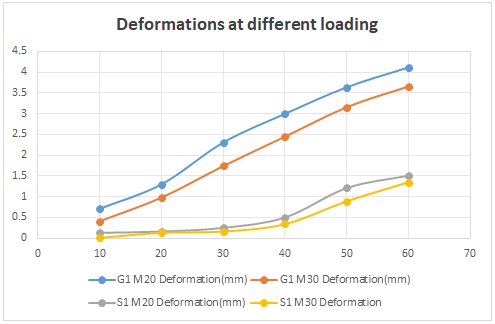
After 60 results for the S1 and G1 models, the graph shows load vs. deformation for M20 and M30 cements. Key findings include:
- S1M30 has the highest load capacity, reaching 70 kN before 5 mm deformation.
- G1M30 follows, then S1M20, and lastly G1M20, which can only withstand 20 kN before deforming 5 mm.
These results may vary based on specific mixes and curing conditions.
E. After 60 Days G2 and S2 models
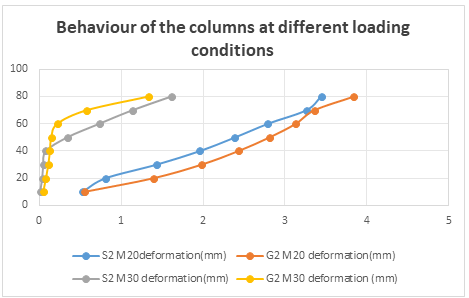
After 60 days of results for the G2 and S2 models, the graph illustrates load vs. deformation for M20 and M30 cements. Key points include:
- S2M20 has the highest load capacity, withstanding 80 kN before 4 mm deformation.
- This is followed by G2M20, S2M30, and G2M30, which only withstands 20 kN before the same deformation.
Load capacities can vary based on specific mixes and curing conditions.
Table 9 Deformations at different loading
|
LOAD (KN) |
G2 M20 Deformation(mm) |
G2 M30 Deformation(mm) |
S2 M20 Deformation(mm) |
S2 M30 Deformation |
|
10 |
0.526 |
0.55 |
0.01 |
0.048 |
|
20 |
0.81 |
1.39 |
0.035 |
0.081 |
|
30 |
1.43 |
1.98 |
0.048 |
0.11 |
|
40 |
1.96 |
2.43 |
0.08 |
0.13 |
|
50 |
2.39 |
2.81 |
0.34 |
0.146 |
|
60 |
2.79 |
3.13 |
0.73 |
0.22 |
|
70 |
3.26 |
3.36 |
1.138 |
0.58 |
|
80 |
3.44 |
3.84 |
1.609 |
1.33 |
Observations
- S2 M20 Capacity: The S2 M20 model showed the highest load capacity, with the ability to withstand 80 kN before a 4 mm deflection.
- G2 M30 Performance: Conversely, the G2 M30 model had the lowest load capacity, only sustaining 20 kN under similar conditions.
F. After 60 days of G3 and S3 models
In this final evaluation, the performance of the G3 and S3 models after 60 days is assessed. This section aims to provide a conclusive understanding of how GFRP and steel reinforcements perform over time, contributing to a broader perspective on material sustainability in construction.
Table 10 Deformations at different loading
|
LOAD (KN) |
G3 M20 Deformation(mm) |
G3 M30 Deformation(mm) |
S3 M20 Deformation(mm) |
S3 M30 Deformation(mm) |
|
20 |
0.36 |
0.65 |
0.028 |
0.028 |
|
40 |
0.45 |
1.21 |
0.07 |
0.056 |
|
60 |
2.02 |
1.83 |
0.183 |
0.127 |
|
80 |
2.32 |
2.43 |
0.99 |
0.45 |
Observations
- S3 M20 Performance: The S3 M20 model demonstrated the highest load capacity, capable of withstanding up to 90 kN before reaching a 4 mm deflection.
- Lowest Performance: G3 M30 showed the least capacity, sustaining only 10 kN under the same conditions.
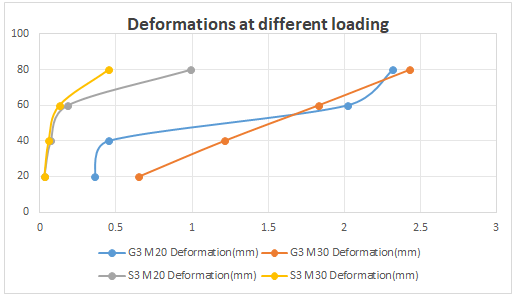
The graph you sent shows the details about how much load was applied and the corresponding deformation in M20 and M30 grade cements with G3 and S3 models. The horizontal axis shows the deformation in millimeters, and the vertical axis shows the load in kilo nektons (KN).
The graph shows that the S3M20 model has the highest load capacity, followed by the G3M20 model, the S3M30 model, and the G3M30 model. The S3M20 model can withstand a load of up to 90 KN before it deforms 4 mm, while the G3M30 model can only withstand a load of up to 10 KN before it deforms 4 mm.
It is important to note that this graph is just one example, and the load capacity of different types of cement can vary depending on the specific mix and the curing conditions
Conclusion
The series of tests conducted on various reinforced concrete column specimens yielded valuable insights into the behaviour of different materials and reinforcements under load. The key findings are summarized below: A. Deformation Test on GFRP and Steel Column Specimens (G1 and S1 Models - 28 Days) 1) GFRP specimens exhibited higher deflection than steel specimens under the same load. 2) Specimens reinforced with M30 concrete showed less deflection compared to those reinforced with M20 concrete. B. Reinforced Concrete Columns with Different Reinforcements (G2 and S2 Models - 28 Days) 1) Columns made with M30 concrete generally had a higher load-carrying capacity than those made with M20 concrete. 2) Steel reinforcement (S2) had a higher load- carrying capacity than glass fiber reinforcement (G2). 3) Columns with M30 concrete and S2 steel reinforcement (S2 M30) exhibited the highest load-carrying capacity, while those with M30 concrete and G2 glass fiber reinforcement (G2 M30) had the lowest. C. Reinforced Concrete Columns with Different Cements and Reinforcements (G3 and S3 Models - 28 Days): 1) Similar trends were observed, with M30 concrete and S3 steel reinforcement (S3 M30) having the highest load-carrying capacity. 2) Columns with M20 concrete and G3 glass fiber reinforcement (G3 M20) had the lowest load-carrying capacity. D. Long-Term Performance (60 Days) 1) S3 M30 had the highest load capacity compared to the remaining models. 2) The specific mix and curing conditions played a crucial role in determining load capacity. E. General Observations 1) The S3 structure performs well with both M20 and M30 concrete but is susceptible to corrosion. 2) To mitigate corrosion issues, especially in areas requiring lower strength, M30 concrete with GFRP reinforcement proves beneficial.
References
[1] Benmokrane, B., El-Salakawy, E., El-Ragaby, A., & El-Gamal, S. (2007). Performance evaluation of innovative concrete bridge deck slabs reinforced with fiber-reinforced polymer bars. Canadian Journal of Civil Engineering, 34(3), 298–310. DOI: 10.1139/l06-126 [2] Kara, I. F., Ashour, A. F., & Köro?lu, M. A. (2013). Flexural behavior of hybrid FRP/steel reinforced concrete beams. Composite Structures, 96, 207–218. DOI: 10.1016/j.compstruct.2012.09.035 [3] Kassem, C., Farghaly, A. S., & Benmokrane, B. (2011). Evaluation of flexural behavior and serviceability performance of concrete beams reinforced with FRP bars. Journal of Composites for Construction, 15(5), 682–695. DOI: 10.1061/(ASCE)CC.1943-5614.0000215 [4] El-Gamal, S., El-Salakawy, E., & Benmokrane, B. (2005). Influence of reinforcement type on the behavior of concrete deck slabs under static loading conditions. ACI Structural Journal, 102(5), 772–780. DOI: 10.14359/14738 [5] El-Nemr, A., Ahmed, E. A., & Benmokrane, B. (2013). Flexural behavior and serviceability of normal- and high-strength concrete beams reinforced with glass fiber–reinforced polymer bars. ACI Structural Journal, 110(6), 1077–1088. DOI: 10.14359/51686515 [6] De Luca, A., Matta, F., & Nanni, A. (2010). Behavior of full-scale glass fiber-reinforced polymer reinforced concrete columns under axial load. ACI Structural Journal, 107(5), 589–596. DOI: 10.14359/51663749 [7] Issa, M. S., Metwally, I. M., & Elzeiny, S. M. (2011). Slabs with innovative openings strengthened using GFRP. Concrete International, 33(7), 39–46. DOI: 10.1061/(ASCE)CC.1943-5614.0000206 [8] Abed, F., Alhafiz, A. R., & Awwad, Z. (2018). Effect of shear span to depth ratio and longitudinal reinforcement on shear strength of GFRP reinforced concrete beams. Engineering Structures, 176, 838–850. DOI: 10.1016/j.engstruct.2018.08.089 [9] Salib, S., & El-Salakawy, E. (2017). Flexural performance of concrete beams reinforced with hybrid (GFRP and steel) bars. ACI Structural Journal, 114(4), 991–1002. DOI: 10.14359/51689755 [10] CNR-DT 203/2006. (2007). Guide for the design and construction of concrete structures reinforced with fiber-reinforced polymer bars. National Research Council (CNR), Italy. DOI: 10.13140/RG.2.1.2421.5203 [11] Elgabbas, F., Ahmed, E. A., & Benmokrane, B. (2015). Flexural behavior of concrete beams reinforced with ribbed basalt-FRP bars under static loads. Journal of Composites for Construction, 19(2), 04014037. DOI: 10.1061/(ASCE)CC.1943-5614.0000516 [12] Kara, I. F., & Ashour, A. F. (2012). Flexural performance of GFRP reinforced concrete beams. Engineering Structures, 36, 333–342. DOI: 10.1016/j.engstruct.2011.12.033 [13] Ahmed, E. A., & Benmokrane, B. (2013). Analytical modeling of flexural strength and behavior of steel and GFRP–RC slabs. ACI Structural Journal, 110(3), 441–450. DOI: 10.14359/51684294 [14] Alsayed, S. H., Alhozaimy, A. M., & Al-Negheimish, A. (2000). Shear strength of concrete beams reinforced by GFRP rods. Journal of Reinforced Plastics and Composites, 19(9), 1373–1395. DOI: 10.1177/073168440001900906 [15] IS 456:2000. (2000). Indian Standard for Plain and Reinforced Concrete – Code of Practice. Bureau of Indian Standards, New Delhi, India. [16] IS 10262:2009. (2009). Indian Standard Concrete Mix Proportioning – Guidelines. Bureau of Indian Standards, New Delhi, India. [17] Toutanji, H., Saafi, M., & Anselm, W. (2003). Stress-strain characteristics of concrete columns externally confined with advanced composite sheets. ACI Structural Journal, 100(2), 170–176. DOI: 10.14359/12441 [18] Pantelides, C. P., & Gibbons, M. E. (2014). Strengthening of concrete columns using glass fiber reinforced polymer. Journal of Structural Engineering, 140(9), 04014070. DOI: 10.1061/(ASCE)ST.1943-541X.0001054 [19] Nigro, E., Bilotta, A., & Manfredi, G. (2010). Performance under fire conditions of concrete members reinforced with FRP bars: Bond models and design issues. Composites Part B: Engineering, 41(6), 449–460. DOI: 10.1016/j.compositesb.2010.02.001 [20] Teng, J. G., Chen, J. F., Smith, S. T., & Lam, L. (2002). FRP-strengthened RC structures. Progress in Structural Engineering and Materials, 4(1), 9–16. DOI: 10.1002/pse.120
Copyright
Copyright © 2024 Olipilli Dinesh Kumar, Ms. M. Durga, Rahul Kumar Singh, Nageswara Rao Pasupuleti. This is an open access article distributed under the Creative Commons Attribution License, which permits unrestricted use, distribution, and reproduction in any medium, provided the original work is properly cited.

Download Paper
Paper Id : IJRASET64501
Publish Date : 2024-10-08
ISSN : 2321-9653
Publisher Name : IJRASET
DOI Link : Click Here
 Submit Paper Online

