Ijraset Journal For Research in Applied Science and Engineering Technology
- Home / Ijraset
- On This Page
- Abstract
- Introduction
- References
- Copyright
Stock Price Prediction Using Machine Learning
Authors: Amogh Thakurdesai, Mayuresh Kulkarni, Advait Kulkarni, Prof. R. S. Paswan
DOI Link: https://doi.org/10.22214/ijraset.2024.64895
Certificate: View Certificate
Abstract
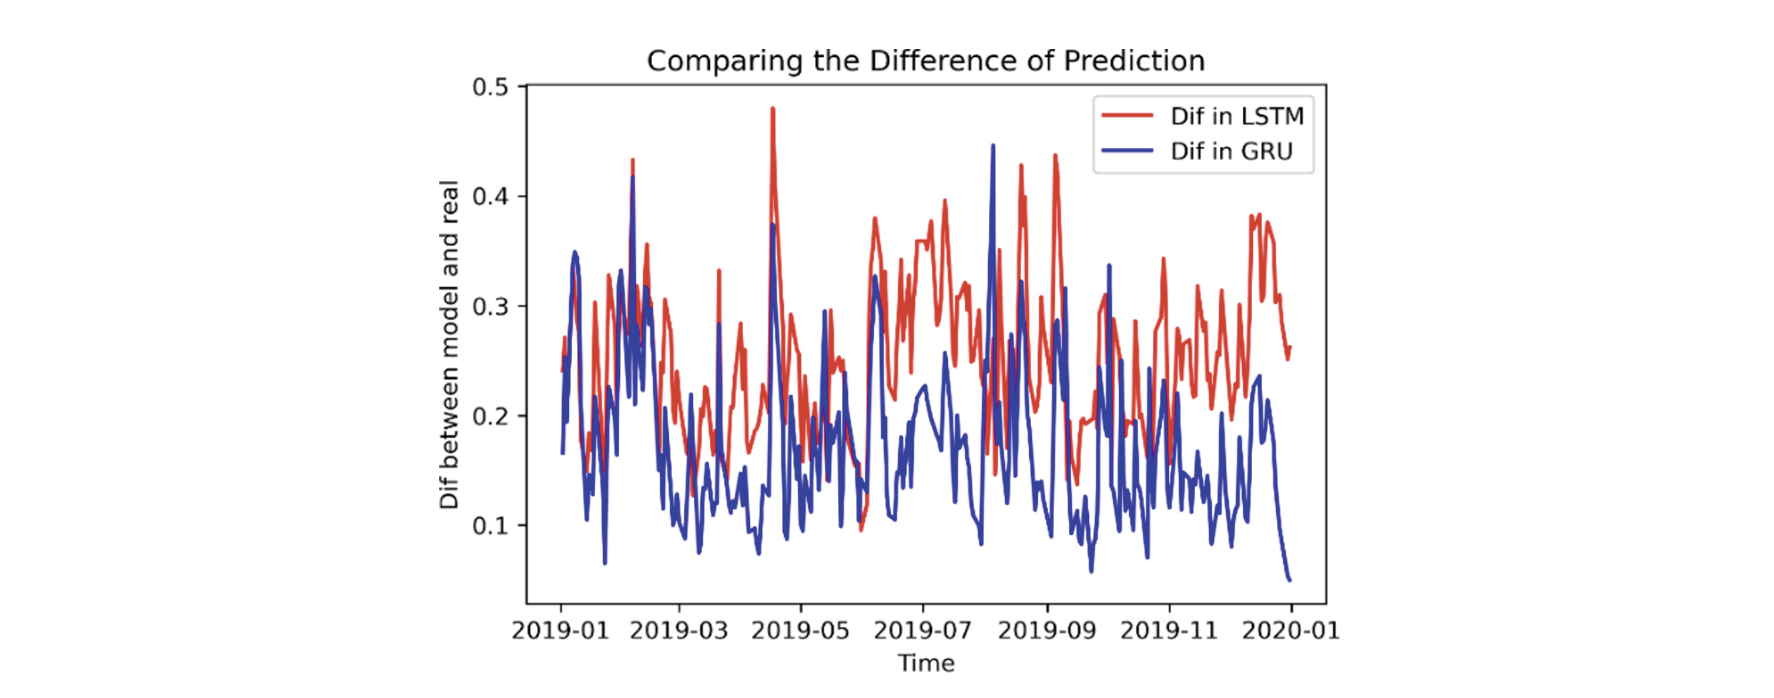
Stock price prediction is a critical and challenging task in the field of financial analysis and investment decision making. The power of artificial intelligence and machine learning is leveraged to offer more reliable predictions for investors and financial institutions. This study explores and implements various machine learning architectures, including tree-based models such as decision trees, random forests and neural network based models like Recurrent Neural Networks (RNNs), LSTM (Long short-term memory) networks, GRU(Gated Recurrent Unit) and LSTM-CNN hybrid. The implementation of the above mentioned machine learning algorithms are assessed across various comparison criteria, which include accuracy, robustness, generalization and computational efficiency.
Introduction
I. INTRODUCTION
This project, "Stock Price Prediction Using Machine Learning” delves into the fascinating realm of machine learning by employing five distinct models to forecast stock prices. The five models that will be explored are the Long Short-Term Memory (LSTM) model, the Recurrent Neural Network (RNN) model, the Decision Tree model, the Gated Recurrent Unit (GRU) and an LSTM-CNN Hybrid. Each of these models brings a unique set of strengths and capabilities to the table, making them ideal candidates for predicting stock price movements. The primary objective of this project is to compare and contrast the performance of these models in the context of stock price prediction. By doing so, we aim to gain a deeper understanding of their respective advantages and limitations, and to provide investors and financial analysts with valuable insights into which model might best suit their specific needs and preferences. With the five models—LSTM, RNN, Decision Tree,GRU and the LSTM-CNN hybrid—at our disposal, we embark on a journey to unlock the mysteries of stock price movements, offering the investment community a more comprehensive toolkit for decision-making and wealth management.
A. Related Works
In recent years, the use of machine learning techniques in stock price prediction has gained widespread attention, resulting in many studies focusing on the use of data-driven methods to improve the accuracy and efficiency of prediction models. Authors in [1] compare the profitability of the different types of Moving Average and find that the simple moving average outperforms all other types of moving averages. Murphey comments “moving averages are a totally customizable indicator which means that the user can freely choose whatever time frame they want to choose. There is no right time frame when setting up the Moving Average. The best way to figure out the appropriate one is to experiment with a number of different time periods and until you find which one fits your strategy”. However, few analysts disagree and work on finding the optimum time frame for the moving average [3]. The use of data mining techniques in the stock market is based on the theory that historical data holds essential memory for predicting the future direction [4]. The authors in [5] propose to use a decision tree on historical data that includes previous, open, minimum and maximum, last data to predict the action the trader needs to take. The accuracy of the model is not very high because the company’s performance depends on internal factors, financial reports, and performance of the company in the market. The authors in [4] combine the five methods namely, Typical Price, Bollinger Bands, Relative Strength Index (RSI), Chaikin Money Flow (CMI) and Moving Averages to predict if the following day’s close will increase or decrease. A decision tree is used to select the relevant technical indicators from the extracted feature set which is then applied to a rough set based system for predicting one-day-ahead trends in the stock market in [6]. The model developed in [7] uses a wide range of technical indicators like volume based, price based and overlays. These are given as features to a decision tree in order to select the important features and the prediction is made by the adaptive neuro fuzzy system.
B. Goal and Contribution
The goal of the paper is to compare stock price prediction with 5 types of machine learning models which are Long-Short Term Memory (LSTM Model), Recurrent Neural Networks (RNN), Decision – Tree Models, Gated Recurrent Unit (GRU) and the LSTM-CNN hybrid to see which model gives the highest accuracy.
II. APPLIED METHODOLOGY
A. Preprocessing
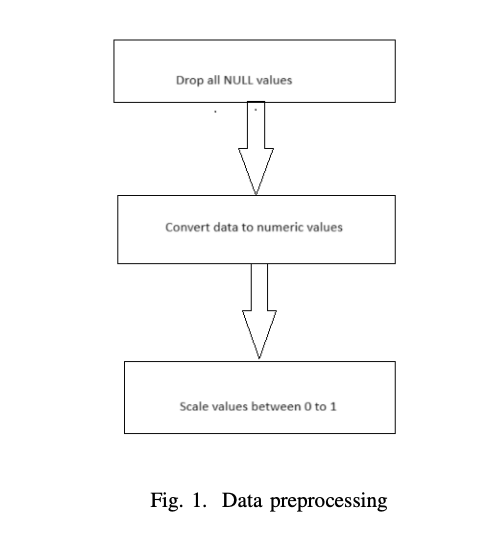
We use the data obtained from Nifty 50 Stock Market data from the year 2004 – 2021. Firstly we drop the rows containing NULL values. Then we convert the categorical data, represented as strings, into integers for more accurate predictions. Then for accuracy we scale our data between 0 and 1. Then we divide our data into a training and testing data set, initially we divide it in a ratio of 80:20. The data is the price history and trading volumes of one of the fifty stocks (TCS) in the index NIFTY 50 from NSE (National Stock Exchange) India. All datasets are at a day-level with pricing and trading values split across .csv files for each stock along with a metadata file with some macro-information about the stocks itself. The data spans from 1st January, 2004 to 30th April, 2021.
B. Features Identification
1) The mean absolute percentage error is a measure of prediction accuracy of a forecasting method in statistics.It usually expresses the accuracy as a ratio defined by the formula:

2) Median Absolute Percentage Error is an error metric used to measure the performance of regression machine learning models. It is the median of all absolute percentage errors calculated between the predictions and their corresponding actual values.
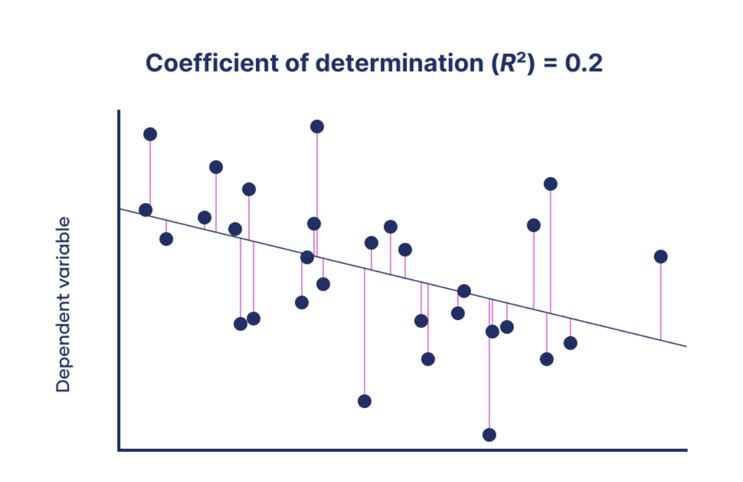

3) R2 (Coefficient of Regression) is the measure of the goodness of a fit of a model.It is a statistical measure of how well the regression predictions approximate the real data points.An R2 of 1 indicates that the regression predictions perfectly fit the data.
C. Overview of. The Models Used
We have used 5 models which are Long Short-Term Memory, Recurrent Neural Networks, the Decision Tree Models, Gated Recurrent Unit, and the LSTM-CNN hybrid to accurately predict the stock price for various companies across volumes. When applied, each of these algorithms can effectively handle the complexities and non-linear relationships often found in share market datasets. Their robustness, accuracy and ability to handle different types of data make them suitable for stock price prediction.
1) Overview of the LSTM Model
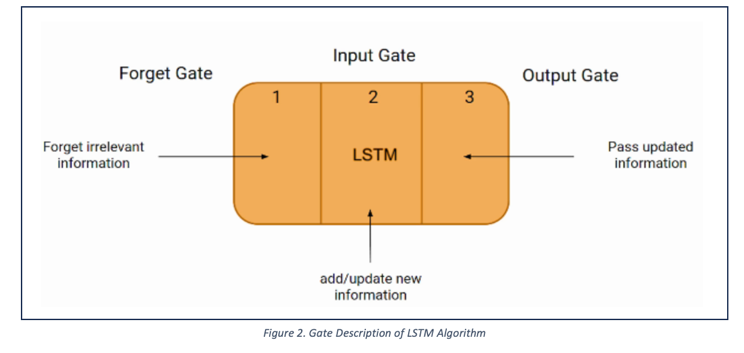
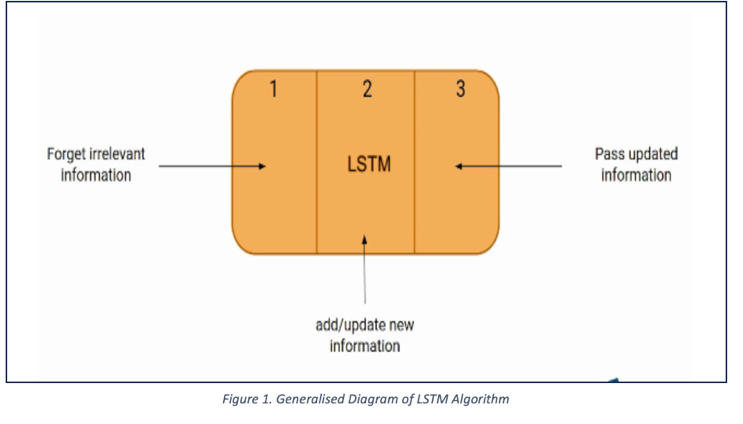
Long Short-Term Memory Networks is a deep learning, sequential neural network that allows information to persist. It is a special type of Recurrent Neural Network which is capable of handling the vanishing gradient problem faced by RNN. LSTM was designed by Hochreiter and Schmidhuber to resolve the problem caused by traditional RNNs and machine learning algorithms. LSTM can be implemented in Python using the Keras library. Let’s say while watching a video, you remember the previous scene, or while reading a book, you know what happened in the earlier chapter. RNNs work similarly; they remember the previous information and use it for processing the current input. The shortcoming of RNN is they cannot remember long-term dependencies due to vanishing gradients. LSTMs are explicitly designed to avoid long-term dependency problems. Unlike traditional neural networks, LSTM incorporates feedback connections, allowing it to process entire sequences of data, not just individual data points. This makes it highly effective in understanding and predicting patterns in sequential data like time series, text, and speech.
2) Overview of the Bi-directional LSTM Models
Bidirectional LSTMs (Long Short-Term Memory) are a type of recurrent neural network (RNN) architecture that processes input data in both forward and backward directions. In a traditional LSTM, the information flows only from past to future, making predictions based on the preceding context. However, in bidirectional LSTMs, the network also considers future context, enabling it to capture dependencies in both directions. By incorporating information from both directions, bidirectional LSTMs enhance the model’s ability to capture long-term dependencies and make more accurate predictions in complex sequential data.
3) Overview of the RNN Model
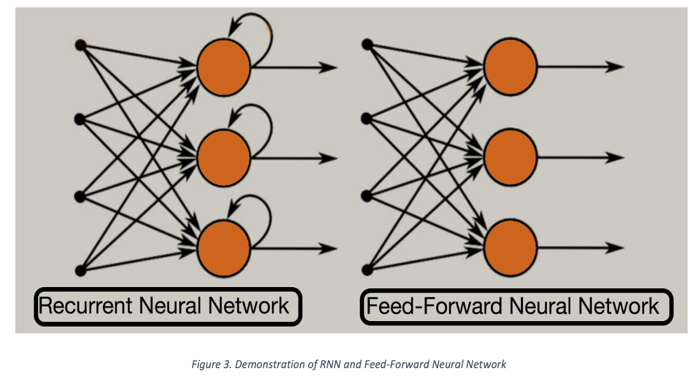
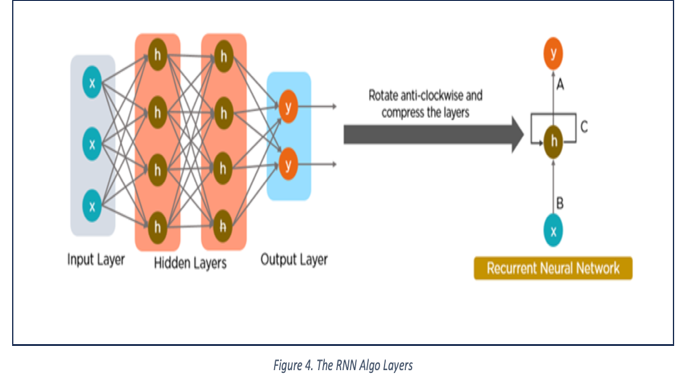
A recurrent neural network (RNN) works by processing sequential data step-by-step. It maintains a hidden state that acts as a memory, which is updated at each time step using the input data and the previous hidden state. The hidden state allows the network to capture information from past inputs, making it suitable for sequential tasks. RNNs use the same set of weights across all time steps, allowing them to share information throughout the sequence. However, traditional RNNs suffer from vanishing and exploding gradient problems, which can hinder their ability to capture long-term dependencies.Using RNN models and sequence datasets, you may tackle a variety of problems, including Speech recognition, Generation of music, Automated Translations, Analysis of video action and Sequence study of the genome and DNA. A Deep Learning approach for modeling sequential data is Recurrent Neural Networks (RNN). RNNs were the standard suggestion for working with sequential data before the advent of attention models. Specific parameters for each element of the sequence may be required by a deep feedforward model. It may also be unable to generalize to variable-length sequences.
Recurrent Neural Networks use the same weights for each element of the sequence, decreasing the number of parameters and allowing the model to generalize to sequences of varying lengths. RNNs generalize to structured data other than sequential data, such as geographical or graphical data, because of its design.
4) Overview of the GRU Algorithm
The Disintegrating gradients problem, which is typically encountered while operating a simple neural network with recurrent connections, has been the subject of numerous adaptations. Among the most common types is the LSTM. In contrast to LSTM, a GRU does not invigilate the intrinsic condition of a cell and only contains three gates. Therefore, an LSTM recurrent unit's internal cell state has been used to incorporate the information into the hidden layer of the gated recurrent unit. This set of information is sent to the following Gated Recurrent Unit. It consists of a recurrent neural network architecture that processes sequential data through an input layer, a hidden layer, and an output layer. It uses a reset gate to control the amount of information to forget from the previous hidden state and an update gate to decide the extent of the new input to be incorporated. The final output is generated from the last hidden state, which could vary based on the specific task.
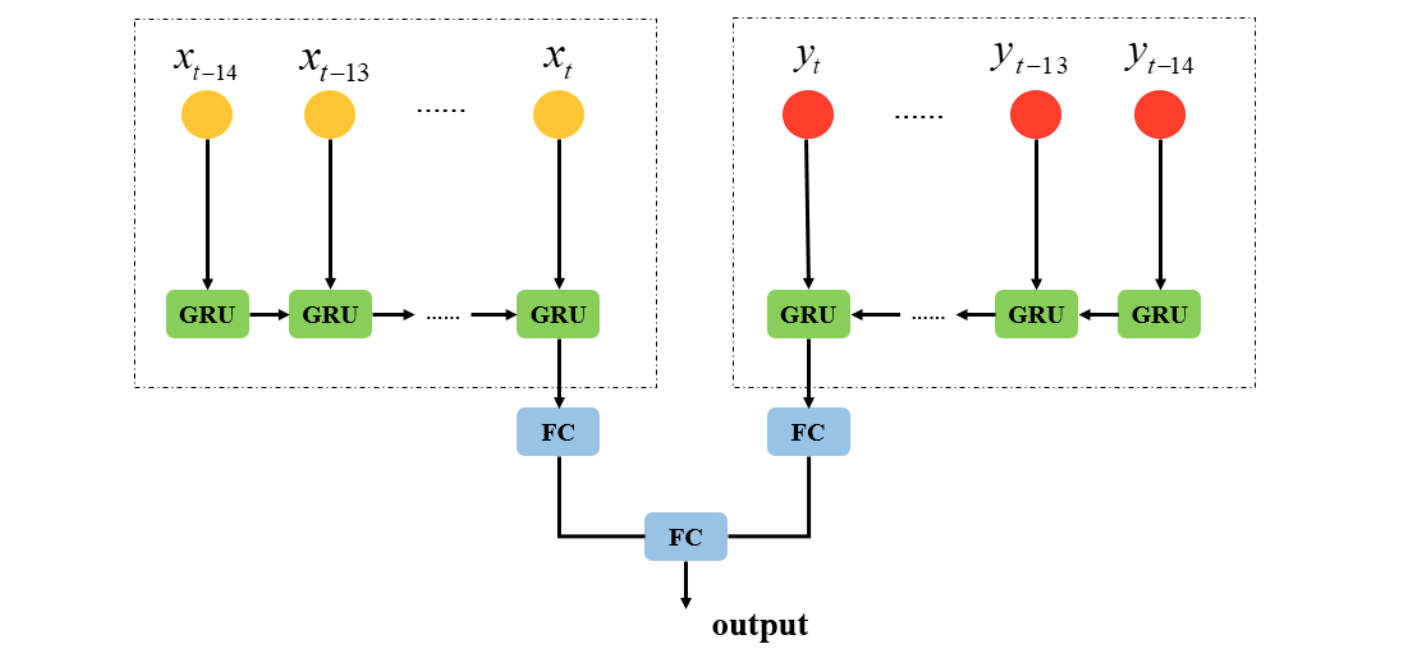
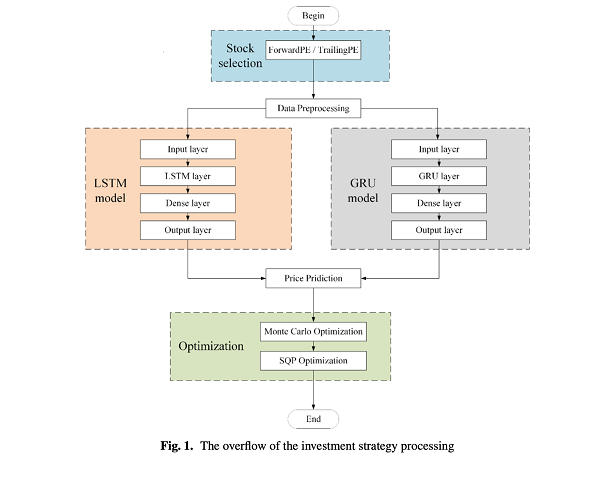
Figure: Depiction of Gated Recurrent Unit Algorithm
5) Overview of the LSTM-CNN Hybrid Model
The LSTM-CNN hybrid model represents a sophisticated approach to stock price prediction by leveraging the strengths of both Long Short-Term Memory (LSTM) networks and Convolutional Neural Networks (CNNs). LSTMs excel at capturing long-term dependencies in sequential data, making them well-suited for analyzing time series like historical stock prices. On the other hand, CNNs are adept at extracting spatial features from data, which can be valuable in identifying patterns and trends in stock market data that are not purely sequential.
The CNN-LSTM hybrid model utilizes time series data as its input, with the CNN portion featuring an input layer for data intake, a convolutional layer for data feature extraction using kernel functions, and an average pooling layer to reduce data volume and address overfitting. Post-CNN processing involves data flattening before feeding into the LSTM layer. LSTM, adept at handling sequence and time series data for classification and regression tasks, comprises three key layers: a sequence input layer for time series data introduction, an LSTM layer crucial for retaining long-term dependencies between sequence data time steps, and an output layer for pattern recognition insights.
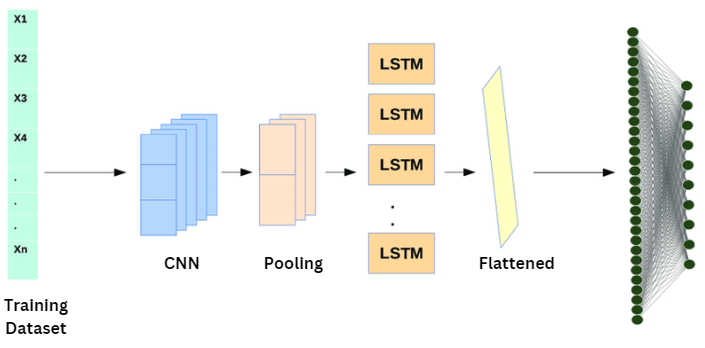
Figure: Depiction of Gated Recurrent Unit Algorithm
III. EXPERIMENTS,RESULTS AND DISCUSSIONS
??????????????A. Specifications
The experiment was carried out on a device with Intel Xeon CPU @2.20 GHz, 13 GB RAM, a Tesla T4 accelerator, and 12 GB GDDR5 VRAM and the operating system used was Ubuntu Linux. The experiment was conducted under the environment with Python version 3.11.5 and Jupyter Notebook was used to carry out the experiments.
???????B. Experimentation
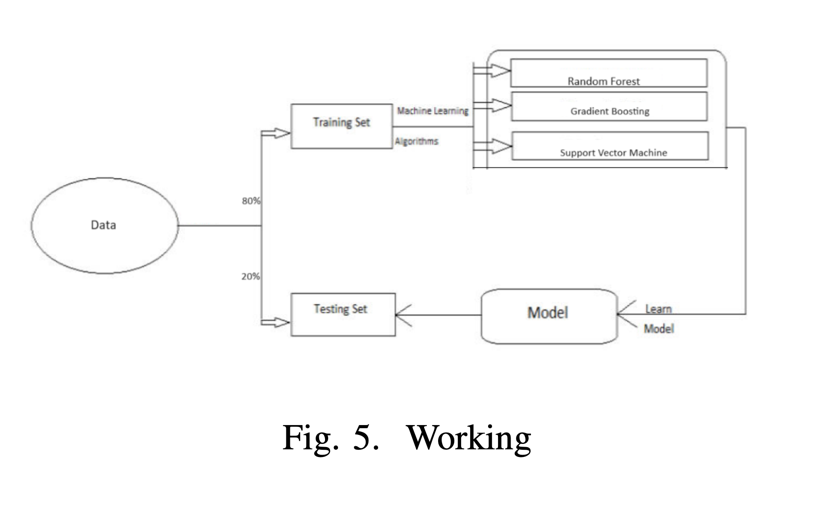
Firstly we identify all the missing values in our dataset and drop the rows having missing values as they can affect the accuracy of our models. We then convert our data to integer values and scale them between 0 to 1 for better accuracy. Then we will split our data test into training and testing data set in a ratio of 80:20.Then we will train our model using the training dataset and test it’s accuracy by comparing its result with the testing dataset.
???????C. Results
After training our model with the training dataset we get the following results :
|
Model Name
|
Accuracy Percentage |
|
Long Short Term Memory |
98.20 % |
|
Recurrent Neural Networks |
97.49 % |
|
Gated Recurrent Unit Model
|
97.99% |
|
LSTM-CNN Hybrid Model |
96.05% |
TABLE I . Aggregate Precision of Each Model
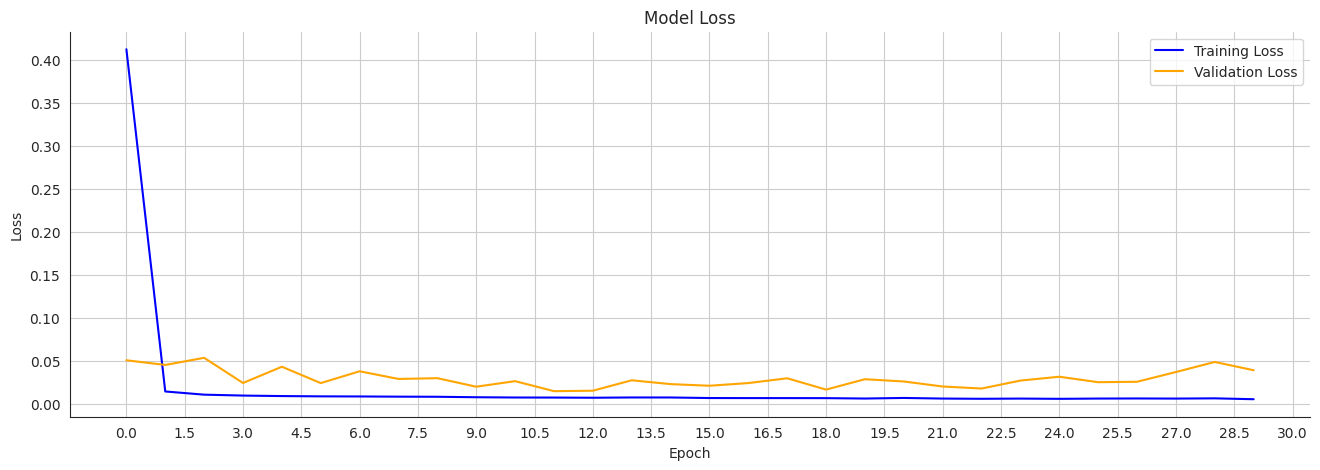
Figure: LSTM Model Loss Curve
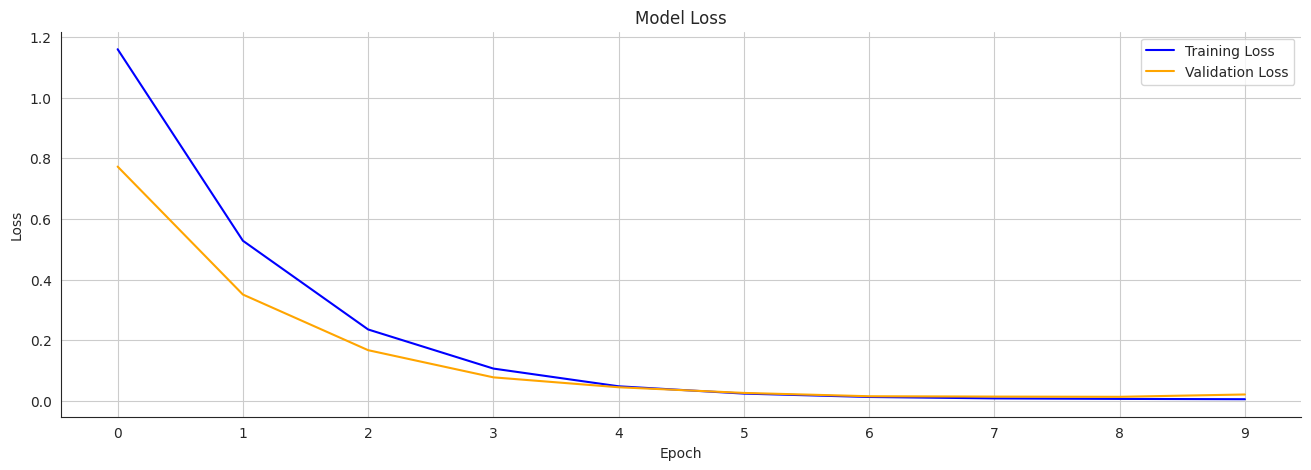
Figure: RNN Model Loss Curve
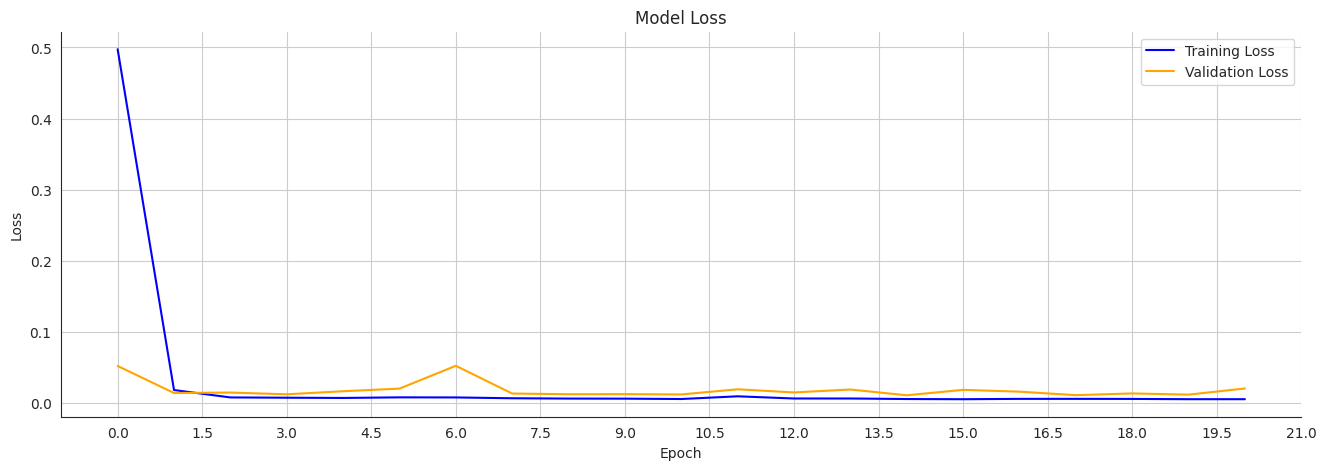
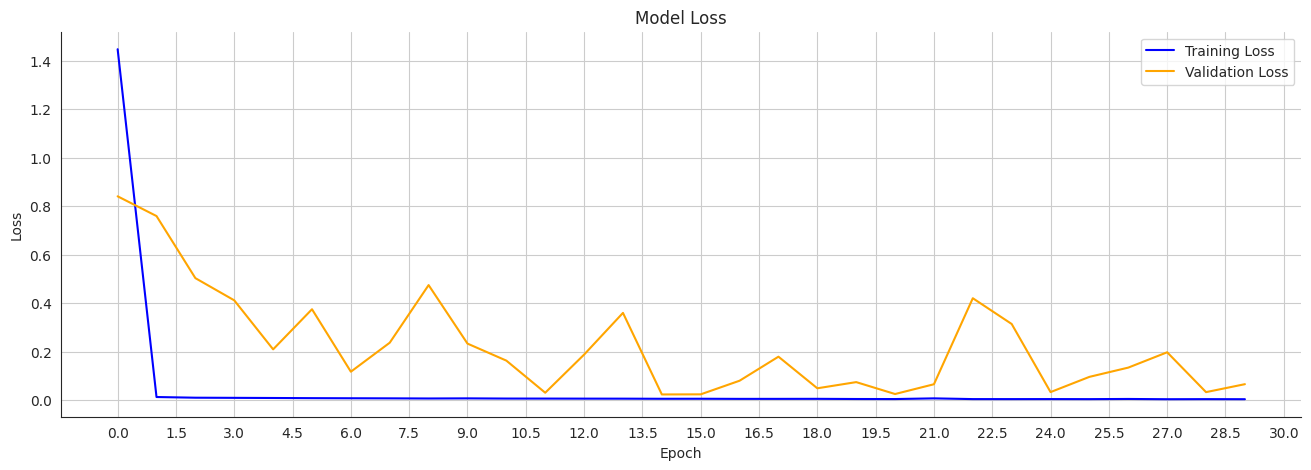
Figure: GRU Model Loss Curve
 ???????Figure: LSTM-CNN Hybrid Model Loss Curve
References
[1] P. Sandhya, R. Bandi and D. D. Himabindu, \"Stock Price Prediction using Recurrent Neural Network and LSTM,\" 2022 6th International Conference on Computing Methodologies and Communication (ICCMC), Erode, India, 2022 [2] M. A. Istiake Sunny, M. M. S. Maswood and A. G. Alharbi, \"Deep Learning-Based Stock Price Prediction Using LSTM and Bi-Directional LSTM Model,\" 2020 2nd Novel Intelligent and Leading Emerging Sciences Conference (NILES), Giza, Egypt, 2020 [3] G. Bathla, \"Stock Price prediction using LSTM and SVR,\" 2020 Sixth International Conference on Parallel, Distributed and Grid Computing (PDGC), Waknaghat, India, 202 [4] Aaryan, A, and B. Kanisha. \"Forecasting stock market price using LSTM-RNN.\" 2022 2nd International Conference on Advance Computing and Innovative Technologies in Engineering (ICACITE). IEEE, 2022. [5] Fathali, Zahra, Zahra Kodia, and Lamjed Ben Said. \"Stock market prediction of Nifty 50 index applying machine learning techniques.\" Applied Artificial Intelligence 36.1 (2022) [6] Brownlee J. Deep learning for time series forecasting: predict the future with MLPs, CNNs and LSTMs in Python. Machine Learning Mastery. 2018. https://machinelearningmastery.com/time-series-prediction-lstm-recurrent-neural-networks-python-keras/ [7] Fischer T, Krauss C. Deep learning with long short-term memory networks for financial market predictions. Eur J Oper Res. 2018;270(2):654–69. https://doi.org/10.1016/j.ejor.2017.11.054 [8] Zhang, Y., Wu, R., Dascalu, S.M. et al. A novel extreme adaptive GRU for multivariate time series forecasting. Sci Rep 14, 2991 (2024). https://doi.org/10.1038/s41598-024-53460-y [9] Chen, C.; Xue, L.; Xing, W. Research on Improved GRU-Based Stock Price Prediction Method. Appl. Sci. 2023, 13, 8813. https://doi.org/10.3390/app13158813 [10] K.E. ArunKumar, Dinesh V. Kalaga, Ch. Mohan Sai Kumar, Masahiro Kawaji, Timothy M. Brenza, Comparative analysis of Gated Recurrent Units (GRU), long Short-Term memory (LSTM) cells, autoregressive Integrated moving average (ARIMA), seasonal autoregressive Integrated moving average (SARIMA) for forecasting COVID-19 trends, Alexandria Engineering Journal,Volume 61, Issue 10,2022, Pages 7585-7603, ISSN 1110-0168, https://doi.org/10.1016/j.aej.2022.01.011. [11] Ali Agga, Ahmed Abbou, Moussa Labbadi, Yassine El Houm, Imane Hammou Ou Ali, CNN-LSTM: An efficient hybrid deep learning architecture for predicting short-term photovoltaic power production, Electric Power Systems Research, Volume 208, 2022, 107908, ISSN 0378-7796, https://doi.org/10.1016/j.epsr.2022.107908. [12] Zhang, Jiarui & Li, Yingxiang & Tian, Juan & Li, Tongyan. (2018). LSTM-CNN Hybrid Model for Text Classification. 1675-1680. 10.1109/IAEAC.2018.8577620. [13] S. Otieno, E. O. Otumba and R. N. Nyabwanga, Application of Markov chain to model and forecast stock market trend: a study of Safaricom shares in Nairobi Securities Exchange, Kenya, International Journal of Current Research 7(4) (2015), 14712-14721. [14] Dar, Gulbadin & Padi, Tirupathi Rao & Sarode, Rekha. (2022). STOCK PRICE PREDICTION USING A MARKOV CHAIN MODEL: A STUDY FOR TCS SHARE VALUES. Advances and Applications in Statistics. 80. 83-101. 10.17654/0972361722068. [15] M. R. Hassan and B. Nath, Stock market forecasting using hidden Markov model: a new approach, 5th International Conference on Intelligent Systems Design and Applications (ISDA’05), 2005, pp. 192-19 [16] Jain, Sneh & Gupta, Roopam & Moghe, Asmita. (2018). Stock Price Prediction on Daily Stock Data using Deep Neural Networks. 1-13. 10.1109/ICACAT.2018.8933791. [17] Srilakshmi, K & Sruthi, Ch. (2021). Prediction of TCS Stock Prices Using Deep Learning Models. 1448-1455. 10.1109/ICACCS51430.2021.9441850. [18] Ghodake, Sonali B., and R. S. Paswan. “Survey on recommender system using distributed frame work.”. Int. J.Sci. Res.(IJSR) 5.1 (2016). [19] Deshpande, Anjali, and Ratnamala Paswan. “REAL-TIME EMOTION RECOGNITION OF TWITTER POSTS USING A HYBRID APPROACH”. ICTACT Journal on Soft Computing 10.4 (2020).
Copyright
Copyright © 2024 Amogh Thakurdesai, Mayuresh Kulkarni, Advait Kulkarni, Prof. R. S. Paswan. This is an open access article distributed under the Creative Commons Attribution License, which permits unrestricted use, distribution, and reproduction in any medium, provided the original work is properly cited.

Download Paper
Paper Id : IJRASET64895
Publish Date : 2024-10-29
ISSN : 2321-9653
Publisher Name : IJRASET
DOI Link : Click Here
 Submit Paper Online

