Ijraset Journal For Research in Applied Science and Engineering Technology
- Home / Ijraset
- On This Page
- Abstract
- Introduction
- Conclusion
- References
- Copyright
Stock Price Prediction Using Machine Learning Models: A Study of NSE Stocks
Authors: Akash Mahendra Kushwaha , Ronit Rohit Malhotra, Nikhil Naresh Manchhani , Vansh Gopal Narwani
DOI Link: https://doi.org/10.22214/ijraset.2024.58704
Certificate: View Certificate
Abstract
This paper presents a study on stock price prediction utilizing the ARIMA and Linear Regression algorithms, focusing on companies listed on the National Stock Exchange (NSE) of India. The aim is to compare the predictive accuracies of these models while considering the lifetime data of stocks obtained through the Yahoo Finance API. Through comprehensive analysis, historical stock data spanning the entire lifespan of the stocks is utilized, enabling a thorough exploration of long-term trends and patterns. It was inferred that for NSE (Indian Company) stocks and Linear Regression prove to be more efficient than ARIMA. The research methodology involves data retrieval, preprocessing, and model training, with Python being the primary programming language for implementation. Findings indicate the effectiveness of ARIMA and Linear Regression models in forecasting NSE stock prices, with implications for financial decision-making and investment strategies. This study contributes to the understanding of machine learning applications in the stock market domain, emphasizing the importance of leveraging comprehensive historical data for enhanced predictive performance.
Introduction
I. INTRODUCTION
In the ever-evolving landscape of financial markets, the ability to accurately predict stock prices is paramount for investors, traders, and financial analysts. With the proliferation of machine learning algorithms, particularly in the realm of time series forecasting, there has been a growing interest in leveraging these techniques to forecast stock prices. This paper embarks on a comprehensive exploration of stock price prediction methodologies, focusing on companies listed on the National Stock Exchange (NSE) of India. The primary objective of this research is to evaluate the efficacy of two widely-used forecasting algorithms, namely Autoregressive Integrated Moving Average (ARIMA) and Linear Regression, in predicting NSE stock prices. Additionally, the study aims to compare the predictive accuracies of these models while considering the lifetime data of stocks obtained through the Yahoo Finance API.
The research draws upon insights from existing studies in the field. Yoo, Kim, and Jan [1] conducted a comparative evaluation of machine learning techniques for stock market prediction, highlighting the superior predictive ability of Neural Networks. Adebiyi, Adewumi, and Ayo [3] utilized the ARIMA model to predict stock prices on the New York Stock Exchange (NYSE) and Nigeria Stock Exchange (NSE), demonstrating its effectiveness for short-term prediction. Furthermore, Naik and Mohan [4] delved into the intricacies of predicting stock price movements, emphasizing the superiority of deep learning models over traditional machine learning techniques.
By harnessing historical stock data spanning the entire lifespan of NSE-listed companies, this research seeks to provide insights into long-term trends and patterns within the market. The choice of the NSE as the focus of analysis stems from its significance as one of the leading stock exchanges in India, playing a pivotal role in shaping the country's financial landscape. The methodology employed in this study encompasses various stages, including data retrieval, preprocessing, and model training, all conducted within the Python programming environment. Through rigorous analysis and experimentation, the research endeavors to shed light on the comparative performance of ARIMA and Linear Regression models in forecasting NSE stock prices. Finally, the findings of this research are expected to have significant implications for financial decision-making and investment strategies within the Indian stock market. By enhancing our understanding of machine learning applications in stock price prediction, this study aims to contribute valuable insights to the broader discourse on financial forecasting methodologies.
II. LITERATURE REVIEW
A. Machine Learning Techniques and Use of Event Information for Stock Market Prediction
Paul D. Yoo, Maria H. Kim and Tony Jan compared and evaluated some of the existing ML techniques used for stock market prediction.
After comparing simple regression, multivariate regression, Neural Networks, Support Vector Machines and Case Based Reasoning models they concluded that Neural Networks offer the ability to predict market directions more accurately as compared to other techniques. Support Vector Machines and Case Based Reasoning are also popular for stock market prediction. In addition, they found that incorporating event information with prediction models plays a very important role for more accurate prediction. The web provides the latest and latest event information about the stock market which is required to yield higher prediction accuracy and to make predictions in a short time frame [1].
B. NSE Stock Market Prediction Using Deep-Learning Models
Hiransha M, Gopalakrishnan E.A, Vijay Krishna Menon, and Soman K.P explored the use of deep learning architectures for stock price prediction using historical data. They employed Multilayer Perceptron (MLP), Recurrent Neural Networks (RNN), Long Short-Term Memory (LSTM), and Convolutional Neural Network (CNN) models. The study utilized day-wise closing prices from both the National Stock Exchange (NSE) of India and the New York Stock Exchange (NYSE). Training the network with data from a single NSE company, they subsequently tested it on five companies from both NSE and NYSE. CNN emerged as the most effective model, outperforming other architectures. Surprisingly, the CNN model accurately predicted NYSE stock prices despite being trained solely on NSE data, suggesting shared underlying dynamics between the markets. Comparative analysis with the ARIMA model showcased the superior predictive performance of neural networks over traditional linear models [2].
C. Stock Price Prediction Using ARIMA Model
Ayodele A. Adebiyi, Aderemi O. Adewumi and Charles K. Ayo used the ARIMA model to predict the stock price on the data obtained from New York Stock Exchange (NYSE) and National Stock Exchange (NSE). They made use of a data set consisting of four features: open, low, close and high price. In their work, they have taken the closing price as the target feature to be predicted. The reason behind this is that the Closing price is the most relevant price at the end of the day. They have demonstrated that there is no relation between the autocorrelation functions (ACFs) and partial autocorrelation functions (PACFs) using Q-statistics and Correlation plots. Moreover, for non-stationary data, it was made stationary with the help of differencing techniques. It was concluded towards the end of the research that the ARIMA model is very useful for short-term prediction [3].
D. Stock Price Movements Classification Using Machine & Deep Learning Techniques-The Case Study of Indian Stock Market
Nagaraj Naik and Biju R. Mohan explored the intricacies of predicting stock price movements, recognizing its significance for traders and analysts seeking profitable investment decisions. Given the volatile nature of stock markets, precise daily predictions pose a formidable challenge, necessitating robust predictive models. In their study, Naik and Mohan addressed two key challenges: first, the identification and selection of relevant technical indicators from a pool of 33 extracted indicators, accomplished through the Boruta feature selection technique. Second, the development of accurate prediction models for stock price movements, leveraging both machine learning and deep learning approaches. Notably, their findings demonstrated the superior performance of deep learning models over traditional machine learning techniques, resulting in a noteworthy improvement of 5% to 6% in classification accuracy rates. The experiment focused on stocks listed on the National Stock Exchange, India (NSE), highlighting the practical relevance of their research in the Indian stock market context [4].
III. METHODOLOGY
A. Linear Regression
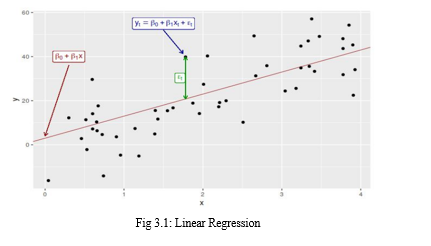
Linear Regression is a fundamental statistical method used for modeling the relationship between a dependent variable and one or more independent variables by fitting a linear equation to observed data. It is widely employed in various fields, including economics, finance, engineering, and social sciences, for tasks such as prediction, forecasting, and trend analysis.
In Linear Regression model, the simulation of equation linearity is used to combine a input data set of values (x) to the predicted output data set of input values (y). Both the input and output variables and values are treated as integers. The variable integer assigned by the equation of Linear Regression is represented using the capital Greek letter Beta (B) and is most commonly known as the coefficient. In addition to this, another coefficient is added to give the line an extra degree of freedom. This extra term is commonly known as the bias coefficient. Often, the bias coefficient is calculated or otherwise estimated by finding the distance of our equation points from the best fit line. This may be represented as a straight line at right angles to the vertex and calculated using slope of the line. Mathematically, the tangent of the line is used to estimate its proximity to the relative equation of Linear Regression
The equation of a problem model in Linear Regression would be given as follows:

Here, β0 represents the bias coefficient, β1 represents the coefficient associated with the input variable xt , and εt represents the error term.
This same line is also called a plane or a hyper-plane when we are dealing with more than one input. This is often the case with
higher dimensional data. The model of Linear Regression is therefore, represented in the form of the equation and introverted and estimated values used for specific coefficients. However, before using this linear equation, we are faced with several issues. These issues often increase the complexity of the model making precise estimation difficult. This complexity is usually discussed in terms of the number of dependent and independent variables.The influence of the input variable on the model is effectively hampered when a particular coefficient becomes zero. Therefore, due to null values, the accuracy is reduced for the prediction made from the model (0 * x = 0). When we analyze regularization methods which are capable of modifying learning algorithm to reduce the complexity of models by emphasizing the importance on the absolute size of the coefficients, driving some to zero, this specific case becomes relevant.
B. Auto Regressive Integrated Moving Average (ARIMA)
ARIMA, short for AutoRegressive Integrated Moving Average, stands as a powerful tool in time series forecasting, offering two primary variants: seasonal ARIMA and non-seasonal ARIMA. For our stock data analysis, we adopt the non-seasonal ARIMA model, tailored to the unique characteristics of stock market data.
The ARIMA model relies on three essential parameters:
p (Autoregressive Component): This parameter determines the number of past observations used in the autoregressive calculation. For instance, with = 4 p=4, the model considers the previous four time steps to adjust the fitting line of the time series.
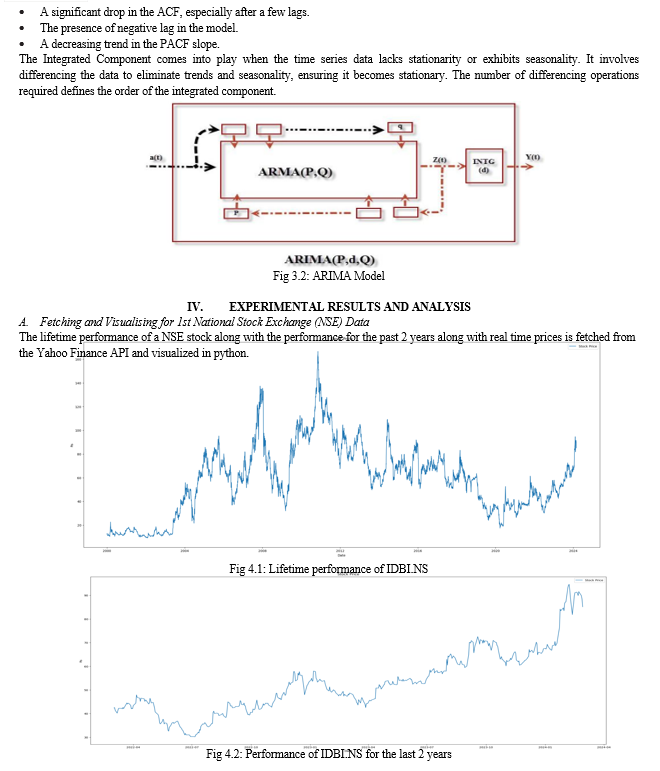
d (Integrated Component): In ARIMA, d represents the number of differencing operations applied to convert the relative time series into a standard time series. It specifies the count of differencing computations necessary to make the data stationary.
q (Moving Average Component): q denotes the lag of the error component, capturing the unexplained variation in historical data. It helps address residual errors not accounted for by the autoregressive and differencing components.
The Autoregressive Component relies on historical values, akin to classical linear regression. Its usage is determined by certain patterns observed in the autocorrelation function (ACF) and partial autocorrelation function (PACF). Specifically, the Autoregressive Component is utilized when:
- The ACF shows a decreasing slope towards zero.
- A positive correlation is observed at lag-1 in the ACF plot.
- The PACF exhibits a sudden drop to zero.
Moving Averages address random jumps in the data, which may span multiple periods, either consecutive or non-consecutive. Their application is guided by characteristics observed in the ACF and PACF plots:


Conclusion
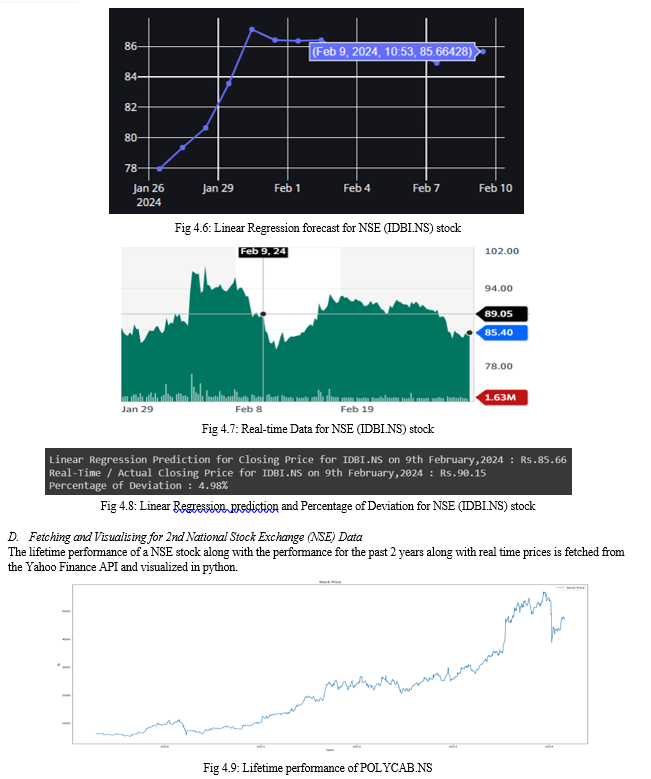
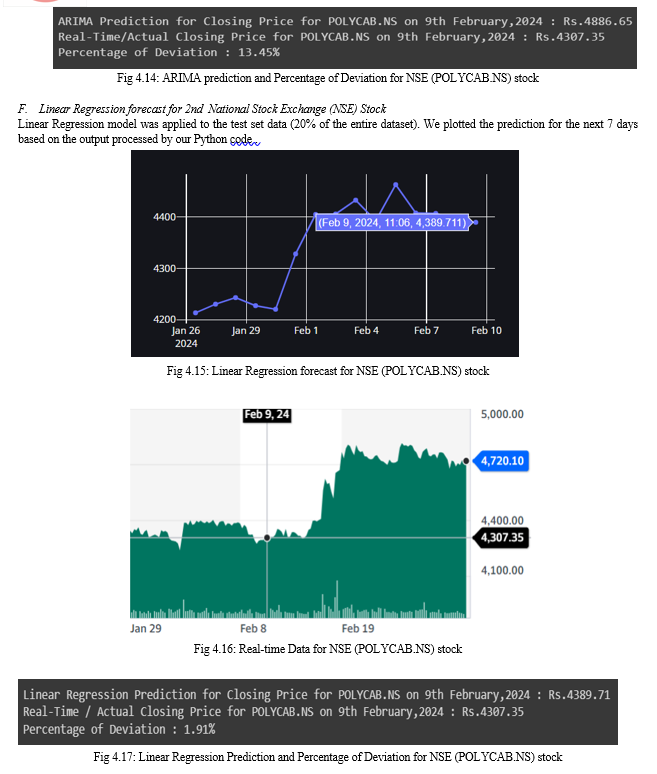
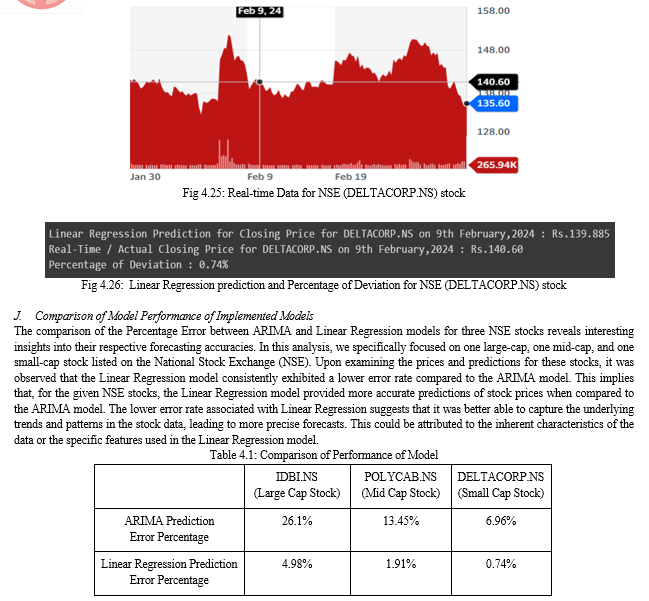
In conclusion, our analysis of the Percentage Error between ARIMA and Linear Regression models for three NSE stocks sheds light on their respective forecasting accuracies. Focusing on stocks across different market capitalizations on the National Stock Exchange (NSE), we found that the Linear Regression model consistently outperformed the ARIMA model in terms of accuracy. The superior performance of the Linear Regression model suggests its effectiveness in capturing the underlying trends and patterns present in the stock data, resulting in more precise predictions. This observation holds significance for investors and analysts seeking reliable forecasts for their investment decisions. Furthermore, our findings underscore the importance of selecting appropriate models and algorithms tailored to the characteristics of specific stocks and market indices. While ARIMA and Linear Regression models demonstrated varying levels of effectiveness for NSE stocks, the choice between these models should be informed by factors such as data characteristics, market dynamics, and investment objectives. Overall, our study underscores the utility of machine learning techniques in forecasting stock prices, offering valuable insights that can inform smarter investment decisions in the dynamic landscape of the stock market.
References
[1] P. D. Yoo, M.H. Kim and T. Jan, “Machine Learning Techniques and Use of Event Information for Stock Market Prediction” International Conference on Computational Intelligence for Modelling, Control and Automation and International Conference on Intelligent Agents, Web Technologies and Internet Commerce (CIMCA-IAWTIC\'06) Vienna, 2005, DOI: 10.1109/CIMCA.2005.1631572 [2] Hiransha M, Gopalakrishnan E.A, Vijay Krishna Menona andSoman K.P, “NSE Stock Market Prediction Using Deep-Learning Models” International Conference on Computational Intelligence and Data Science (ICCIDS 2018). DOI: 10.1016 (https://doi.org/10.1016/j.procs.2018.05.050) [3] Adebiyi A, Ariyo, Adewumi O. Adewumi and Charles K. Ayo, “Stock Price Prediction Using ARIMA Model” 2014 UKSim-AMSS 16th International Conference on Computer Modelling and Simulation, Cambridge, UK, 2014, DOI: 10.1109/UKSim.2014.67 [4] Nagaraj Naik and Biju R. Mohan, “Stock Price Movements Classification Using Machine & Deep Learning Techniques-The Case Study of Indian Stock Market”, Communications in Computer and Information Science book series (CCIS,volume 1000), May 2019, DOI:10.1007/978-3-030-20257-6_38 [5] Hedayati, Amin & Moghaddam, Moein & Esfandyari, Morteza. (2016). Stock market index prediction using artificial neural network:. Journal of Economics, Finance and Administrative Science. 10.1016/j.jefas.2016.07.002. [6] Ayodele A. Adebiyi., Aderemi O. Adewumi, “Stock Price Prediction Using the ARIMA Model”, IJSST, Volume-15, Issue-4. [Online]. Available :https://ijssst.info/Vol-15/No-4/data/4923a105.pdf [7] M. ?. Y. Kaya and M. E. Karsligil, \"Stock price prediction using financial news articles,\" 2010 2nd IEEE International Conference on Information and Financial Engineering, Chongqing, 2010, pp. 478-482.
Copyright
Copyright © 2024 Akash Mahendra Kushwaha , Ronit Rohit Malhotra, Nikhil Naresh Manchhani , Vansh Gopal Narwani. This is an open access article distributed under the Creative Commons Attribution License, which permits unrestricted use, distribution, and reproduction in any medium, provided the original work is properly cited.

Download Paper
Paper Id : IJRASET58704
Publish Date : 2024-02-29
ISSN : 2321-9653
Publisher Name : IJRASET
DOI Link : Click Here
 Submit Paper Online

