

Ijraset Journal For Research in Applied Science and Engineering Technology
Stress Detection using Machine Learning and Deep Learning
Authors: Sunil Kumar Rawat, Ankit Kumar
DOI Link: https://doi.org/10.22214/ijraset.2024.66029
Certificate: View Certificate
Abstract
Stress is a regular phenomenon in modern day international, and it causes human beings to respond to a selection of things, resulting in physiological and behavioral adjustments. If we maintain stress in our minds for too lengthy, it\'s going to have an effect on our our bodies. Many health situations related to pressure can be prevented if pressure is detected sooner. while a person is burdened, a sample may be detected the usage of various bio-signals such as thermal, electrical, impedance, acoustic, optical, and so forth, and stress degrees may be recognized the usage of these bio-indicators. This paper makes use of a dataset that was obtained the use of a web of things (IOT) sensor, which brought about the gathering of records about a real-lifestyles state of affairs involving a person\'s intellectual fitness. To achieve a pattern for strain detection, information from sensors inclusive of the Galvanic pores and skin reaction Sensor (GSR) and the Electrocardiogram (ECG) had been amassed. The dataset will then be categorised the use of Multilayer Perceptron (MLP), choice Tree (DT), okay-Nearest Neighbor (KNN), assist Vector system (SVM), and Deep getting to know algorithms (DL). Accuracy, precision, don\'t forget, and F1-rating are used to assess the statistics\'s performance. ultimately, selection Tree (DT) had the first-class performance where DT have accuracy 95%, precision ninety six%, recollect 96% and F1-rating ninety six% among all machine learning classifiers.
Introduction
I. INTRODUCTION
Stress is something that concerns our lives. There are many variables in our day-to-day life that are tension. Human environments, like worksite, home, or society, may somehow inflict stress on a person.
According to Palmer [1], "Stress is defined as a complex psychological and behavioral condition when the person's demands are imbalanced and the way demands are met."
Also, the American Institute of Stress found that 80% of workers experience stress in their everyday work and need support in managing stress.
Based on Ahuja and Banga [2], study recorded major suicide cases among students aged 15-29 due to stress. There are 8934 cases recorded in 2015, and study was inspired to identify stress in early stages.
These figures and stress effects on people, which has been the leading cause of many diseases like hypertension, sleep deprivation, and others. Stress that cannot be adequately treated can lead to serious cases where one person committed suicide. This is vital to identify and control stress before it becomes severe.
Many researchers investigate stress detection in many fields. This paper will elaborate on stress identification based on five conditions using data obtained using IoT sensors. Early detection can help track tension, and different machine learning and deep learning approaches have been explored and compared.
II. RELATED RESEARCH WORKS
Many studies are being conducted to identify tension or depressed individuals. Table 1 shows some previous related research work focused on the stress detection scheme, where some researchers use the public dataset and some researchers collect their own dataset [3-12].
Table 1. Previous Related Research Works.
|
Ref |
Title |
Dataset |
Result |
|
|
[3] |
Stress Detection with Machine Learning and |
Public dataset WESAD dataset |
Achieved accuracy 95.21% using |
84.32% and RF, DT, |
|
|
Deep Learning using |
|
AdaBoost, KNN, |
LDA, SVM |
|
|
Multimodal |
|
and DL |
|
|
|
Physiological Data |
|
|
|
|
[4] |
Stress Detection through Speech |
Public Dataset Ryerson Audio-Visual Database |
CNN- Achieved 94.26%-94.3% |
accuracy |
|
|
Analysis using |
of Emotional Speech |
|
|
|
|
Machine Learning |
and Song (RAVDESS) dataset |
|
|
|
[5] |
Introducing WESAD, a Multimodal Dataset for |
Public dataset WESAD dataset |
Accuracy of 80% and 93% (two |
(three class) class) was |
|
|
Wearable Stress |
|
achieved using |
RF, DT, |
|
|
and Affect Detection |
|
AdaBoost, KNN, |
LDA, and |
|
|
|
|
SVM |
|
|
[6] A Machine Learning |
Private Dataset |
AIC- 782.8842 (Logit model) |
||
|
Approach for Stress |
Collected own dataset using |
AIC- 781.6256 (Probit model) |
||
|
Detection using |
FITBIT device and analysis |
AIC-786.8999 (Complementary |
||
|
a Wireless Physical |
using ANOVA |
Log-Log model) |
||
|
Activity Tracker |
|
|
||
|
|
|
*lower AIC, the better of model |
||
|
[7] Machine Learning and |
Private Dataset |
LR-66% |
||
|
IoT for prediction and |
Collected own dataset and |
SVM-68% |
||
|
detection of stress |
classified using Python |
|
||
|
[8] Machine Learning- |
Private Dataset |
KNN classifier- Achieved |
||
|
based signal |
Collected own dataset based on |
accuracy 92.06% |
||
|
processing using |
heart rate, EMG, GSR hand and |
SVM- Achieved accuracy |
||
|
physiological signals |
foot data, respiration and |
96.82% |
||
|
for stress detection. |
classified using WEKA |
|
||
|
[9] Stress detection using wearable physiological |
Private Dataset Collected own dataset from BN- |
SVM- Achieved accuracy 82% |
||
|
sensors |
PPGED |
|
||
|
[10] Emotion Recognition |
Private Dataset |
KPCA reduce the features and |
||
|
Based on Multichannel |
Collected own dataset based on |
GBDT for classifier- Achieved |
||
|
Physiological Signals |
the ECG,GSR,EMG |
accuracy 93.42% |
||
|
with Comprehensive |
|
|
||
|
Nonlinear Processing |
|
|
||
|
[11] Emotion Recognition by Heart Rate |
Public Dataset MAHNOB dataset |
SVM- Achieved accuracy 48.5% |
||
|
Variability |
|
|
||
|
[12] Classification of |
Private Dataset-SAID Dataset |
ANN- Achieved Mean accuracy |
||
|
Physiological Signals |
Collected own dataset using |
75.8% and standard deviation of |
||
|
for Emotions |
ECG and GSR |
accuracy 11.38% |
||
|
Recognition using IOT |
SAID Dataset |
|
||
|
Abbreviations RF=Random Forest, SVM=Support Vector Machine, KNN= k-Nearest Neighbour, DT=Decision Tree, AdaBoost =Adaptive Boosting, LDA= Linear Discriminant Analysis, DL=Deep Learning, LR= Logistic Regression, CNN=Convolutional Neural Network, AIC= Akaike information criterion ANN=Artificial Neural Network, KPCA=Kernel Principal Component Analysis, GBDT=Gradient Boosting Decision Tree () |
||||
III. RESEARCH METHODOLOGY
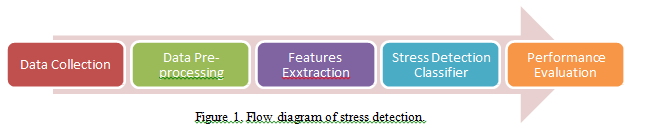
The research methodology used to conduct the analysis for this paper is detailed below. The paper's primary contribution is the identification of stress using machine learning and deep learning. The flow diagram below illustrates the proposed work on stress detection using machine learning and deep learning. This can be summarized in five steps.
A. Dataset Preparations
There are three method to collect data such as interview/questionnaire, sensor measuring method and collection of social media. This paper used dataset comes sensors were it been collected at Indian Institute of Information Technology (IITA). The dataset was gathered using a sensor included in the MySignals Healthcare Toolkit. MySignals is a forum for medical device and e-Health application creation. The MySignals toolkit includes an Arduino Uno board and a variety of sensor ports. The sensors were attached to the MySignals Hardware package (which includes an Arduino) and programmed using the Arduino SDK.
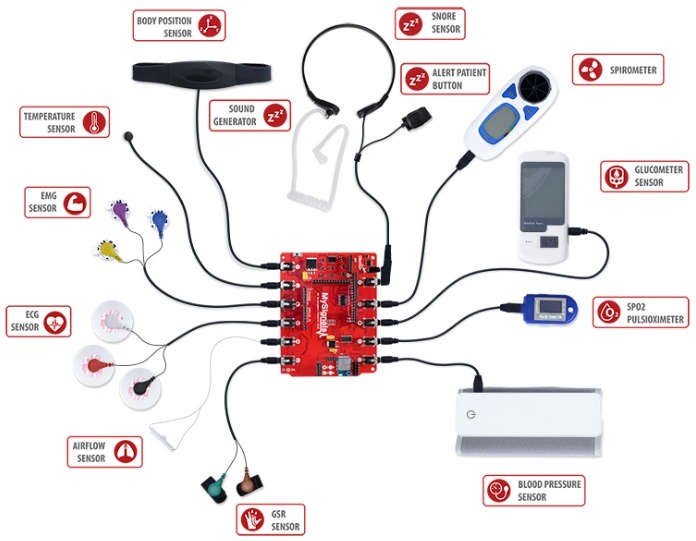
Figure 2. MySignals toolkit.
B. Dataset Acquisitions
The Galvanic Skin Response (GSR) and Electrocardiogram (ECG) sensors were used to collect data from 252 participants, a combination of male and female students ranging in age from 20 to 22 years. The tests took place in closed and quit locations. Each participant is required to watch 18 videos from a list of YouTube videos ranging in length from 2 to 5 minutes. Throughout the video playback, MYSignal toolkits were used to record Galvanic Skin Response (GSR) and Electrocardiogram (ECG) sensors. Following that, participants were given a response form to complete about their emotional rate at the end of each video session. After pre-processing the raw data from MYSignal, the Mean, Median, Standard deviation, Minimum reading, Maximum reading, Max Ratio, and Min Ratio are extracted to obtain the best features. Next after data collection and pre-processing, the processed data was analysed using a machine learning classifier to predict the users' mental states and to comprehend their physiological characteristics under various conditions. This dataset is referred to as the Stress Analysis using IOT Device Data Set (SAID).
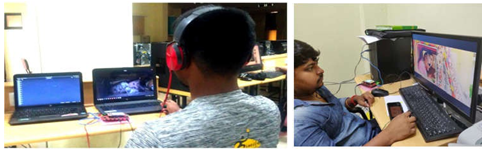
Figure 3. Experiments Setup for each participant.
C. Classification Algorithm
The classification algorithms is method to detect stress level in SAID dataset which is been categorized into four classes as 0, 1, 2 and 3 as ‘Relax’, ‘Stressed’, ‘Partially Stressed’ and ‘Happy’ respectively as illustrated in Figure 4.
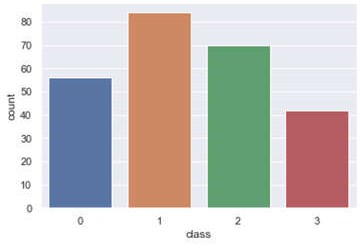
Figure 4. Count of each class for SAID dataset.
Classification algorithm been used in this paper are Multilayer Perceptron (MLP), Decision Tree (DT), K- Nearest Neighbor (KNN), Support Vector Machine (SVM) and Deep Learning (DL). The dataset is split into two parts: 70% for training and 30% for research. The following subsection will discuss the machine learning algorithms used in this experiment and how their parameters were set for each classifier.
1) Multilayer Perceptron (MLP): MLP is the popular and mostly used in most research area. MLP has input and will be transmitted inside MLP layer called as hidden layer in one direction to be classified as output. There are no loops, thus it will not affect the output of each neurons. The parameter setting for MLP is summarized below using Table 2.
Table 2. MLP Parameter Setting.
Parameter Parameter Setting
|
hidden_layer_sizes 100 |
|
learning_rate_init 0.001 |
activation relu
momentum 0.9
|
solver adam |
2) Decision Tree (DT): Decision tree builds classification models in the form of a tree structure. It breaks down a dataset into smaller and smaller subsets while at the same time an associated decision tree is incrementally developed. The final result is a tree with decision nodes and leaf nodes based on their class dataset [3]. The parameter setting for DT is summarized below using Table 3.
|
criterion gini |
Table 3. Decision Tree Parameter Setting. Parameter Parameter Setting
min_samples_leaf 1
|
min_samples_split 2 |
3) K- Nearest Neighbour (KNN): KNN is a class membership where it will group the dataset based on their classes whether it belong to group a or group b. KNN works by allocated data based on the nearest neighbours which one is its k closest neighbours (k is a positive number and a small number). If k = 1, then the data will be allotted to the group a or b based on closest neighbour [2]. Table 4 shows parameter setting for KNN.
Table 4. K- Nearest Neighbour Parameter Setting.
|
n_neighbor 5 |
Parameter Parameter Setting
weights uniform
|
leaf_size 30 |
metric minkowsk
4) Support Vector Machine (SVM): SVM works upon the ideal hyper plane and still effective in high dimensional spaces. In 2-Dimensional data, SVM will try to classify based on dataset classes [2]. Table 5 shows parameter setting for SVM.
Table 5. SVM Parameter Setting.
Parameter Parameter Setting
|
C 1.0 |
|
degree 3 |
kernel rbf
decision_function_shape one-vs-rest (‘ovr’)
5) Deep Learning (DL): Deep learning has many layers of the processing units for the input of the dataset. Each layer has massive sub-layers of hidden layers. This algorithm is not only for supervised but also applicable for unsupervised classification problem [3]. The deep learning layer architecture are show in Figure 5 below:
Layer (type) Output Shape Param #
=================================================================
|
dense_402 (Dense) |
(None, |
14) |
210 |
|
dropout_58 (Dropout) |
(None, |
14) |
0 |
|
dense_403 (Dense) |
(None, |
100) |
1500 |
dropout_59 (Dropout) (None, 100) 0
dense_404 (Dense) (None, 4) 404
=================================================================
Total params: 2,114
Trainable params: 2,114
Non-trainable params: 0
Figure 5. Deep learning layer architecture.
D. Performance Evaluation
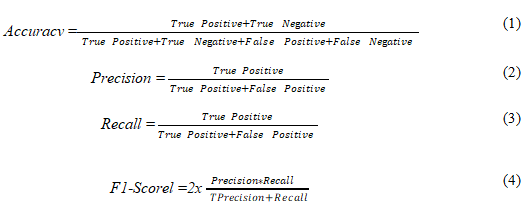
Several performance evaluation metrics are identified to be used to evaluate the performance of the stress detection model [13]. These metrics are accuracy, precision, recall and F1-Score are shown below:
IV. EXPERIMENTAL RESULTS AND DISCUSSIONS
The main goal of this paper is to detect stress level in SAID dataset. The dataset has been spitted into training dataset contain 70% and testing dataset contain 30% as shown in Figure 6. In this experiments Multilayer Perceptron (MLP), Decision Tree (DT), K- Nearest Neighbor (KNN), Support Vector Machine (SVM) and Deep Learning (DL) are been used and been detailed up in Table 2. Table 6 also shows that the accuracy has reached up 79% until 96% for SAID dataset. Based on the result from Table 6 below, Support Vector Machine (SVM) had the overall worst performance where SVM have accuracy 79%, precision 81%, recall 75% and F1-score 77%, whereas Decision Tree (DT) had the best performance where DT have accuracy 95%, precision 96%, recall 96% and F1-score 96% among all machine learning classifiers.
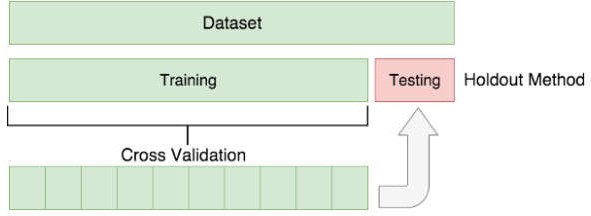
Figure 6. Training/Testing and Cross Validation use in these experiments to overcome overfitting problem.
Table 6. Experimental Result.
|
Classifier |
Accuracy |
Precision |
Recall |
F1-Score |
|
Support Vector Machine (SVM) |
79% |
81% |
75% |
77% |
|
K- Nearest Neighbor (KNN) |
82% |
79% |
78% |
78% |
|
Multilayer Perceptron (MLP) |
86% |
84% |
87% |
85% |
|
Deep Learning (DL) |
91% |
92% |
91% |
91% |
|
Decision Tree (DT) |
95% |
96% |
96% |
96% |
In can be concluded that using Decision Tree give the best result compared to other machine learning techniques. Decision Tree have several advantages such as the output are easy to read and assign specific values to each problem, decision path and the outcome of the output. Based on the learning curve it also show that using Decision Tree are suitable for this dataset where there is no under fitting and over fitting cases when training the model using Decision Tree algorithm.
From the previous study, Tiwari et.al, 2019 [12], using Artificial Neural Network as the classifier and getting result Mean of Accuracy 73.58% and Standard Deviation of ANN model accuracy is 11.38%. From this, we can make a conclusion that using other machine learning from our experiments are better compared to previous studies. By choose a better classifier could improve the efficiency when training the model.
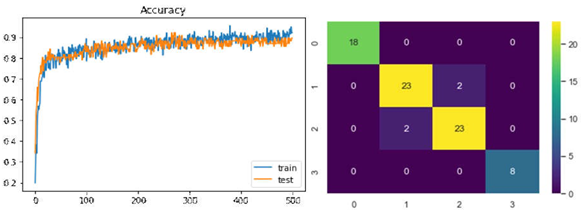
Figure 7. Learning curve for training (Cross Validation=10) and confusion matrix using Decision Tree.
Conclusion
In this paper, it can conclude that using suitable classifier will get better result in accuracy, precision, recall and F1-Score. From experiments results, it shows some significant value where DT achieved the best resulting on accuracy 95%, precision 96%, recall 96% and F1-score 96%. The results prove that the using DT has a competitive performance compared to the others classifiers for detecting stress and non- stress and classifying stress levels. Further work can be done by using more classifier and applied 10- fold cross validation.
References
[1] Ahuja R and Banga A 2019 International Conference on Pervasive Computing Advances and Applications – PerCAA 2019 125 349-353 [2] Bobade P and Vani M 2020 Proceedings of the Second International Conference on Inventive Research in Computing Applications (ICIRCA-2020) 51-58 [3] Vaikole S Mulajkar S More A Jayaswal P and Dhas S 2020 International Journal of Creative Research Thoughts (IJCRT) 8 5 2239-44 [4] Padmaja B Rama Prasad V V and Sunitha K V N 2018 International Journal of Machine Learning and Computing 8 1 33-38 [5] Pandey P S 2017 2017 17th International Conference on Computational Science and Its Applications (ICCSA) [6] Sandulescu V Andrews S Ellis D Bellotto N and Mozos O M 2015 International Work-Conference on the Interplay Between Natural and Artificial Computation 526-532 [7] Tiwari S Agarwal S Muhammad Syafrullah and Adiyarta K 2019 Proc. EECSI 2019 - Bandung, [8] Indonesia 6 107-111 [9] Zainudin Z Shamsuddin S M and Hasan S 2019 The International Conference on Advanced Machine Learning Technologies and Applications (AMLTA2019) 921 43-51
Copyright
Copyright © 2024 Sunil Kumar Rawat, Ankit Kumar. This is an open access article distributed under the Creative Commons Attribution License, which permits unrestricted use, distribution, and reproduction in any medium, provided the original work is properly cited.

Download Paper
Paper Id : IJRASET66029
Publish Date : 2024-12-20
ISSN : 2321-9653
Publisher Name : IJRASET
DOI Link : Click Here
 Submit Paper Online