Ijraset Journal For Research in Applied Science and Engineering Technology
- Home / Ijraset
- On This Page
- Abstract
- Introduction
- Conclusion
- References
- Copyright
Structural and Optical properties of Green and Chemical synthesized Tin Sulfide for Dye Sensitized Solar Cells Applications
Authors: C. N. Omprakash Anand, A. T. Rajamanickam, K. Shanmugasundaram, K. Manikantan
DOI Link: https://doi.org/10.22214/ijraset.2024.63477
Certificate: View Certificate
Abstract
The structural and optical properties of nanoparticles perform a crucial role in generating highly effective dye-sensitized solar cells. This study focuses on the synthesis of Tin Sulfide (SnS) nanoparticles using both Green and chemical methods. The SnS nanoparticles are then characterized using several analytical techniques, including X-ray Diffraction (XRD), Field Emission Scanning Electron Microscopy (FESEM), X-ray fluorescence (XRF) and UV-Visible spectroscopy. The XRD examination indicated the existence of an Orthorhombic SnS structure in both C:SnS and G:SnS nanoparticles. The crystallite size was found to be 13 nm for C:SnS and 5 nm for G:SnS, suggesting that the synthesized material is in the nanoscale range. The FESEM imaging revealed the presence of a spherical form in both nanoparticles. XRF confirmed the existence of Sn and S elements while also confirming the lack of any other impurities, so verifying the purity of the nanoparticles. The UV-visible spectroscopy results showed that the band gap energy for C:SnS was 2.40 eV, while for G:SnS it was 2.28 eV. The J-V characteristic curve of chemically synthesized SnS demonstrates power conversion efficiency of 5.13%, whereas the Green Synthesized SnS reveals an efficiency of 5.57%. This indicates that both materials have potential uses in DSSC devices.
Introduction
I. INTRODUCTION
The growing need for renewable energy sources has stimulated the investigation of innovative materials with the ability to capture solar energy. Among the various options, dye-sensitized solar cells (DSSCs) have emerged as a promising approach, offering benefits such as simplicity in manufacturing and cost efficiency [1-3]. One material of particular interest in this context is tin sulfide (SnS), a semiconductor known for its favorable electrical and optical characteristics. The inclusion of green synthesized SnS further enhances its potential by allowing for the customization of its properties, potentially improving its efficiency in converting solar energy [4].
Tin sulfide, composed of tin and sulfur, boasts a crystalline structure with advantageous electrical properties, including a small bandgap and suitable energy levels, making it highly effective for sunlight absorption in photovoltaic systems [5]. A thorough understanding of the intrinsic properties of SnS is crucial for harnessing its capabilities in DSSCs. Cadmium doping introduces additional elements into the SnS crystal lattice, thereby altering its electrical structure. This modification aims to enhance properties such as charge transport and light absorption, ultimately boosting the performance of SnS in solar cells [6]. The synergy between tin sulfide and cadmium doping holds significant promise for achieving higher efficiency in DSSCs.
The performance of semiconductor materials in electrical and optoelectronic devices is heavily influenced by their structural, morphological, and optical characteristics. In the context of dye-sensitized solar cells, comprehending these features is essential to maximize energy conversion efficiency [7-8]. This work delves into an examination of the structural, morphological, and optical properties of both green and chemically synthesized tin sulfide (SnS) with a primary focus on their application in dye-sensitized solar cells.
II. MATERIALS AND METHODS
A. Materials and Chewmicals
Stannous chloride, sodium sulfide flakes, and distilled water, were procured from Merck and used without additional purification. The leaves of Nerium oleander were obtained from their native habitats in Coimbatore, Tamil Nadu.
Afterwards, the collected leaves were subjected to a meticulous cleansing procedure, then dried in the shade, ground into powder, and extracted using a soxhlet device. The solvent used for extraction was methanol, with a ratio of 1:15. The extraction procedure was conducted for a duration of 21 hours. Ultimately, the acquired extracts were preserved at a temperature of 4°C for further examination.
B. Preparation of Chemical and Green Synthesized Tin Sulfide (SnS)
Firstly, a solution was made by combining stannous chloride with distilled water in a 1:1 M ratio, with a concentration of 0.1 M stannous chloride in 100 ml of water. Afterwards, a 0.1 M solution of sodium sulfide was added slowly and in small amounts while stirring continuously at a temperature of 60 °C. The solution was agitated for a duration of 3 hours to promote the creation of SnS nanoparticles. Subsequently, the solution was subjected to drying at a temperature of 80 °C for a duration of roughly 12 hours in a hot-air oven. The desiccated samples were pulverized using a mortar and pestle to get a fine powder. Subsequently, the fine powders acquired were subjected to further drying at a temperature of 400 °C for a duration of 3 hours in a muffle furnace to completely remove any remaining beginning precursors.
A solution was made by mixing stannous chloride and sodium sulfide in a 1:1 molar ratio in 100 ml of distilled water in a separate beaker. The mixture was continuously stirred at a temperature of 60 °C. Subsequently, a solution consisting of 100 mL of Nerium oleander leaves extract was slowly added drop by drop while continuously stirring at a temperature of 60 °C. The solution obtained was agitated for a duration of 3 hours. Subsequently, the resultant solution was transferred to a Sonicator chamber for a period of 60 minutes to facilitate the production of SnS nanoparticles using a green synthesis process. Afterwards, the solution was dried at a temperature of 80 °C for roughly 12 hours in a hot-air oven. The desiccated samples were carefully pulverized using a mill and pestle to get a fine powder. Subsequently, the fine powders were subjected to further drying at a temperature of 400 °C for a duration of 3 hours in a muffle furnace to remove any remaining beginning precursors. For comparative analysis, chemical Synthesized SnS called C:SnS and Green Synthesized SnS called G:SnS respectively.
C. Characterization Techniques
The synthesized samples were subjected to several characterisation analyses. An X-ray diffraction (XRD) examination was performed using an XPERT-PRO equipment. The analysis used CuKα radiation with a wavelength of 1.54060Å. The samples were analyzed using field emission scanning electron microscopy (SIGMA HV-Carl ZEISS) to examine their surface morphology and elemental composition. The microscope was connected with a Bruker Quantax 200-Z10 EDS detector. The optical characteristics of the samples were assessed using a Hitachi-UH5300 dual-beam UV-Vis spectrometer, which measured wavelengths ranging from 200 to 900 nm. The IV measurement was conducted using a Keithley 2400 source meter and a Newport solar simulator (model no. 91160) equipped with an AM 1.5 G spectrum supply.
III. RESULT AND DISCUSSIONS
A. Characterization Analysis of Chemical and Green Synthesized SnS
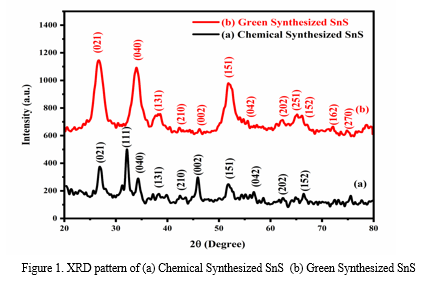
Figure 1 presents the XRD patterns of SnS nanoparticles synthesized through chemical and green methods. The chemically synthesized SnS nanoparticles show distinct diffraction peaks at 2θ angles of 27.31°, 31.45°, 31.93°, 39.03°, 42.50°, 45.47°, 51.12°, 56.64°, 63.17°, and 66.53°, corresponding to the crystallographic planes (021), (111), (040), (131), (210), (002), (151), (042), (202), and (152), respectively. In contrast, the green synthesized SnS nanoparticles exhibit peaks at 27.24°, 31.73°, 39.11°, 42.48°, 45.49°, 51.03°, 56.42°, 63.11°, 64.20°, 66.39°, 72.79°, and 73.51°, which correspond to the planes (021), (040), (131), (210), (002), (151), (042), (202), (251), (152), (162), and (270), respectively. Both synthesis methods confirm the orthorhombic SnS structure, as indicated by the alignment with JCPDS Card No: 39-0354 [9]. Notably, the green synthesized SnS demonstrates broader and more intense diffraction peaks, suggesting superior crystal quality compared to the chemically synthesized nanoparticles. The enhanced quality of the crystals is ascribed to the existence of secondary metabolisms from extracts of Nerium oleander leaves, which function as stabilizing factors for the formation of SnS crystals. The average crystallite size was determined using Scherrer's formula [10] and was found to be 13 nm for the C:SnS samples and 5 nm for the G:SnS samples.
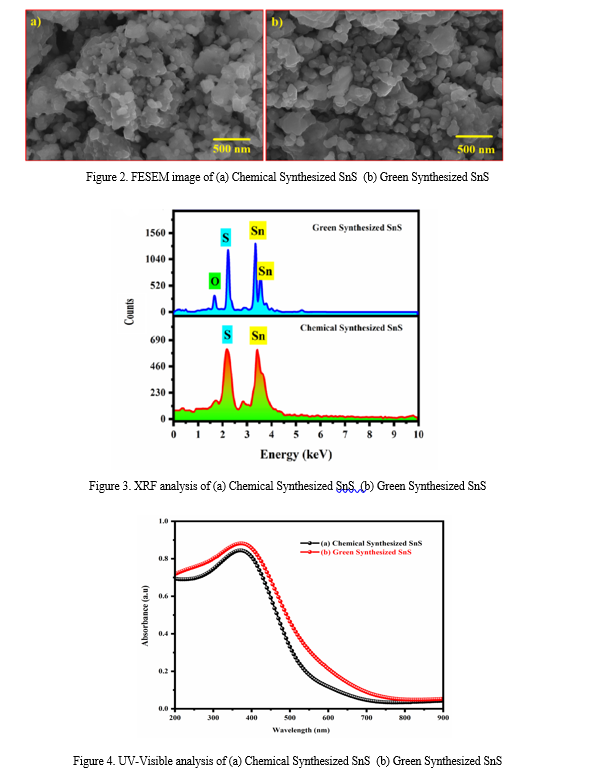
Field Emission Scanning Electron Microscopy (FESEM) is an advanced technique designed to capture high-resolution images of the surface structure of various materials. Figure 2 (a-b) presents FESEM images that illustrate the morphological characteristics of SnS nanoparticles synthesized via chemical and green methods. The micrographs reveal that both samples exhibit a consistent spherical morphology.
The images highlight the uniformity and fine details of the nanoparticles' surface, providing a comprehensive understanding of their structural attributes. This consistency in shape suggests that both synthesis methods effectively produce spherical SnS nanoparticles, with potential implications for their application in various technological fields.
The elemental composition of tin sulfide (SnS) synthesized using chemical methods, green-synthesized SnS, and green-synthesized tin cadmium sulfide (SnCdS) was accurately evaluated using X-ray fluorescence (XRF) analysis. The results are displayed in Figure 3. The XRF spectra for chemically synthesized SnS (Figure 3A) show distinct peaks corresponding to tin (Sn) and sulfur (S), with no other visible peaks. This absence of additional peaks confirms the lack of impurities, indicating the high purity of the SnS particles in their crystalline form. In contrast, the XRF spectra for green-synthesized SnS (Figure 3B) also display clear peaks for tin (Sn) and sulfur (S), along with an additional peak attributed to oxygen. The presence of this oxygen peak suggests the incorporation of plant extract molecules during the green synthesis process, reflecting the unique characteristics of the green-synthesized SnS. Overall, the XRF analysis highlights the purity and compositional differences between chemically synthesized and green-synthesized SnS, with the latter showing evidence of additional elements introduced through the green synthesis method.
UV-Visible spectroscopy is a highly effective method frequently employed to examine the optical characteristics of materials, particularly in the ultraviolet (UV) and visible regions of the electromagnetic spectrum. This technique was used to study the optical properties of SnS nanoparticles synthesized via chemical and green methods, across a spectrum ranging from 200 to 900 nm. For chemically synthesized SnS (Figure 4A) the optical absorbance covers the UV-Visible spectrum and exhibits a distinct absorption peak at approximately 500 nm. This notable absorption peak allows for the calculation of the band gap, which reflects the transition of electrons from the valence band to the conduction band. The observed absorption peak aligns with known literature values for SnS and is significantly lower than the bulk value of SnS, indicating the influence of nanoscale effects on its optical properties [11]. In contrast, the UV-Visible emission spectrum of green-synthesized SnS (Figure 4B) shows a prominent absorption slope at around 550 nm, which becomes more pronounced over time. This absorption spectrum emphasizes the material's response within the ultraviolet-visible range, particularly in the green area. Figure 5 shows Tauc plot of prepared SnS samples and findings reveal that the band gap energy for chemically synthesized C:SnS is 2.40 eV, whereas for green-synthesized G:SnS it is slightly lower at 2.28 eV. This slight difference in band gap energies suggests that the green synthesis method slightly alters the electronic structure of SnS, potentially due to the incorporation of plant extract molecules or other factors inherent to the green synthesis process[12].
B. Photovoltaic Performances of Chemical and Green Synthesized SnS
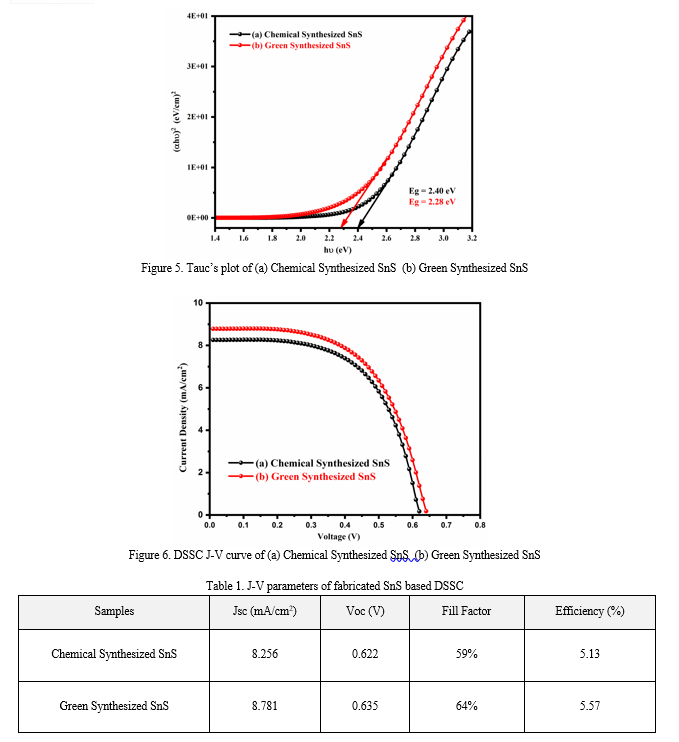
The photovoltaic performance of Dye-Sensitized Solar Cells (DSSCs) was evaluated using current-voltage (J-V) characteristic curves, measured with a Keithley 2400 source meter and a Newport solar simulator connected to an AM 1.5 G spectrum power source. Ruthenium N71 dye extracts were utilized as sensitizers in the experiments.
Figure 6A shows the J-V characteristic curve for chemically synthesized SnS, which exhibits a short-circuit current density (Jsc) of 8.256 mA/cm², an open-circuit voltage (Voc) of 0.622 V, a fill factor (FF) of 59%, and a power conversion efficiency (PCE) of 5.13%. When Nerium oleander leaf extracts were used in the synthesis of SnS nanoparticles for the photoanode (Figure 6B), the DSSC performance improved. The short-circuit current density increased to 8.781 mA/cm², the open-circuit voltage rose to 0.635 V, the fill factor improved to 64%, and the power conversion efficiency increased to 5.57%. These results provide compelling evidence that incorporating green-synthesized SnS nanoparticles enhances DSSC properties. The improvements can be attributed to the broader light absorption spectrum and smaller bandgap of the green-synthesized nanoparticles, which lead to the generation of more electrons and a reduction in recombination events[13]. Furthermore, the use of Nerium oleander leaf extracts in the synthesis process allows for the production of SnS nanoparticles with controlled size and morphology, optimizing their light absorption capabilities.
This study aims to conduct a thorough analysis of the characteristics of the Dye-Sensitized Solar Cell (DSSC), with a special emphasis on the composite photoanode that is sensitized by natural dye. The focus will be on comparing this kind of DSSC with other devices that have been previously described in scientific literature [14]. The Green Synthesized SnS photoanode has exceptional performance in several parameters. The excellence of our technique may be due to numerous special intrinsic traits. An important component that contributes to the exceptional performance of our DSSC is the use of a natural dye that does not undergo any further procedures such as dilution or heating. This distinctive characteristic enables the dye molecules to maintain their natural activity completely. Therefore, the unchanged condition of the natural dye contributes to the improvement of the overall effectiveness of the photoanode [15]. These factors collectively underscore the positive impact of incorporating green-synthesized SnS nanoparticles on the performance characteristics of DSSCs, leading to enhanced photovoltaic efficiency.
IV. ACKNOWLEDGMENTS
The authors would like to express their sincere gratitude to the Department of Electronics, Sri Ramakrishna Mission Vidyalaya College of Arts and Science, Coimbatore for generously providing the necessary research facilities for this study.
Funding Source
This research did not receive any specific grant from funding agencies in the public, commercial, or not-for-profit sectors.
Conflict of Interest
The authors declare that there are no conflicts of interest regarding the publication of this manuscript.


Conclusion
In conclusion, Tin Sulfide (SnS) nanoparticles were synthesized by using both Green and chemical methods. These findings highlight the positive impact of incorporating green-synthesized SnS nanoparticles in DSSCs. The improvements in photovoltaic performance can be attributed to the broader light absorption spectrum and smaller bandgap of green-synthesized nanoparticles, leading to more electron generation and reduced recombination events. Additionally, using Nerium oleander leaf extracts in the synthesis process results in SnS nanoparticles with controlled size and morphology, optimizing light absorption capabilities. This study emphasizes the superior performance of DSSCs utilizing green-synthesized SnS nanoparticles, showcasing their potential for enhanced photovoltaic efficiency due to the unique properties conferred by the green synthesis method.
References
[1] Bronusiene, A.; Barauskiene, I.; Popov, A.; Ancutiene, I. Sustainable Chemistry and Pharmacy, 2023, 34, 101150. [2] Kafashan, H.; Rabiei Baboukani, A. Ceramics International, 2024, 50, 5717-5727. [3] Cheraghizade, M.; Jamali-Sheini, F. Optik, 2022, 254, 168635. [4] Bano, S.; Khan, M. I.; Albalawi, H.; Islam, G. ul; Siddique, M.; Ahmad, T.; Alkhaldi, H.; ben farhat, L.; Ahson, R.; Hussain, S. Journal of Materials Research and Technology, 2022, 19, 1982-1992. [5] Agoro, M. A.; Meyer, E. L; Results in Chemistry, 2023, 5, 100690. [6] Banotra, A.; Padha, N; Journal of Crystal Growth, 2020, 534, 125460. [7] Mousavi, S. L.; Jamali-Sheini, F.; Sabaeian, M.; Yousefi, R. Solar Energy, 2020, 199, 872-884. [8] Reddy, V. M.; Gedi, S.; Park, C.; Miles, R. W.; Reddy, K. T. R; Current Applied Physics, 2015, 15(5), 588-598. [9] Miles, R. W.; Ogah, O. E.; Zoppi, G.; Forbes, I. Thin Solid Films, 2009, 517(17), 4702-4705. [10] Jaffar, R.; Khan, M. I.; Mustafa, G. M.; Ali, S. S.; Ben Farhat, L.; Elqahtani, Z. M.; Alwadai, N. Optical Materials, 2022, 133, 112964. [11] Gowdhaman, P.; Praveen, V. N.; Sudar Saravanan, R. S.; Venkateswari, P.; Pandya, H. M. Optical Materials, 2021, 120, 111465. [12] Miao, F.; Chu, F.; Sun, B.; Tao, B.; Zhang, P.; Zang, Y.; Chu, P. K. Journal of Materials Research and Technology, 2022, 21, 704-711. [13] Sakthi, P.; Uma, J.; Siva, C.; Balraj, B. Optical Materials, 2022, 132, 112759. [14] Luo, J.; Liu, J. C.; Zhao, Z. Q.; Sun, S. H.; Zhu, Y.; Hu, Y. M. Materials Letters, 2022, 309, 131309. [15] Cui, X.; Xu, W.; Xie, Z.; Wang, Y. Electrochimica Acta, 2015, 186, 125-132.
Copyright
Copyright © 2024 C. N. Omprakash Anand, A. T. Rajamanickam, K. Shanmugasundaram, K. Manikantan. This is an open access article distributed under the Creative Commons Attribution License, which permits unrestricted use, distribution, and reproduction in any medium, provided the original work is properly cited.

Download Paper
Paper Id : IJRASET63477
Publish Date : 2024-06-27
ISSN : 2321-9653
Publisher Name : IJRASET
DOI Link : Click Here
 Submit Paper Online

