Ijraset Journal For Research in Applied Science and Engineering Technology
- Home / Ijraset
- On This Page
- Abstract
- Introduction
- Conclusion
- References
- Copyright
Study of Traffic Congestion Analysis on Urban Road: A Case Study of Indore City
Authors: Muskan Gangwal, Dr. H. K. Mahiyar
DOI Link: https://doi.org/10.22214/ijraset.2025.66729
Certificate: View Certificate
Abstract
The traffic congestion is the one of the most wide spread and world wide problem. Traffic has serious negative effect on the economy, society and environment. jawaharmarg is a key arterial road with a mix of commercial and residential building\'s. The road consists of intersections with traffic signals. The road experiences heavy congestion, especially during rush hours due to the presence of specific factors, such as shopping centers, schools, office buildings etc. Findings the traffic volume on jawahrmarg road in Indore is the goal of this paper. The study draws attention to the problem, including congestion come with more traffic. This paper studied traffic on the main road in Indore that runs between rajmohalla to chhotigwaltoli road which approximately 3.20km long. Traffic congestion is a result of the city focused development, continuing population growth and an increase in the number of vehicle/capacity ratio of less than 1,but as traffic grows, they may soon reach their peak .E or F have been determined to be the LOS. We perform a regression analysis in SPSS (Statistical package for social science ) Software to predict regression equation for future prediction if needed. The regression analysis is done to demonstrate correlation in dependent and independent variable using SPSS Software to check best fitted model. Annova test and t-test are used to verify correlation and regression.
Introduction
I. INTRODUCTION
India’s population is growing at a rapid pace.people are migrating to cities from rural areas.As a result.more people are living in cities.when traffic demand is high enough that vehicle interactions cause the slow down,congestion begins.jawaharmarg,located in Indore,is one of city prominent roads and serves as a major arterial route that connects various sectors,markets, and residential areas.Given its strategic importance,traffic congestion on jawahar marg has been a persistent issue,particularly during peak hours.The road sees significant traffic volumes due to its proximity to key locations such as shoping areas, educational institutions, and office complexes.Traffic congestion is directly correlated with population growth.widening the road segment on jawahrmarg is used in this study in an effort to identify a solution for reducing traffic congestion in inodre. In the research ,A Traffic analysis is conducted on the current state of the roads.The current traffic conditions on the determine its PCU and capacity.
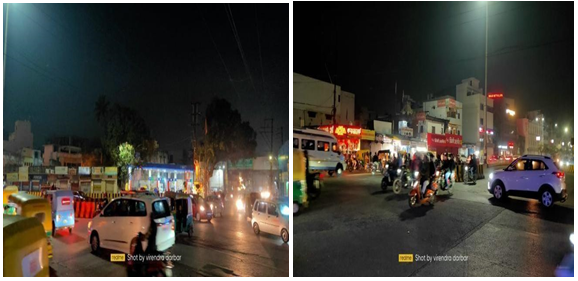
Figure.1:- Snapshots of traffic from jawahar marg
II. OBJECTIVES OF THE STUDY
- Traffuc volume:Measure the number of vehicles passing through by points in the study area.
- To study the traffic composition,vehicle classification (types of vehicles-cars,buses,two-wheeler s,etc.)
- To identiy specific locations along jawahr marg,such as intersection,market areas,and narrow sections of the road,where traffic bottlenecks occur and lead to congestion.
- Traffic speed analysis: To identify traffic average speed and the congestion levels.
III. LITERATURE REVIEW
- Zainab et all. (2024): In urban road networks, this paper meets the requirements for accurate and affordable congestion detection. The aim of this study is to compare the filed traffic states using sets of rules and use fuzzy logic to identify the traffic conditions states. Another method that makes it possible to learn from successful and efficient techniques to identify traffic congestion.Index speed reduction, speed ratio, and congestion detection based on traffic speed index measures are the primary tactics used in this work.[6]
- Abdellah Bousouf et all (2024): In this paper,analyzing traffic congestion using real-time big data.The goal of this is to determine a real-time traffic performance index for one weak.The morning peak hour on weekday occurs between 7:00 am and 9:00 am, which precedes the weekend morning peak hour. Specifically, the morning peak hour on weekends occurs between 9:00 am and 12:00 pm.TTI values are higher on weekdays during both morning and evening traffic congestion peak hours compared to weekend.our findings indicate that land use factors significantly contribute to increase traffic congestion.traffic congestion is primarily caused residential,industrial,and commercial areas,as well as trams.[1]
- . Prateek bansal et all (2023):This paper uses causal statistical modeling to analyze congestion technology in road networks in 24 cities worldwide.Building more roads is a common policy intervention to alleviate congestion. This strategy, however, is controversial because, under certain conditions, road capacity expansions may result in increased traffic volumes.Estimating congestion technology based on traffic variables is challenging due to statistical biases caused by complex interactions between traffic flow, controls, and capacity.Based on our findings, it appears that expanding network capacity is generally not a good way to deal with congestion because it does not significantly improve the average network travel speed. This finding has significant ramifications for the best urban transportation plans, as do our estimates of congestion technology.[2]
- Khalid Mohammed Almatar et all (2022): This study aims to identify the most congested areas of the road network and their relationship with driver demand.This study employs the Floating Car Data method to identify traffic congestion and determine whether observed clusters accurately reflect congestion patterns across a larger urban road network.Statistical calculations were performed to determine cluster correlation and draw conclusions. This approach successfully identifies traffic congestion patterns in urban roads. Research indicates that traffic congestion is more severe and widespread in the evenings compared to the mornings. The findings can inform a framework for identifying potential traffic issues and predicting congestion.[3]
- Pengjun zhao et all (2019): The aim of this paper is to help fill this gap in the literature by applying a big data analytic approach to a sample of 10.16 million records of traffic congestion indexes for 233 roads in the Beijing area a six month period.This study outlines an approach for analysis traffic congestion patterns in Beijing.Congestion on working days had the highest spatial dependence,with regular and agglomerated patterns.Weekend congestion exhibited spatial dependence,with the evening peak exceeding the morning peak.The spatial relationship between traffic congestion and holidays was weak,random,and scattered.[5]
- Yung Liu et all (2016): In this paper evaluate the speed performance index,to find the traffic congestion.The speed performance starts to rapidly decrease at 7:00 during the morning peak and reaches its lowest point at 8:00.however,the low speed permanence continues until roughly 10;00.the speed performance id superior on weekends compared to week days,with peak hours occurring at around 12:00 morning are preferable to afternoon.Congestion delays occurs during the morning peak,Causing road network congestion to persist until approximately 10:00.The Beijing express network experiences congestion in both segment and network levels.morning peak is more efficient then evening peak,and season plays a significant role in urban road network congestion.
- Yang Yue et all (2013): In this paper,As floating car data grows,its important to identify traffic patterns congestion,from the historical data set.This paper proposes a novel floating car data analysis method using data cubes to explore congestion patterns. This method differs from traditional methods that rely solely on numerical traffic statistics. The view of the event or spatial-temporal progress is modified. Model and measure traffic congestion.evaluated our methods using a one-week historical traffic data set from 12000 taxi-based floating cars in a large urban area. The results show that the method can effectively identify and summarize the congestion pattern using efficient computation and Reduce.
IV. STUDY AREA DETAILS
The midblock area between shree vashnav acadmey (rajmohalla) and chhotigwaltoli mein road (patel bridge) in indore is the focus of the current investigation.the road id 3.20kilometres long overall.for the current study,a road segment of approximately 1.7km from shree vashnav acadmey to nandlalpora chouraha and 1.1km from nandlalpura to chhotigwaltoli Patel bridge has been chosen.the two sections are taken on the road for the study on between shree vashnav acadmey (rajmohalla) to nandlalpura chouraha to chhotigwaltoli main road Patel bridge Indore.the section of road is shown below in figure no.2
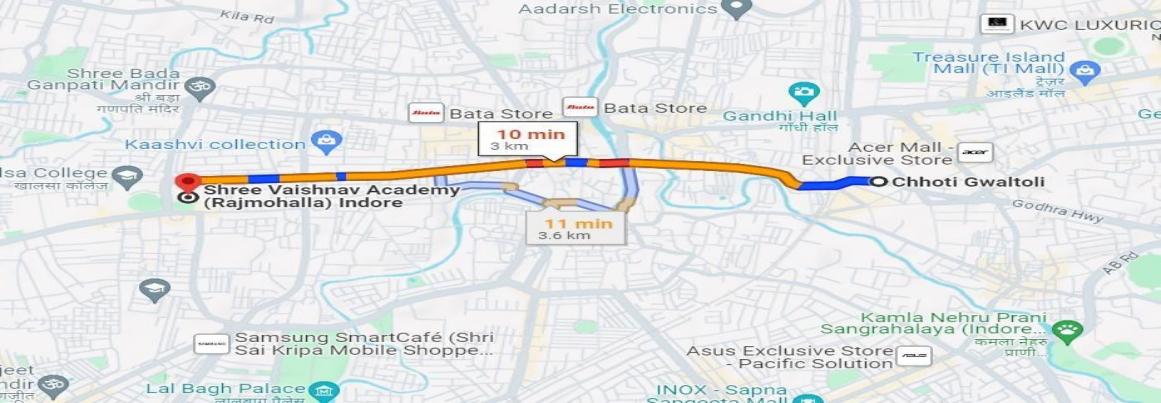
Figure.2:- Location of study area and sounding city.
V. METHODOLOGY
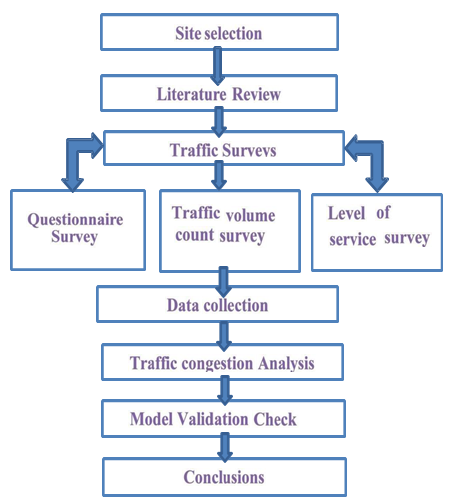
Figure3:- Flow Chart With Study Methodology
VI. DATA COLLECTION AND ANALYSIS
A. Data Collection
A real tome traffic dataset was used .daily and weakly analysis of congestion were performed for a road segment fro the daily analysis,a similar peak congestion period was observed.The purpose of this survey is to comprehend the traffic dynamics,including averagedaily ,traffic, traffic composition, peak hour traffic, and directional split at specific survey locations.Based upon analysis of this data, peak hours timing was identified at the measurement loation stretch.afterward,due to several unavailable constraints,data were collected during peak hours (9:30AM to11:30AM and 5:30PM to 7:30PM).Traffic vehicles are divided into seven categories by their dimmentions Car/van/jeep,two wheeler,three-wheeler,bus,light commercial vehicle,truck and bicycle.figure.4showing below morning peak hour volume.
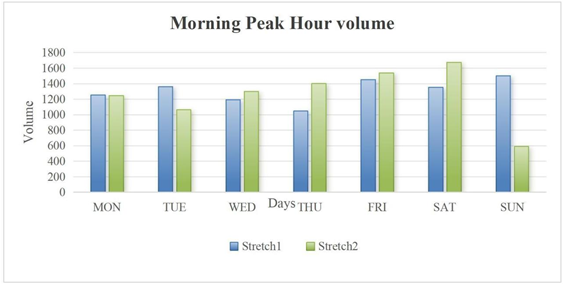
Figure4:- Morning Peak Hour
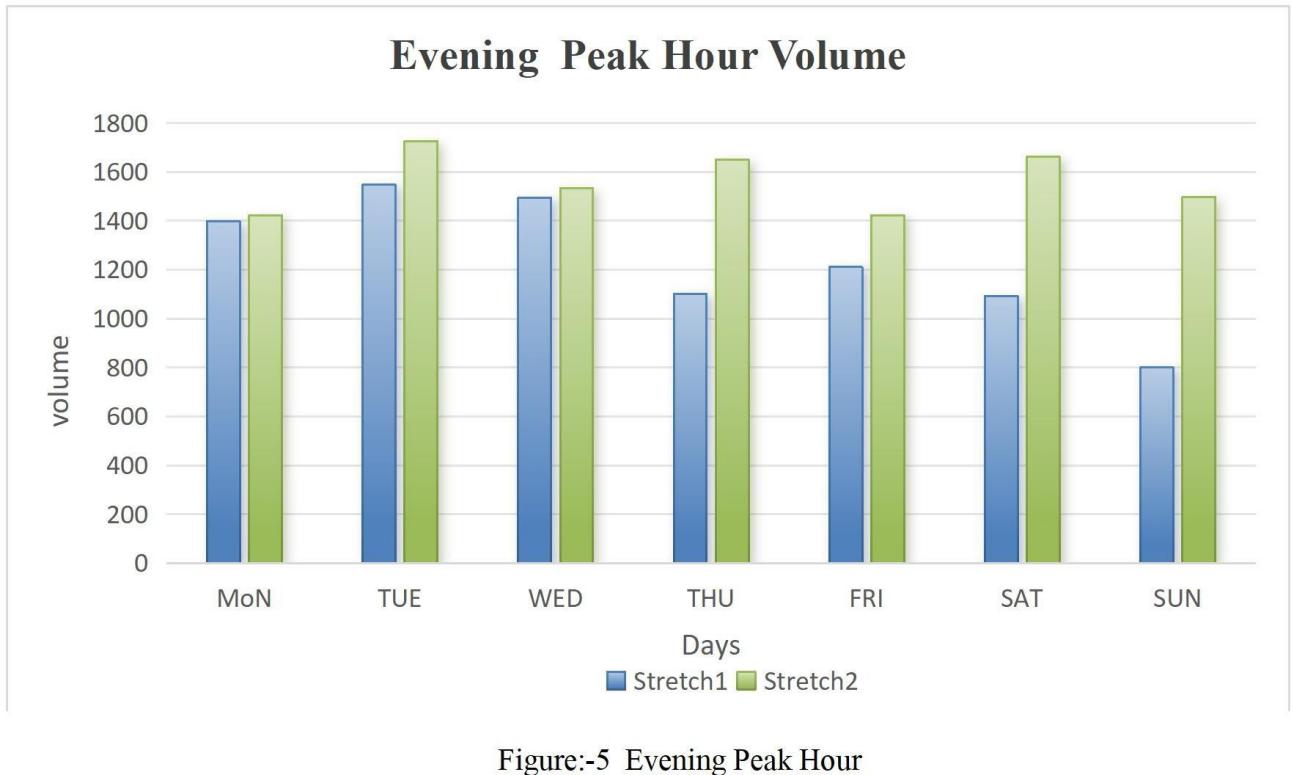 Figure:-5 Evening Peak Hour
B. Data Analysis
1) Vehicle Composition
Vehicle classification is performed to understand the composition of traffic,using PCU (passenger car unit) values from guidelines like IRC 106:1990.This allows for conversion of various vehicle types into equivalent passenger cars to better understand their impact on the road.
|
Vehicle Composition |
|||||||||
|
Shreevshnav Acadmey to Nandlalpuora chouraha |
|||||||||
|
In Out |
|||||||||
|
CAR/ VAN/ JEEP (Pvt) |
Auto |
|
Two wheeler |
|
HCV |
Bus |
LCV |
Cycles |
Others |
|
27% |
4.63% |
64.99% |
0.86% |
0.66% |
1% |
1% |
0% |
||
|
Vehicle Composition |
|||||||
|
Nandlalpura chhouraha to shree vashnav acadmey |
|||||||
|
In out |
|||||||
|
CAR/ VAN/ JEEP (Pvt) |
Auto |
Two wheeler |
Bus |
HCV |
LCV |
Cycles |
Others |
|
29% |
5% |
51% |
2% |
2% |
4% |
1% |
1% |
|
Vehicle Composition |
|||||||
|
Nandlalpura chourah To Chhotigwaltoli main road ( patel Bridge) |
|||||||
|
In out |
|||||||
|
CAR/ VAN/ JEEP (Pvt) |
Auto |
Two wheeler |
Bus |
HCV |
LCV |
Cycles |
Others |
|
33% |
5.00% |
49.00% |
3% |
1.00% |
5% |
1% |
2% |
|
Vehicle Composition |
|||||||
|
Chhotigwaltoli main road to Nandlalpura chouraha |
|||||||
|
In out |
|||||||
|
CAR/ VAN/ JEEP (Pvt) |
Auto |
Two wheeler |
Bus |
HCV |
LCV |
Cycles |
Others |
|
32% |
5.00% |
51.00% |
4% |
2.00% |
4% |
1% |
1% |
2) Hourly vehicle traffic
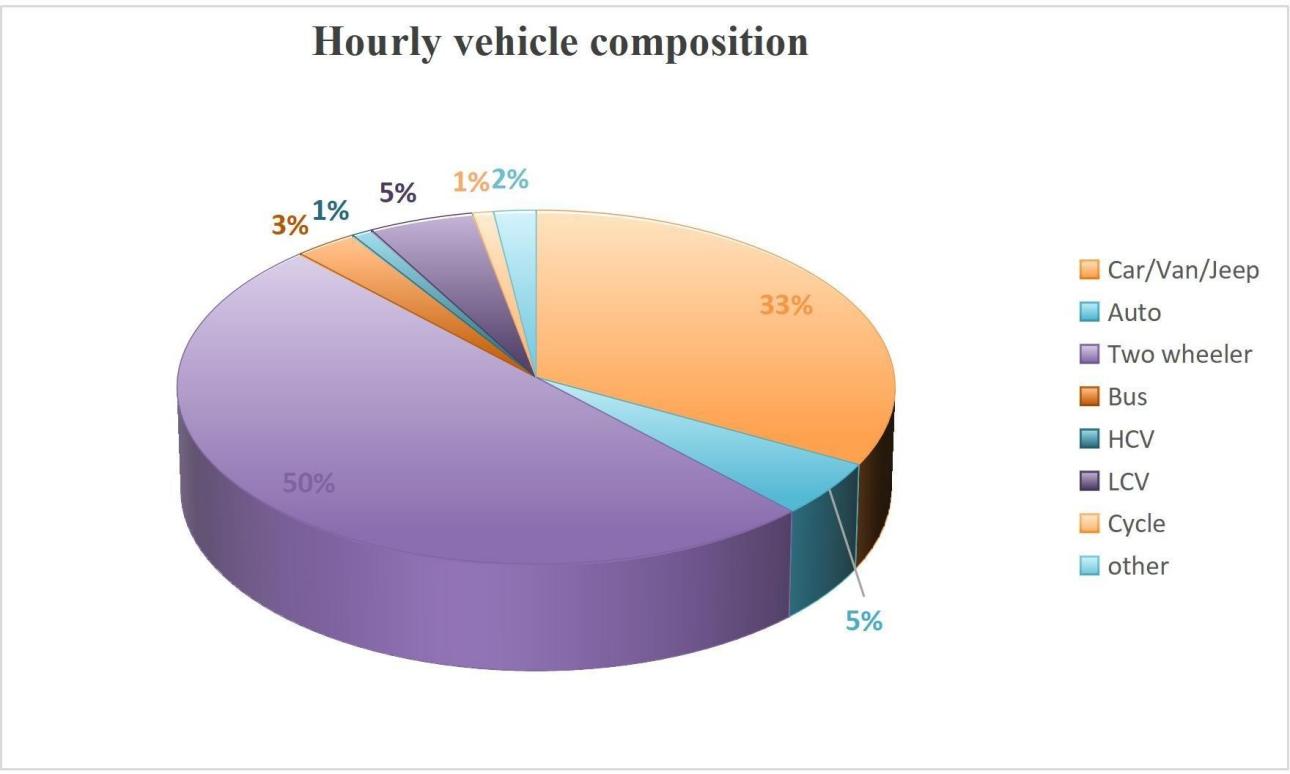
Figure6:- Hourly vihicular traffic
3) Volume variation of vehicles
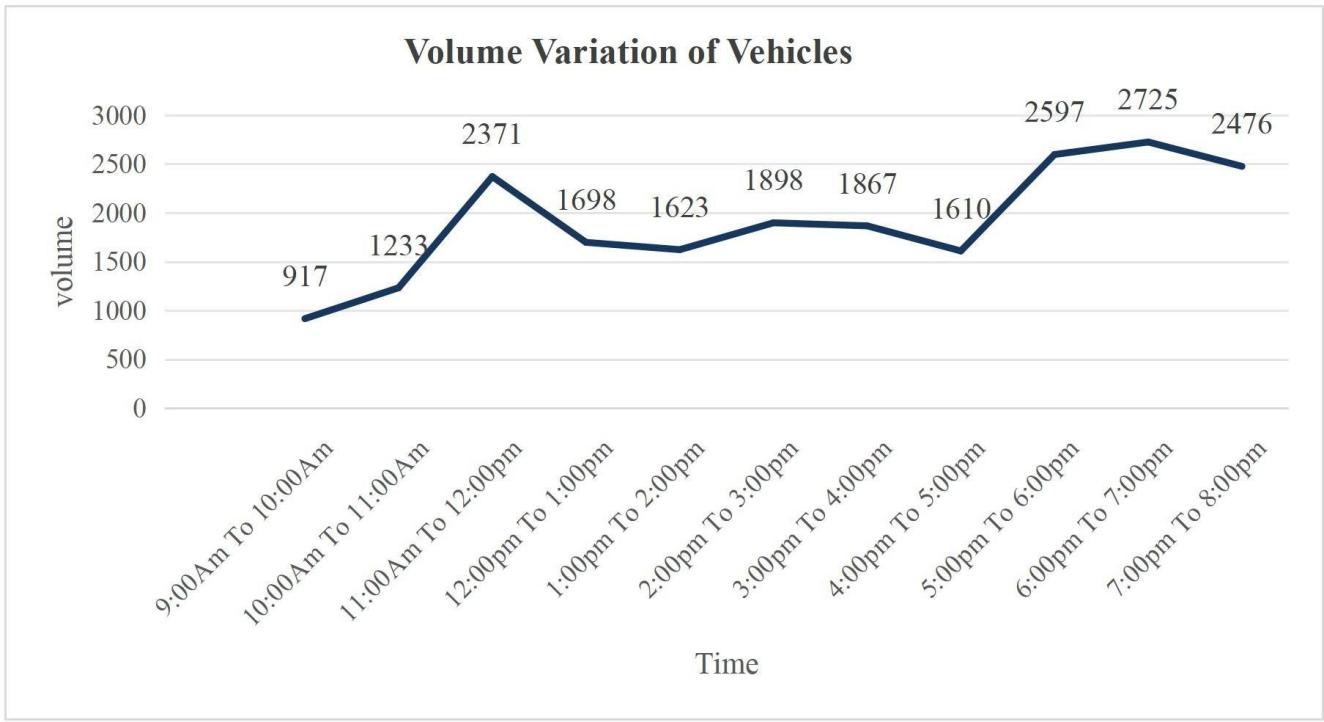
Figure:-7 Volume variation of vehicle
4) Capacity and the level of service of each road section
|
Location |
direction |
Time |
PCU/Hr |
Width of road as per (IRC) |
Design Service Volume@PCU/Hr |
V/C |
LOS |
|
Jawahar Marg |
Shree Vashnav Acadmey to Nandlalpou chouraha |
Morning Peak Hour 9:30AM to 10:30AM |
2370 |
3.5m |
2400 |
0.81 |
E |
|
Evening Peak Hour 6:30PM to7:30PM |
2937 |
3.5m |
2400 |
1.32 |
F |
|
Location |
direction |
Time |
PCU/Hr |
Width of road as per (IRC) |
Design Service Volume@PCU/Hr |
V/C |
LOS |
|
Jawahar Marg |
Nandlalpour a chouraha To shree vashnav acadmey |
Morning Peak Hour 9:30AM to 10:30AM |
1604 |
3.5m |
2400 |
0.49 |
B |
|
Evening Peak Hour 6:30PM to7:30PM |
2465 |
3.5m |
2400 |
1.16 |
F |
Conclusion
A. Conclusions Discussion on vehicle composition From the survey we can see that most vehicles in the area are motorcycles and three-wheelers.this distribution indicates a heavy reliance on two-wheeler for commuting between rajmohalla chowk chhotigwaltoli road.buses,through fewer in number,are usually municipal buses or school buses etc. 1) Discussion on survey data of traffic a) From Shreevashnav acadmey to Nandlalpoura chouraha • In this section shows levels of traffic throughout the day, with peaks during the 7:00AM to 8PM time slot. • The total number of vehicles recorded b) Nandlalpoura chouraha to patel bridge • In this section experiences peaks during the 7:00AM to 8PM time slot. • The total number of vehicles recorded is 2) Discussion on hourly share of vehicles The survey indicates that the data is gathered between 9AM and8PM,with the 6 to 7PM time slot seeing the most vehicles,closely followed by the 7 to 8PM time slot.Thorough the day,two-wheeler predominate in traffic,with evening rush hours seeing the highest concentration of these vehicles. 3) Discussion on volume variation of traffic a) Shree vashnav acadmey (Rajmohalla chowk) section • This direction experiences varying levels of traffic thought the day, with peaks during the 11AM to12PM and 6to7PM time slots • The total number of vehicles recorded in this direction i b) Nandlalpoura chowk section • This direction also shows fluctuations in traffic volume,with peaks during the 10AM to 12PM and 6 to 7PM time slots. • The total number of vehicles recorded in this direction is When the overall traffic volume in both directions is compared the rajmohalla chowk section has a larger total number of vehicles recorded(25133) than the nandlalpoura chowk section (21015).As a result, the rajmohalla and nandlalpura chowk directions may see higher traffic and congestion levels,which could more issues for the main road the nandlalpura chowk section. 4) Discussion on hourly flow of vehicles a) Rajmohallah road section • This direction experiences varying levels of traffic throughout the day,with peaks during the morning and evening rush hours. • The total hourly flow of vehicles arise between903.0 PCU and 1398PCU. • The peak hour for this section is 9:30AM to 11:30PM. • The total volume of vehicles recorded in this direction is 25133. b) Nandlalpoura chowk section • This direction also shows fluctuation in traffic volume,with peaks during the morning and-evening rush hours. • The total hourly flow of vehicles varies between 974.5PCU and 2212PCU. • The peak hour for this section is 6:00PM to 8:00PM. 5) Recommendations a) Flyovers or underpasses: Contruct flyovers or underpasses at keyintersections like Rajmohalla or sanjay setu,to minimize delays. b) Public Transportation: Expand bus rapid transit (BRTS) routes or metro networks with stops at key points on jawahar marg. c) Rope way systems: Explore elevated rope way solutions for specific high-traffic zones where road expansion isn\'t suitable. d) Dedicated Parking Zones:Develop structured parking areas to reduce on street parking. e) Pedestrian Facilities: Build footpaths and dedicated pedestrian crossing to separate pedestrian traffic from vehicular flow.
References
[1] Abdellah Bousouf,et al.\"A sationtemporal analysis of traffic congestion patterns using clustrring algorithms.A case study of casablanca \"issue22jan (2024)2772-6622. https://doi.org/10.1016/j.dajour.2024.100404. [2] Prateek bansal et al.\"Congestion in cities;can roadd capacity expansiond provide a solution\"(2023)0965-8564.https://doi.org/10.1016/j.tra2023./03726. [3] Abbas Rammalet al.\"Traffic congestion prediction based on multivariate modelling and neural networks regressions?(2023)1877-0509.https//creativecommons.org/licenses/by-nc-ndd/4.0. [4] Khalid mohamed almatar \"Traffic congestion patterns in the urban road network?.(2022)2090-4479.https://doi.org/10.1016/j.asej.2022.101886. [5] Pengjun zhao et al\"Geographical pattens of traffic congestion in grawing megacities:Big data analytics from beijing?.issue.30mmarch (2019)0264-2751.https://doi.org/10.1016/j.ciyies.20219.03.022. [6] Zainab Ahmed Alkaissi et al.\"Traffic congestion evaluation of urban streets based on fuzzy inference system and GIS application?issue19feb(2024),2090-4479 httpts://doi.org/10.1016/j.asej.2024.102725. [7] Yang yue et al.\"identifying urban traffic congestion pattern from historical floating car data”(2013)1877-0428CCBY-NC-NDlicense. [8] Yang Liu et al.\"A traffic[1] Abdellah Bousouf,et al.\"A sationtemporal analysis of traffic congestion patterns using clustrring algorithms.A case study of casablanca \"issue22jan (2024)2772-6622. https://doi.org/10.1016/j.dajour.2024.100404. [2] Prateek bansal et al.\"Congestion in cities;can roadd capacity expansiond provide a solution\"(2023)0965-8564.https://doi.org/10.1016/j.tra2023./03726. [3] Abbas Rammalet al.\"Traffic congestion prediction based on multivariate modelling and neural networks regressions?(2023)1877-0509.https//creativecommons.org/licenses/by-nc-ndd/4.0. [4] Khalid mohamed almatar \"Traffic congestion patterns in the urban road network?.(2022)2090-4479.https://doi.org/10.1016/j.asej.2022.101886. [5] Pengjun zhao et al\"Geographical pattens of traffic congestion in grawing megacities:Big data analytics from beijing?.issue.30mmarch (2019)0264-2751.https://doi.org/10.1016/j.ciyies.20219.03.022. [6] Zainab Ahmed Alkaissi et al.\"Traffic congestion evaluation of urban streets based on fuzzy inference system and GIS application?issue19feb(2024),2090-4479 httpts://doi.org/10.1016/j.asej.2024.102725. [7] Yang yue et al.\"identifying urban traffic congestion pattern from historical floating car data”(2013)1877-0428CCBY-NC-NDlicense. [8] Yang Liu et al.\"A traffic congestion Assessment method for urban road network based on speed performance index”(2016)1877-7058 (http://creativecommons.org/licenses/by-ncnd/4.0/). congestion Assessment method for urban road network based on speed performance index”(2016)1877-7058 (http://creativecommons.org/licenses/by-ncnd/4.0/).
Copyright
Copyright © 2025 Muskan Gangwal, Dr. H. K. Mahiyar. This is an open access article distributed under the Creative Commons Attribution License, which permits unrestricted use, distribution, and reproduction in any medium, provided the original work is properly cited.

Download Paper
Paper Id : IJRASET66729
Publish Date : 2025-01-29
ISSN : 2321-9653
Publisher Name : IJRASET
DOI Link : Click Here
 Submit Paper Online

