Ijraset Journal For Research in Applied Science and Engineering Technology
- Home / Ijraset
- On This Page
- Abstract
- Introduction
- Conclusion
- References
- Copyright
Sustainability Indicators Correlation Matrix
Authors: Mahamat Habib Bechir, D. Ferreria-Martinez, A. Lopez-Aguera
DOI Link: https://doi.org/10.22214/ijraset.2024.63572
Certificate: View Certificate
Abstract
This study explores the complex interplay between economic growth, environmental preservation, and energy efficiency in the context of sustainable development. Leveraging analytical tools such as the OSeMOSYS model and Pearson correlation coefficient, the research investigates how economic decisions impact energy resource utilization and environmental quality. Key sustainability indicators, including Energy Payback Time (EPBT), Internal Rate of Return (ITR), and Climate Change Impact Mitigation (IMPcc), are analyzed within the framework of the Atlantis energy system. The study emphasizes the need to balance economic priorities with environmental considerations to achieve sustainability objectives effectively. Furthermore, the research evaluates the correlation between sustainability indicators when integrated into the optimization process of the OSeMOSYS energy modeling system. This approach, advocated in previous studies, underscores the importance of incorporating sustainability metrics into decision-making processes. In conclusion, the findings highlight the necessity of reevaluating the weighting of indicators within optimization functions to prioritize sustainability goals. By providing insights into the complex relationships between economic, energy, and environmental factors, the study contributes to advancing sustainable development practices for policymakers, businesses, and society as a whole.
Introduction
I. INTRODUCTION
Sustainable development has emerged as a paramount global priority in recent decades, necessitating the harmonization of economic progress, environmental preservation, and energy efficiency, all while striving for social equity [1]. While these aspects may be tackled individually, their intricate interconnections underscore the interdependence of their impacts [2]. Economic decisions, for instance, wield considerable influence over both the environment and the energy landscape. Likewise, environmental degradation can cascade into economic ramifications and the availability of energy resources [3]. This study delves into these intricate dynamics, identifying pivotal correlations and their far-reaching implications. To gauge this interplay, it relies on analytical methodologies and statistical tools, notably leveraging the OSeMOSYS model alongside the Pearson correlation coefficient.
OSeMOSYS, an open-source energy optimization model [4], assumes a central role in this endeavor, particularly in its extended version, which integrates sustainability indicators as critical facets of the objective function. These indicators encompass metrics such as Energy Payback Time (EPBT) for assessing energy sustainability, Internal Rate of Return (ITR) for gauging economic sustainability, and Climate Change Impact Mitigation (IMPcc) as an indicator of environmental sustainability [5], [6]. Employing ATLANTIS as a case study, chosen for its extensive dataset, proves instrumental in comprehending how economic decisions shape both energy resource utilization and environmental quality.
Through the application of the Pearson correlation coefficient [7], this study scrutinizes linear relationships between pivotal variables, including in the breakdown of energy production, categorized into renewable energy, fossil fuels, and nuclear energy; the Economic costs encompass capital costs, fixed costs, and variable costs; and the Emissions output. The resultant insights offer a holistic understanding of how economic policies intricately influence energy and environmental sustainability. This holistic approach not only aids in identifying effective strategies to advance sustainable development but also underscores the imperative of balancing economic imperatives with environmental safeguards.
Moreover, the practical interpretation of the identified correlations furnishes comprehensive insights into the intricate interplay among these dimensions, offering valuable guidance for policymakers, businesses, and society at large in their pursuit of sustainable development.
II. METHODOLOGY
The purpose of this study is the evaluate the correlation between sustainability indicators when they are used as optimisation constraints in an energy modelling system using the OSeMOSYS code. Consideration has been given to the methodology advocated in [8], which emphasises the inclusion of sustainability indicators as an extra cost. The statistical correlation matrix is employed exclusively for this purpose. The Atlantis energy framework has been chosen as a case study to achieve the stated objectives.
The focus of this section is to provide a concise overview of the integration of sustainability indicators into OSeMOSYS, as developed in [8]. It also covers the concept of the statistical correlation matrix and the evaluation procedures used to determine the degree of correlation between sustainability indicators.
A. Sustainability indicators integration into OSeMOSYS
In prior research [8], a methodology was developed to integrate sustainability indicators into the optimization function of the Open-Source Energy Modeling System (OSeMOSYS), aiming to bolster the software's sustainability capabilities. OSeMOSYS is a versatile open-source software package utilized for energy modeling and analysis, empowering policymakers, researchers, and energy experts to identify cost-effective energy mixes tailored to their specific requirements [4], [9].
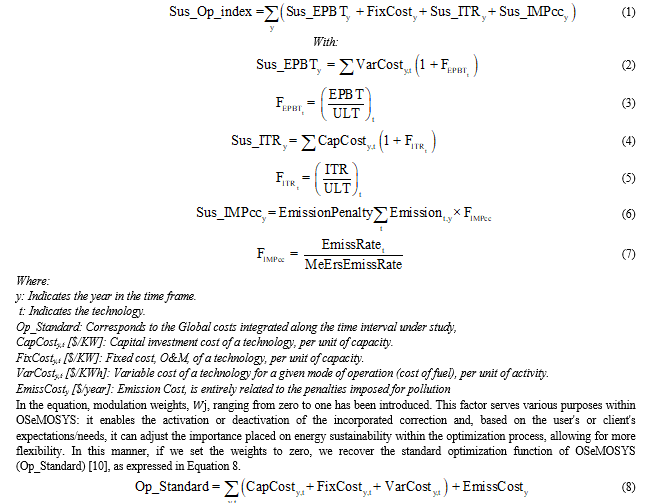
To address this, sustainability indicators are incorporated into OSeMOSYS within the optimization function through a process akin to multi-objective optimization, delineated by correction factors linked to the various indicators. These indicators encompass energetic sustainability (EPBT), economic sustainability (ITR), environmental sustainability (IMPcc), and their convolution. Consequently, the optimization function transitions into a multi-objective framework, with each indicator serving as an additional cost factor. This introduction of supplementary costs enables the consideration of sustainability criteria during the optimization process, significantly influencing the overall optimization outcome, rather than being mere supplementary expenses. The extended optimization function, referred to as Sustainable Optimization Function (Sus_Op_index), is described in Equation 1.
B. Definition of the framework application
ATLANTIS, a fictional nation blending characteristics from both developing and developed countries, serves as a testing ground for the energy model developed by [11]. Within the OSeMOSYS framework, ATLANTIS is not merely a conceptual entity but rather an established experimental framework. It functions as a benchmark environment considered optimal by both users and developers of OSeMOSYS for new implementations, thereby enhancing result reproducibility. The energy matrix of ATLANTIS is comprehensive, encompassing a diverse array of technologies, ensuring the generation of representative results. The technical and economic data used in ATLANTIS are sourced from reports by the International Renewable Energy Agency and the IEA-Energy Systems Analysis Program – Technology briefs (E01, E02, E03, E06, E10, and E11).
To maintain consistency with prior studies [8], [10], we utilize the same dataset for both costs and stability estimator values, with the exception of nuclear technology. In this context, our study advocates for adopting a pessimistic estimate for the Energy Payback Time (EPBT) and Internal Rate of Return (IRR) associated with cradle-to-cradle treatment of high-activity waste, estimated at approximately 80 and 75 years, respectively. Regarding the penalty imposed for CO2 emissions, we rely on emission costs calculated in [10], where $50 per ton of CO2 is deemed sufficient to facilitate decarbonization. To ensure reproducibility, Table 1 summarizes the dataset utilized.
Table 1. Main power generation technologies input characteristics parameters [10]
|
Technologies |
Economic Costs |
Useful Lifetime (Year) |
Capacity Factor (CF) |
Sustainability Estimators |
||||
|
Fixed Cost (M$/GW) |
Capital Cost (M$/GW) |
Variable Cost (M$/PJ) |
EPBT (Year) |
IRR (Year) |
CO2 emission activity ratio (Mt/PJ) |
|||
|
Natural Gas (NGSC) |
44 |
2300 |
24.05 |
30 |
1 |
8.17 |
11.7 |
0.132 |
|
Diesel Generator (DSGC) |
36 |
900 |
22.49 |
30 |
1 |
12.68 |
14.7 |
0.193 |
|
Integrated Gasification Coal (IGCC) |
148 |
3700 |
11.58 |
30 |
1 |
12.93 |
30 |
0.268 |
|
Heavy oïl (HFSC) |
50 |
2300 |
30.23 |
35 |
1 |
29.33 |
14.7 |
0.203 |
|
Large Hydro (Hydro Dam) |
60 |
4000 |
1.39 |
35 |
0.45 |
7.2 |
84 |
0 |
|
Mini Hydro (Hydro_Min) |
65 |
4500 |
1.39 |
50 |
0.4 |
3.63 |
35 |
0 |
|
Distributed Diesel (Diesel_Gen) |
55 |
1070 |
22.48 |
40 |
1 |
12.68 |
14.8 |
0.193 |
|
Photovoltaic Utility Grid (PV_UTL) |
0 |
2000 |
1.39 |
25 |
0.35 Day 0 Night |
3 |
2 |
0,003 |
|
Wind |
0 |
1845 |
2.69 |
25 |
0.25 |
10.32 |
10 |
0,006 |
|
NEW Combined Cycle Gas Turbine (NGCC) |
44 |
1100 |
16.17 |
35 |
1 |
8.17 |
11.9 |
0.101 |
|
Nuclear |
0 |
3000 |
6.12 |
50 |
1 |
80 |
75 |
0.004 |
C. Correlation Matrix Based on Constraints
In this study, we'll utilize the Pearson method [7], [12] to gauge the correlation among various variables pertaining to both the energy-economic and environmental facets of sustainable development. To achieve this, we'll construct correlation matrices illustrating the linear connections among all variables under consideration. These matrices will unveil patterns and connections between the energy-economic and environmental dimensions of sustainable development, offering a deeper insight into their interplay within the realm of sustainability.
However, in a multidimensional study like ours, where numerous variables are at play, the correlation matrix isn't a static, single entity [12]. Instead, it serves as a tool to evaluate the strength and direction of relationships among multiple variables concurrently, within a defined set of relevant constraints [12], [13], [14].
In this context, we've identified different constraint sets, based on merit variables, which can be applied either individually or collectively during the analysis. By employing constraint sets, we can refine datasets to create subsets that adhere to specific conditions or criteria. These subsets can then be analyzed independently, allowing us to focus on particular aspects or relationships within the data.
In our study, we'll generate a correlation matrix for each subset, resulting in a distinct matrix for each set of constrains. In the present study, the set of constraints is derived from the output results of the simulations carried out with OSeMOSYS, which consists of energy production, economic costs, and output emissions.
The Energy production feature covers the energetic production set of different types of energy systems, subset into renewable energy, fossil fuels and nuclear energy. These quantities represent the output levels of different energy sources generated within the OSeMOSYS simulation. With respect of economic costs includes the OSeMOSYS cost component, which consists of capital costs, fixed costs, and variable costs. Economic costs provide insights into the financial implications associated with different scenarios simulated by OSeMOSYS. And the output emissions refer to the emissions generated by the energy-producing activities included in the OSeMOSYS simulation. Output emissions represent the environmental impact of different energy production pathways and are crucial for assessing the sustainability of energy systems.
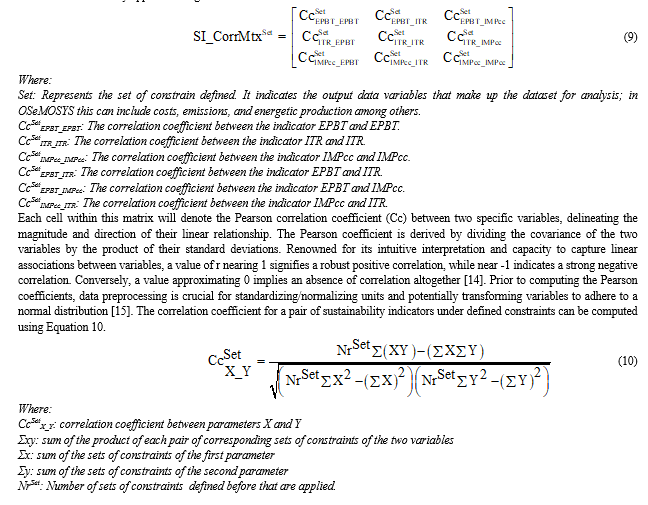
Named as SI_CorrMtxSet, the correlation matrix for sustainability indicators is depicted in Equation 9, where correlation coefficients are linearly applied among the indicators.
III. RESULTS AND DISCUSSIONS
In the framework of the Atlantis energy scenario, sustainability indicator objective functions have been optimized to infer the output variable constraints crucial for computing the correlation coefficients. Three key optimization functions utilize single estimators as the main variable in constructing the appropriate matrix. These single optimization functions are as follows:
i) energetic sustainability indicator optimization (Op_EPBT).
ii) Economic sustainability indicator optimization (Op_ITR).
iii) Environmental sustainability indicator optimization (Op_IMPcc).
To further enhance the discussion of results, additional optimization functions as a convolution of each sustainability indicator pair are considered. These include:
i) Energetic and Economic indicators optimization (Op_EPBT_ITR).
ii) Economic and Environmental indicator optimization (Op_ITR_IMPcc).
iii) Environmental and Energetic sustainability indicators optimization (Op_IMPcc_EPBT).
For each optimization function, the considered output parameters in their global values integrated over the studied period are shown in Table 2.
Upon analysing each indicator separately, it is evident that EPBT and IMPcc exhibit a more aligned behaviour, making them well-suited for decarbonization However, the importance of environmental sustainability has surpassed that of the energy sustainability indicator. This is evidenced by the paired optimisation trend between them which leans towards a consensus trend in renewable energy, emphasising the significant importance of both indicators. Meanwhile, emissions, fossil fuel production and costs have continued their path towards environmental sustainability. Broadly the pattern of IMPcc and EPBT is in sharp contrast to that of ITR, which promotes counter-decarbonisation outcomes.
Based on the findings presented in Table 2, two types of analyses have been conducted: Initially, the study evaluates the diverse effects linked to the application of individual and collective sustainability estimators. Subsequently, the corresponding correlation coefficients are computed. The merit variables associated with energy transition have been considered in both instances.
Table 2. Global output of the considered observable for each sustainable optimisation function.
|
Optimization Function |
Energy Production Sources (%) |
Economic Costs |
Emissions (Ton CO2 /MWh) |
|||||
|
Renewable |
Fossil |
Nuclear |
Variable (M$) |
Capital (M$) |
Fixed (M$) |
|||
|
Single Optimization Function |
Op_EPBT |
77 |
23 |
0 |
1607.45 |
3530.02 |
1465.41 |
0.13 |
|
Op_ITR |
31 |
69 |
0 |
2859 |
1967.37 |
926.50 |
0.32 |
|
|
Op_IMPcc |
72 |
6 |
22 |
1379.41 |
4201 |
1108 |
0.03 |
|
|
Pairing Optimisation Function. |
Op_EPBT_ITR |
45 |
55 |
0 |
3319.79 |
2158.09 |
994.17 |
0.28 |
|
Op_EPBT_IMPcc |
81 |
6 |
13 |
1177.05 |
3761.00 |
1443.93 |
0.03 |
|
|
Op_ITR_IMPcc |
44 |
39 |
17 |
3122.61 |
2267.60 |
939.16 |
0.16 |
|
A. Direct evaluation
The comparison between a single and convoluted indicator has been calculated to assess constructive or non-constructive interactions between the effects of applying different indicators. This comparison has been evaluated for each merit variable.
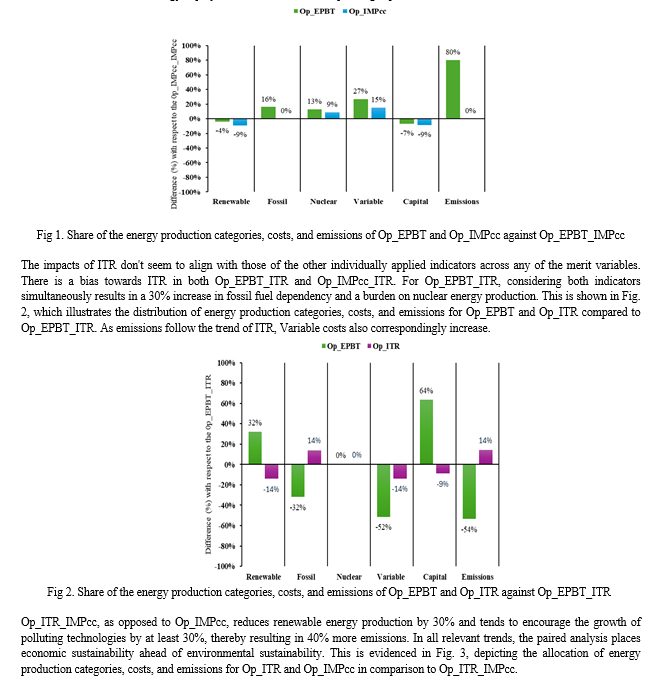
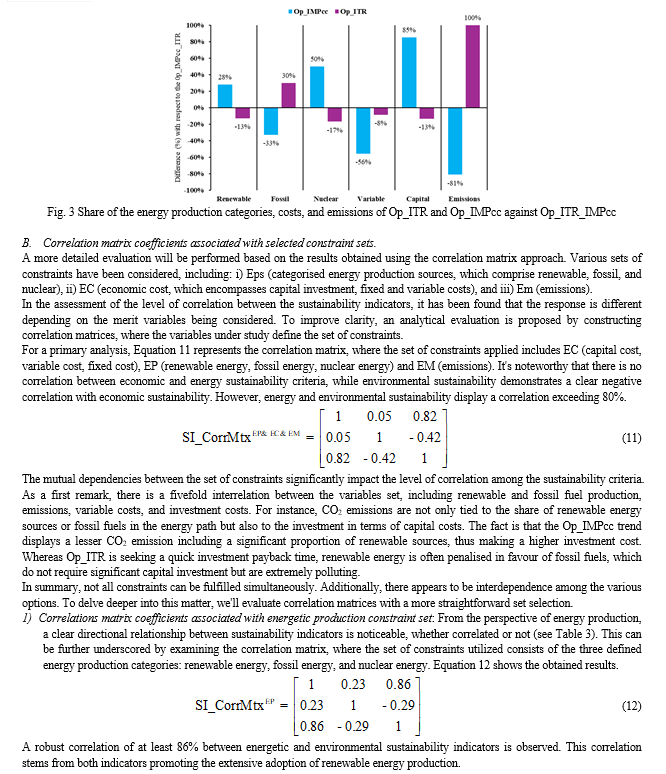
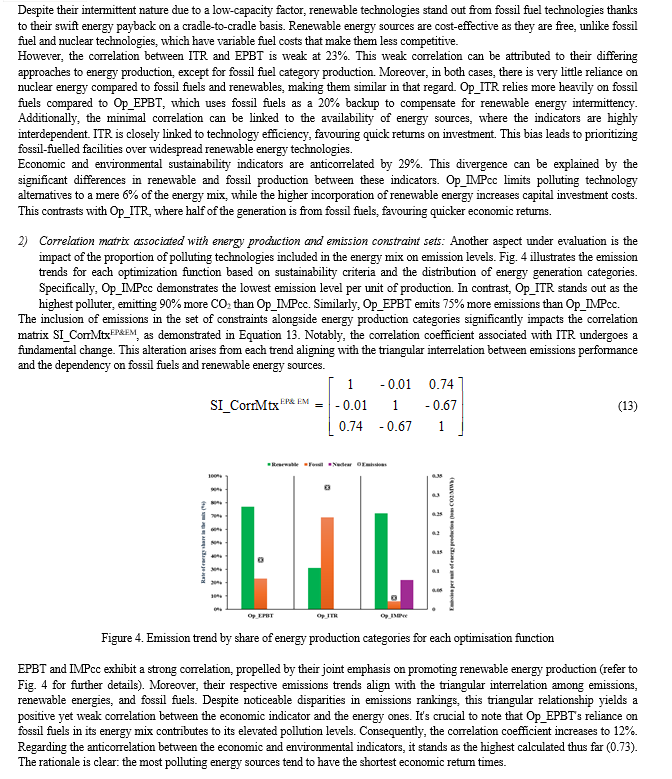
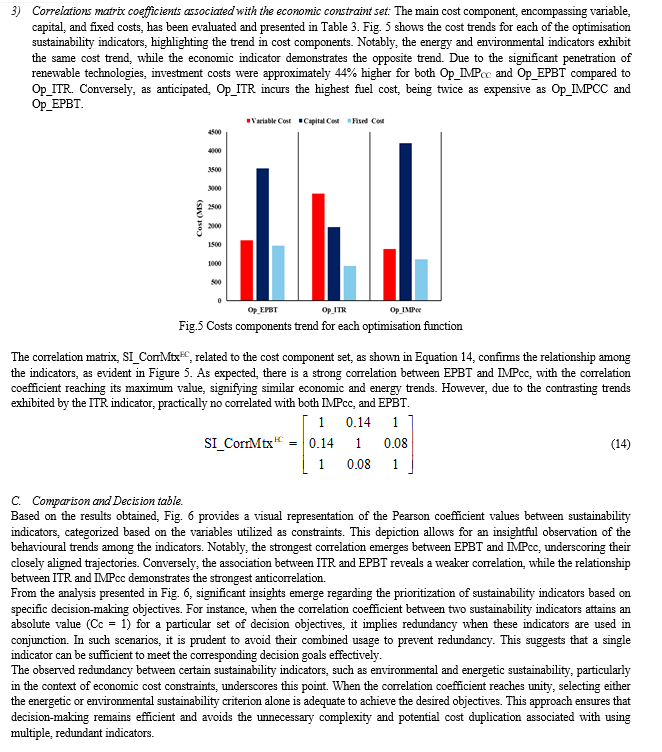
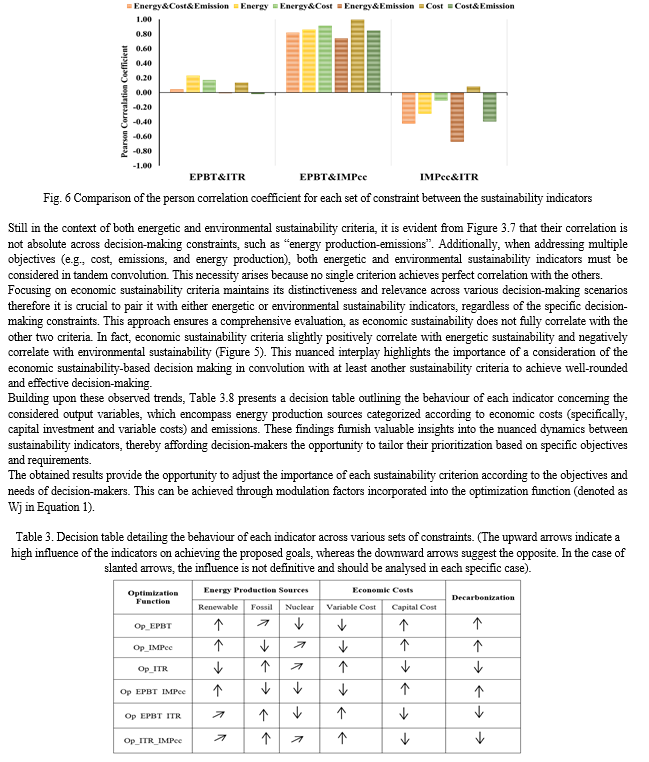
Starting with both energetic and environmental sustainability indicators, Fig. 1 plots the distribution of energy production categories, variable and capital costs, and emissions of Op_EPBT and Op_IMPcc against the paired convolution (Op_EPBT_IMPcc). The paired convolution ensures a similar level of decarbonisation to the IMPcc, with an 80% boost compared to the EPBT, which is tied to restrictions on nuclear energy (13% reduction) in exchange for a 16% increase in fossil technologies, the use of which leads to an increase in variable costs of almost a third compared to the paired convolution (Op_EPBT_IMPcc).
As far as IMPcc is concerned, the comparison also shows an increase in the variable cost because of the Nuclear fuel cost, but 12% less than the comparison between (Op_EPBT versus Op_EPBT_IMPcc), as IMPcc tends to mitigate more polluting technologies, being 30% more than EPBT. In terms of capital investment, Op_EPBT_IMPcc, which incorporates more renewable energy features, incurs an almost 10% higher capital cost compared to both EPBT and IMPcc single optimizations, which exhibit similar behaviour in terms of their renewable energy deployment and thus their corresponding capital costs.
Conclusion
In the current global paradigm, the significance of sustainability in the long-term energy transition cannot be overstated. Addressing challenges related to energy production and consumption, encompassing environmental, social, and economic impacts, is imperative. While multi-criteria Optimization modelling tools like OSeMOSYS provide valuable insights into energy systems, primarily focused on economic optimization, there\'s a growing consensus on the need to explicitly integrate sustainability considerations. Delving into sustainability indicators within OSeMOSYS reveals intricate interdependencies that significantly influence energy system planning and decision-making toward specific sustainability objectives. Among these indicators, Energy Payback Time (EPBT), Investment Payback Time (ITR), and Climate Change Mitigation Impacts (IMPcc) have been evaluated within the \"cradle to cradle\" philosophy. The assessment of correlation matrices, employing the Pearson method, offers a quantitative analysis of these dependencies across various boundary conditions. Merit variables, such as energy production categorized into renewable, fossil fuels, and nuclear; economic costs including capital, fixed, and variable costs; and emissions, serve as constraints for calculating correlation coefficients. These constraints can be applied individually or collectively, refining multidimensional datasets to focus on specific conditions or criteria. However, the efficacy of correlating sustainability indicators cannot be solely attributed to applying a set of constraints simultaneously. This arises due to trade-offs among various technical factors in the optimization process, leading to interdependencies between certain sets of output constraints. For example, this study identifies a fivefold interrelation among the merit variables, including emissions, renewable energy, fossil fuels, capital, and variable costs, aligning with sustainability optimization. Utilizing these variables to construct a correlation matrix may result in a biased interpretation, potentially skewing towards an ambiguously positive absolute correlation between sustainability indicators. Furthermore, correlation matrices evaluated using simpler selection criteria demonstrate an inverse correlation between economic sustainability optimization criteria and environmental sustainability indicators. However, the latter positively correlates with the energy sustainability indicator, unless economic constraints are explicitly considered. While economic sustainability indicators may yield rapid returns on investment and cost reduction, they may also lead to increased fossil fuel usage, higher variable costs, and elevated pollutant emissions. Consequently, economic sustainability indicators may not be suitable when primary objectives align with decarbonization efforts. This highlights a significant inherent dichotomy between economic and environmental sustainability goals, especially concerning carbon emissions reduction and climate change mitigation, alongside an increasing reliance on renewable attributes and associated investment costs. Addressing the challenge of decarbonization requires considering both economic and environmental factors. This may entail integrating environmental sustainability criteria into economic decision-making processes using energy sustainability indicators. Although energy sustainability indicators exhibit stronger correlation with environmental sustainability, their characteristic within the cradle-to-cradle paradigm presents a balanced approach between economic and environmental factors. In conclusion, fostering stronger alignment among economic, energy, and environmental sustainability goals often entails reevaluating the weighting assigned to different indicators within optimization functions. Explicitly prioritizing optimization objectives that promote sustainability is essential. The insights gained from the results facilitate this prioritization, allowing it to be directly incorporated into the optimization function of modeling tools. This enables decision-making that aligns more closely with the objectives of decision-makers, providing a comprehensive understanding of each indicator\'s behaviour concerning the considered output variables, such as energy production sources categorized by economic costs and emissions.
References
[1] United Nations, “Report of the World Commission on Environment and Development: Our Common Future,” 1987. [2] J. Sachs and K. Pan, The age of sustainable development. New York: Columbia University Press , 2015. [3] Anthony E. Boradman, David H. Greenberg, Aidan R. Vining, and David L. Weimer, Cost-Benefit Analysis Concepts and Practice, 5th ed. CAMBRIDHE UNIVERISTY PRESS, 2018. doi: 10.1017/9781108235594. [4] M. Howells et al., “OSeMOSYS: The Open-Source Energy Modeling System. An introduction to its ethos, structure and development.,” Energy Policy, vol. 39, no. 10, pp. 5850–5870, Oct. 2011, doi: 10.1016/j.enpol.2011.06.033. [5] C. Cabo Landeira, “PV systems design optimization as function of the climatic conditions,” Uiversity of Santiago de Compostela , Santiago de Compostela , 2018. [Online]. Available: http://hdl.handle.net/10347/17257 [6] Mahamat Habib Bechir, A. Mannelli, and A. L. Agüera, “Life Cycle Analysis and Sociocultural Impact for a Sustainable Nexus Design,” in Proceedings of the 1st International Conference on Water Energy Food and Sustainability (ICoWEFS 2021), Springer International Publishing, 2021, pp. 670–679. doi: 10.1007/978-3-030-75315-3_71. [7] P. Sedgwick, “Pearson’s correlation coefficient,” BMJ (Online), vol. 345, no. 7864. Jul. 07, 2012. doi: 10.1136/bmj.e4483. [8] D. Ferreira-Martínez, Mahamat Habib Bechir, and A. López-Agüera, “Effect of the sustainability indicators within OSeMOSYS optimization transition scenarios.” Energy Strategy Reviews (2024). Volume 54; Pp. 101448; DOI: https://doi.org/10.1016/j.esr.2024.101448. [9] “Introduction to OSeMOSYS — OSeMOSYS 0.0.1 documentation.” Accessed: Mar. 14, 2022. [Online]. Available: https://osemosys.readthedocs.io/en/latest/manual/Introduction.html [10] Mahamat Habib Bechir, and A. L. Aguera, “Environmental Sustainability Impact as Optimization Function of OSeMOSYS Energetic Modelling System,” Int J Res Appl Sci Eng Technol, vol. 11, no. 9, pp. 364–376, Sep. 2023, doi: 10.22214/ijraset.2023.55662. [11] Y. Almulla, O. Broad, A. F. Shivakumar, E. Ramos, G. Avgerinopoulos, and M. Howells, “Model Management Infrastructure (MoManI) Training Manual,” KTH-dESA, pp. 1–61, 2017. [12] E. Isaac and E. Chikweru, “Test for Significance of Pearson’s Correlation Coefficient ( ).” [Online]. Available: www.seahipaj.org [13] “The Correlation Coefficient: What It Is and What It Tells Investors.” Accessed: May 24, 2024. [Online]. Available: https://www.investopedia.com/terms/c/correlationcoefficient.asp [14] M. M. Mukaka, “Statistics Corner: A guide to appropriate use of Correlation coefficient in medical research,” 2012. [Online]. Available: www.mmj.medcol.mw [15] S. Kotsiantis, D. Kanellopoulos, and P. E. Pintelas, “Data Preprocessing for Supervised Learning,” 2014. [Online]. Available: https://www.researchgate.net/publication/228084519
Copyright
Copyright © 2024 Mahamat Habib Bechir, D. Ferreria-Martinez, A. Lopez-Aguera . This is an open access article distributed under the Creative Commons Attribution License, which permits unrestricted use, distribution, and reproduction in any medium, provided the original work is properly cited.

Download Paper
Paper Id : IJRASET63572
Publish Date : 2024-07-07
ISSN : 2321-9653
Publisher Name : IJRASET
DOI Link : Click Here
 Submit Paper Online

