

Ijraset Journal For Research in Applied Science and Engineering Technology
The Entrepreneurial Journey of Women in Jammu: A Detailed Exploration
Authors: Dr. Shivani Sawhney
DOI Link: https://doi.org/10.22214/ijraset.2025.66846
Certificate: View Certificate
Abstract
Entrepreneurship is increasingly recognized as an important driver of economic growth, productivity, innovation and employment, and it is widely accepted as a key aspect of economic dynamism. Entrepreneur is the key factor of entrepreneurship and now women have been recognized as successful entrepreneurs as they have qualities desirable and relevant for entrepreneurship development. Entrepreneurship is a more suitable profession for women than regular employment in public and private sectors since they have to fulfill dual roles. Increasingly, female entrepreneurs are considered important for economic development. Not only do they contribute to employment creation and economic growth through their increasing numbers, but they also make a contribution to the diversity of entrepreneurship in the economic process. This study was designed to assess the factors that affect the performance of women entrepreneurs . It also addressed the characteristics of enterprises owned by women entrepreneurs in Jammu. A representative sample of women entrepreneurs from district of Jammu of UT of Jammu and Kashmir was taken for the study using stratified and simple random sampling. The data was collected through structured interviews and analyzed it using various statistical techniques such as frequency, percentage, mean score, correlation coefficient, and multiple regression. The study reveales that the majority of entrepreneurs were engaged in manufacturing and service-related enterprises. Sole proprietorship and home-based operations were prevalent, driven by self-motivation and a desire for independence. Many entrepreneurs explored business ideas themselves, often with a short gestation period and minimal external financing. Training, primarily informal, played a crucial role in their preparation for entrepreneurship. Based on the major findings, recommendations were forwarded to existing and potential entrepreneurs, MSEs and Micro finance agencies.
Introduction
I. INTRODUCTION
“There is no limit to what we, as women, can accomplish.” – Michelle Obama.
Entrepreneurship is a cornerstone of innovation and economic advancement, symbolizing courage, resilience, and the pursuit of opportunities. Entrepreneurs drive societal progress by challenging existing paradigms, fostering creativity, and contributing to economic growth through job creation and technological advancements. This transformative process not only benefits individuals but also propels nations toward sustainable development. Women entrepreneurship, a rising force in the global economic landscape, is redefining traditional business narratives. Women entrepreneurs bring unique perspectives, blending economic goals with social impact, and often navigating unique challenges posed by gender biases, limited access to capital, and socio-cultural expectations. According to Brush, de Bruin, and Welter (2006), women entrepreneurs play a critical role in fostering inclusivity and innovation, leveraging their businesses to address societal issues and bridge gaps in underserved markets.
The importance of women entrepreneurship for economic development cannot be overstated. They also have created substantial contributions to job creations and some innovations across several sectors which varies from small scale enterprises to export oriented businesses. Moreover, some women entrepreneurs also have championed the social development through their efforts to empower other women, and their efforts to improve the education system and healthcare and also to address some critical social issues which are prevalent in India today. Their efforts extend way beyond making profit for their organizations only, with many women entrepreneurs also focusing on creating a business which will prioritize the social impact and environmental sustainability. Despite the challenges which are still in this country today and despite there are several gender biases and limited accesses to finance and several kinds of struggle to balance the entrepreneurial pursuits with family responsibility, the opportunities for women entrepreneurs in India are growing( Ali et al., 2023). Women-led businesses contribute to GDP growth, create employment opportunities, and drive inclusive development. For instance, in developing economies such as India, women entrepreneurs are playing a vital role in alleviating poverty and boosting innovation. Programs like the "Stand-Up India" initiative aim to support their endeavors, reflecting their growing significance in the national economy (Chatterjee & Das, 2020). Women’s participation in entrepreneurship is not just a matter of gender equality but a crucial element for sustainable and inclusive growth.
Research highlights that women entrepreneurs face a unique interplay of internal and external factors influencing their ventures. Internally, factors such as self-efficacy, leadership style, and risk tolerance play critical roles. Externally, socio-cultural expectations, lack of access to capital, and institutional barriers often hinder women’s entrepreneurial aspirations. For instance, a study by Brush et al . , (2006) revealed that women face significant obstacles in acquiring financial resources due to gender biases within financial institutions. Similarly, familial obligations and societal norms in many cultures add to the complexities of women's entrepreneurial pursuits (Carter et al . , 2015).
II. REVIEW OF LITERATURE
The entrepreneurial journey among women has been a subject of increasing academic focus, given its critical implications for societal and economic development. This section reviews key studies that explore various dimensions of women entrepreneurship, including motivations, challenges, and contributions.
Studies highlight diverse motivations behind women's entrepreneurial endeavors. Minniti and Naudé (2010) emphasize intrinsic factors such as personal fulfillment and independence, alongside extrinsic drivers like economic necessity. Similarly, a study by Brush et al. (2006) underscores how many women entrepreneurs align their ventures with personal values, striving for both economic success and societal impact. In addition, Cho et al. (2021) identify necessity-driven push factors (e.g., economic need) and opportunity-based pull factors (e.g., self-fulfillment) as key motivations for women entrepreneurs in South Korea, influenced by cultural and structural elements. The GEM Report (2020-2021) highlights the adaptability of women entrepreneurs, particularly in developing countries, who often view entrepreneurship as a pathway to improved quality of life, even amidst challenges like the COVID-19 pandemic. These findings demonstrate how women balance personal aspirations and societal contributions within varying cultural contexts. In India, the need to support family income often acts as a push factor, particularly in rural areas (Singh, 2012). Opportunity-driven entrepreneurship, such as leveraging digital platforms, is more common among urban, educated women (Deshpande & Sethi, 2009). Women in India often identify entrepreneurial opportunities based on market gaps in traditional sectors such as handicrafts, textiles, and food processing. Kumar (2014) highlights the role of self-help groups and microfinance institutions in fostering entrepreneurial ideas. Digital marketplaces and government initiatives like Startup India have further expanded opportunities for women entrepreneurs, particularly in non-traditional sectors (Global Entrepreneurship Monitor, 2020). Access to capital remains a significant challenge for women entrepreneurs in India. Tambunan (2009) found that women predominantly rely on informal sources like personal savings or loans from family and friends. Government schemes, such as Mudra Yojana and Stand-Up India, aim to mitigate financial barriers but often face limitations in reach and execution (Patel, 2019).
III. OBJECTIVES OF THE STUDY
The study was designed to assess the entrepreneurial process of women entrepreneurs in Jammu district of UT of Jammu and Kashmir. Specifically , it is intended to assess:
- The characteristics of enterprises owned by women entrepreneurs.
- The motivation factors that affect the performance of women entrepreneurs.
IV. RESEARCH METHODOLOGY
The present study was carried out in the Jammu District of UT of Jammu and Kashmir. The sampling procedure for this research was centered on selecting a representative sample of women entrepreneurs in the Jammu District to collect data for analysis. A list of women entrepreneurs was procured from the DIC (District Industries Centre) office. Women entrepreneurs were selected who have procured loan from bank of Rs. 50,000 or more and running the enterprise (minimum) from the last five years. The data were collected through well-structured pretested interview schedule personally by the researcher. The inferences were drawn on the basis of frequency, percentage, mean score, correlation-coefficient and multiple regression.
V. RESULTS AND DISCUSSION
Analysis of the entrepreneurial process among women entrepreneurs included the examination of various aspects, as outlined in the following subsections:
- Characteristics of businesses managed by women entrepreneurs
- Participation of women in diverse entrepreneurial activities
- Establishment year of the enterprises
- Nature of ownership and location of the enterprises
- Motivational factors influencing women entrepreneurs
- Origin of entrepreneurial ideas
- Duration taken to complete entrepreneurial projects
- Funding sources for entrepreneurial endeavours
- Channels through which women entrepreneurs acquire training
- Identifying additional training requirements for women entrepreneurs
A. Characteristics of businesses managed by women entrepreneurs
Characteristics of businesses run by women professionals in different industries in Jammu illustrated in Table 1. The areas considered were Jammu North, Jammu South, R.S. Pura, Marh, Akhnoor, Chowki Chaura, Khoor, with corresponding sample size(s) mentioned for each area These types of industries are categorized by sector, with commercial, religion, manufacturing co-business, manufacturing co-service.
Table 1: Business type
|
Nature of Enterprise |
Jammu North n=11 |
Jammu South n=11 |
R.S. Pura n=11 |
Marh n=11 |
Akhnoor n=12 |
Chauki Choura n=11 |
Khour=8 |
Total(75) |
|
Manufacture |
6(54.5%) |
5(45.4%) |
4(36.3%) |
4(36.3%) |
5(45.4%) |
6(54.5%) |
3(37.5%) |
33(44%) |
|
Trading |
1(9.09%) |
2(18.18%) |
1(9.09%) |
1(9.09%) |
2(16.6%) |
1(9.09%) |
0(0.00%) |
8(10.6%) |
|
Service |
2(18.18%) |
2(18.18%) |
3(27.27%) |
2(18.18%) |
3(25%) |
1(9.09%) |
3(37.5%) |
16(21.3%) |
|
Manufacturing cum Trading |
0(0.00%) |
0(0.00%) |
1(9.09%) |
1(9.09%) |
0(0.00%) |
1(9.09%) |
2(25%) |
5(6.6%) |
|
Manufacturing cum Service |
2(18.18%) |
2(18.18%) |
3(27.27%) |
4(36.3%) |
2(16.6%) |
3(27.27%) |
0(0.00%) |
16(21.3%) |
Manufacturing sector dominated the business landscape across the surveyed regions, representing 44% of the total enterprises. Jammu North, Chauki Choura, and Akhnoor have the highest concentration of manufacturing businesses, indicating a strong presence of industrial activities in these areas. This suggested a potential focus on production and industrial development in these regions. While trading enterprises constitute a smaller proportion (10.6%) compared to manufacturing, they still play a significant role in the local economies. Jammu South stands out with the highest representation of trading businesses, suggesting a thriving trade environment in that region. Service-oriented businesses make up 22.6% of the total enterprises, with RS Pura and Chauki Choura having the highest representation. This indicates a growing service sector in these regions, possibly driven by factors such as urbanization and changing consumer preferences. Manufacturing cum Trading and Manufacturing cum Service categories represent a smaller percentage of the total businesses (6.6% and 21.3% respectively). However, they highlight the presence of hybrid business models combining manufacturing with either trading or service provision. Marh and Chauki Choura emerge as significant contributors to the manufacturing cum service category, suggesting a diversification of business activities in these regions.
B. Participation of women in diverse entrepreneurial activities
Table 2: Entrepreneurial activities
|
Activities
|
Jammu North |
Jammu South |
R.S. Pura |
Marh |
Akhnoor |
Chauki Choura |
Khour |
Total
|
Rank
|
|
n=11 |
n=11 |
n=11 |
n=11 |
n=12 |
n=11 |
n=8 |
|||
|
Manufacturing |
I |
||||||||
|
a) Travelling & school bags |
1 |
1 |
0 |
1 |
0 |
0 |
1 |
4 |
|
|
b) Label designing |
0 |
1 |
0 |
0 |
0 |
1 |
1 |
3 |
|
|
c) Steel utensils |
0 |
0 |
1 |
0 |
1 |
0 |
0 |
2 |
|
|
d) Lakh churi |
1 |
0 |
1 |
0 |
0 |
1 |
0 |
3 |
|
|
e) Foot mats |
0 |
0 |
0 |
0 |
0 |
0 |
0 |
0 |
|
|
f) Sanitary napkins & soft toys |
1 |
1 |
1 |
1 |
1 |
1 |
1 |
7 |
|
|
g) Plastic bowl |
1 |
0 |
0 |
0 |
1 |
1 |
0 |
3 |
|
|
h) Woolen wear |
1 |
1 |
0 |
1 |
1 |
0 |
0 |
4 |
|
|
i) Surf making |
0 |
1 |
1 |
0 |
0 |
1 |
0 |
3 |
|
|
j) Mushroom cultivation |
0 |
0 |
0 |
1 |
0 |
0 |
0 |
1 |
|
|
k) Candle making |
1 |
0 |
0 |
0 |
1 |
1 |
0 |
3 |
|
|
Total |
6 |
5 |
4 |
4 |
5 |
6 |
3 |
33 |
|
|
Trading a) Handloom products |
1 |
1 |
0 |
1 |
1 |
0 |
0 |
4 |
IV
|
|
b) Garments (Ladies wear) |
0 |
0 |
0 |
0 |
0 |
0 |
0 |
0 |
|
|
c) Toys & gifts |
0 |
0 |
1 |
0 |
1 |
1 |
0 |
3 |
|
|
d) Cosmetics |
0 |
1 |
0 |
0 |
0 |
0 |
0 |
1 |
|
|
Total |
1 |
2 |
1 |
1 |
2 |
1 |
0 |
8 |
|
|
Service |
II |
||||||||
|
a) Boutique |
1 |
0 |
1 |
0 |
1 |
0 |
1 |
4 |
|
|
b) Beauty parlour |
1 |
0 |
0 |
1 |
1 |
0 |
0 |
3 |
|
|
c) Advertising agency |
0 |
1 |
0 |
0 |
0 |
0 |
1 |
2 |
|
|
d) Health services |
0 |
0 |
1 |
1 |
0 |
1 |
0 |
3 |
|
|
e) Coaching/ teaching |
0 |
0 |
0 |
0 |
0 |
1 |
0 |
1 |
|
|
f) Paying guest (Hostel) |
0 |
1 |
0 |
0 |
0 |
0 |
1 |
2 |
|
|
g) Home delivery of food Items |
0
|
0
|
1
|
0
|
1
|
0
|
0
|
2 |
|
|
Total |
2 |
2 |
3 |
2 |
3 |
1 |
3 |
17 |
|
|
Manufacturing-cum-trading |
|
||||||||
|
a) Jewellery showroom |
0 |
0 |
1 |
1 |
0 |
1 |
2 |
5 |
V |
|
Manufacturing-cum- service |
III |
||||||||
|
a) Mushroom cultivation & contractor |
0
|
1
|
1
|
1
|
0
|
0
|
0
|
3 |
|
|
b) Mushroom cultivation, cattle feed manufacturing & organizing trainings |
1 |
1 |
1 |
1 |
1 |
1 |
0 |
6 |
|
|
c) Foot-mat manufacturing & running an educational Society |
1
|
1
|
1
|
2
|
1
|
1
|
0
|
7 |
|
|
Total |
2 |
2 |
3 |
4 |
2 |
3 |
0 |
16 |
|
The proportion of women involved in entrepreneurial activities was shown in Table 2 and Figure 1 Areas such as Jammu North, Jammu South, R.S. Pura, Marh, Akhnoor, Chowki Chaura and Khour. Activities are categorized as manufacturing, marketing, services, manufacturing-cum-business, and manufacturing-cum-service.
1) Construction
Women in Jammu North were involved in manufacturing products like Travel & school bags, Label designing, Steel utensils, Lakh churi, Foot mats, Sanitary napkins & soft toys, Plastic bowl, Woolen wear, Surf making, Mushroom cultivation, and Candle making The total number of these projects is 33, which ranks first in the states.
2) Business
Commercial activities, including Handloom products, Garments (Ladies wear), Toys & gifts, Cosmetics were also taking place. The total number of these business activities is 8, Jammu North ranks first in this category as well.
3) Service
Women in the identified areas were actively involved in service-related industries, such as retail outlets, beauty salons, advertising agencies, healthcare, training/education, paying guests (hotel), food for home delivery and the total number of service activities is 17. Jammu North tops the list in this category.
4) Production-cum-marketing
This category combines manufacturing and marketing. Jammu North has a total count of 2 and ranks fourth in the area.
5) Products-cum-services
Women were also involved in production and cooperative ventures, including mushroom farming & contractor, mushroom farming, animal feed production & training sessions, and Foot-mat making & running educational societies total count of this category 16, while Jammu North ranks third.
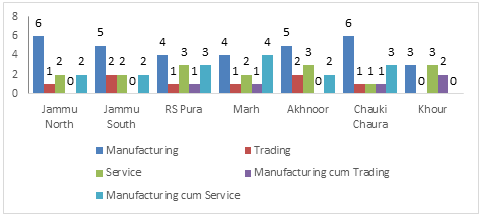
Figure 1: Region wise entrepreneurial activities
C. Establishment year of the Enterprises
Table 3: Year of establishment in the various regions of the Jammu for the different activities.
|
Year of Establishment |
Jammu North |
Jammu South |
RS Pura |
Marh |
Akhnoor |
Chauki Choura |
Khour |
Total |
|
|
1985-1995 |
3(27.27%) |
4(36.4%) |
2(18.18%) |
5(45.11%) |
3(25%) |
2(18.18%) |
2(25%) |
21(28%) |
|
|
1996-2005 |
4(36.4%) |
3(27.27%) |
5(45.11%) |
3(27.27%) |
4(35.33%) |
4(36.4%) |
3(37.5%) |
26(34.67%) |
|
|
2006-2015 |
2(18.18%) |
2(18.18%) |
3(27.27%) |
2(18.18%) |
4(35.33%) |
3(27.27%) |
2(25%) |
18(24%) |
|
|
2016 onwards |
2(18.18%) |
2(18.18%) |
1(9.1%) |
1(9.1%) |
1(8.33%) |
2(18.18%) |
1(12.5%) |
10(13.33%) |
|
Data from the founding years provide a timeline of women-led projects in various sectors of Jammu shown in Table 3. Notably, a large proportion of these jobs have occurred between 1985 and 1995, with percentages ranging from 18.18% to 45.11% in various sectors This indicates that women employees in Jammu, where Marh. There is there a surprising amount of spaces for parks and squares. The period from 1996 to 2005 also shows a large number of projects ranging from 27.27% to 45.11%, which means that they continued to be established during this decade followed by 2006 to 2015, and the percentage increase has varied from 2016 onwards, indicating the emergence of various projects at different times Chowki Chaura stands out among the number of companies established in recent times. Overall, this contemporary study not only highlights the historical presence of women entrepreneurs but also highlights the evolving landscape of women-led businesses in Jammu, and provides insights into dynamic business trends in the region over the years.
D. Nature of ownership and location of the enterprises
Table 4.: Nature of ownership and location of the enterprises
|
S.No. |
Variables |
Jammu North |
Jammu South |
RS Pura |
Marh |
Akhnoor |
Chauki Choura |
Khour |
Total |
|
1. |
Ownership of the enterprises |
||||||||
|
a |
Sole-Proprietorship |
6(54.5%) |
8(72.7%) |
7(63.63%) |
6(54.5%) |
5(41.67%) |
7(63.63%) |
5(62.5%) |
44(56.41%) |
|
b |
Partnership |
5(45.5%) |
3(27.27%) |
4(36.36%) |
5(45.5%) |
7(58.33%) |
4(36.36%) |
3(37.5%) |
31(39.74%) |
|
2. |
Location of the enterprise |
||||||||
|
a |
Home |
4(36.4%) |
3(27.27%) |
5(36.36%) |
5(45.5%) |
3(25%) |
3(27.27%) |
2(25%) |
25(32.05%) |
|
b |
Rented Shop |
5(45.5%) |
3(27.27%) |
3(27.27%) |
2(18.18%) |
4(35.33%) |
4(36.36%) |
2(25%) |
23(29.49%) |
|
c |
Owned Shop |
1(9.1%) |
2(18.18%) |
2(18.18%) |
3(27.27%) |
2(16.67%) |
2(18.18%) |
1(12.5%) |
13(16.67%) |
|
d |
Industrial Area (Govt.) |
1(9.1%) |
3(27.27%) |
3(27.27%) |
1(8.33%) |
3(25%) |
2(18.18%) |
3(37.5%) |
16(20.51%) |
Pattern of ownership and location of women-owned enterprises in Jammu's industries highlighted in Table 4. In terms of ownership, a large proportion of women-led enterprises were sole proprietorships, with percentages ranging from 41.67% to 72.7% across regions, although less frequent, but still varying from 27.27% and 58.33% respectively. Regarding the location of these businesses, most were from chartered shops, ranging from 18.18% to 45.5%, followed by home, with percentages ranging from 25% to 45.5%. The data showed differences by ownership and the preferred location of women entrepreneurs in communities. For example, a significant percentage of firms in Chouki Chaura were sole proprietorships, with a significant number operating from home. On the other hand, partnerships based on ownership were more prevalent in Akhnoor, a large proportion of businesses were in rented shops. These data shed light on, and provide insight into, the working conditions and options available to women in Jammu valuable for policy makers, women’s work in regional and aid organizations aiming for development.
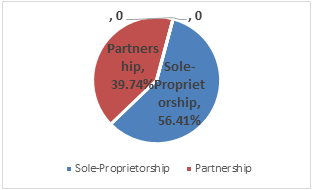
Figure 4: Nature of ownership
E. Motivational Factors Influencing Women Entrepreneurs
The various motivations of women entrepreneurs in different parts of Jammu were shown in Table5. The percentages represent the distribution of responses in each category, and shed light on the main influences driving the performance measures.
Table 5: Motivational factors
|
Source of Motivation |
Jammu North |
Jammu South |
RS Pura |
Marh |
Akhnoor |
Chauki Choura |
Khour |
Total |
|
Self-motivated |
2(18.18%) |
1(9.09%) |
2(18.18%) |
3(27.27%) |
3(16.67%) |
2(18.18%) |
2(37.5%) |
15(19.23%) |
|
Husband |
3(27.27%) |
3(27.18%) |
2(18.18%) |
3(27.27%) |
3(16.67%) |
3(18.18%) |
1(20%) |
18(23.08%) |
|
Parents |
1(9.09%) |
2(18.18%) |
2(18.18%) |
2(18.18%) |
2(16.67%) |
2(18.18%) |
2(20%) |
13(16.67%) |
|
Relatives |
3(27.27%) |
3(27.18%) |
1(9.09%) |
1(9.09%) |
2(16.67%) |
2(18.18%) |
2(25%) |
14(17.95%) |
|
Any other (KVK, DRDA, NGO, SHG member) |
2(18.18%) |
2(18.18%) |
4(36.36%) |
2(18.18%) |
2(8.33%) |
2(18.18%) |
1(20%) |
15(19.23%) |
A remarkable 18.18% of women in Jammu North indicated that self-motivation was an important factor, while 27.27% said their motivation came from family, friends and government officials, indicating a multi-faceted influence on employment by effort. Family and friends contributed significantly at 18.18% and 27.27%, respectively.
The percentages in R.S. Pura, Marh and Akhnoor highlight the importance of self-motivation, family influence and the supporting role of friends in motivating activities. Besides, the data shows the impact of government officials as a catalyst in R.S. Pura, Akhnoor and Chowki Chaura.
The findings highlighted the presence of active women’s entrepreneurial incentives in different parts of Jammu. While self-motivation is a common theme, the influences of relatives, friends, government officials and family members highlight a range of factors that contribute to women’s entrepreneurial spirit in these areas.
F. Origin of Entrepreneurial Ideas
A cursory glance of the data presented in Table 6 revealed the sources of entrepreneurial inspiration of women entrepreneurs in different parts of Jammu with percentages distribution of responses in each category, and shed light on the main influences driving the performance measures.
Table 6: Source of Idea
|
Source of Idea |
Jammu North |
Jammu South |
R.S. Pura |
Marh |
Akhnoor |
Chauki Choura |
Khour |
Total |
|
Self |
2 (18.18%) |
1 (9.09%) |
2 (18.18%) |
3 (27.27%) |
2 (16.67%) |
2 (18.18%) |
3 (37.5%) |
15 (19.23%) |
|
Relatives |
3 (27.27%) |
2 (18.18%) |
3 (27.27%) |
2 (18.18%) |
2 (16.67%) |
1 (9.09%) |
2 (25%) |
15 (19.23%) |
|
Friends |
3 (27.27%) |
3 (27.27%) |
1 (9.09%) |
2 (18.18%) |
1 (8.33%) |
3 (27.27%) |
1 (12.5%) |
14 (17.95%) |
|
Government Official |
2 (18.18%) |
2 (18.18%) |
3 (27.27%) |
2 (18.18%) |
2 (16.67%) |
2 (18.18%) |
1 (20%) |
14 (17.95%) |
|
Family |
1 (9.09%) |
3 (27.27%) |
2 (18.18%) |
3 (27.27%) |
4 (33.33%) |
3 (27.27%) |
1 (12.5%) |
17 (21.79%) |
A remarkable 18.18% of women in Jammu North indicated that self-motivation was an important factor, while 27.27% said their motivation came from family, friends and government officials, indicating a multi-faceted influence on employment by effort. Family and friends contributed significantly at 18.18% and 27.27%, respectively.
The percentages in R.S. Pura, Marh and Akhnoor highlight the importance of self-motivation, family influence and the supporting role of friends in motivating activities. Besides, the data shows the impact of government officials as a catalyst in R.S. Pura, Akhnoor and Chowki Chaura.
The majority of respondents reported that their entrepreneurial ideas originated from their family members, accounting for 21.79% of the total ideas across all regions. Meanwhile, the minority of respondents stated that their ideas came from friends, constituting 17.95% of the total ideas.
G. Duration Taken to complete Entrepreneurial Projects
The length of time taken to complete administrative transactions at different locations in Jammu, highlighting different periods portrayed in Table7.
Table7: Time taken to complete the project
|
Time period/Area |
Jammu North |
Jammu South |
RS Pura |
Marh |
Akhnoor |
Chauki Choura |
Khour |
Total |
|
< 3 months |
2 (11.11%) |
3 (27.27%) |
4 (36.36%) |
3 (27.27%) |
4 (33.33%) |
3 (28.57%) |
1 (12.5%) |
20 (25.64%) |
|
3-6 months |
2 (11.11%) |
2 (11.11%) |
4 (36.36%) |
3 (27.27%) |
2 (16.67%) |
3 (28.57%) |
2 (28.57%) |
18 (23.08%) |
|
6-12 months |
2 (11.11%) |
2 (11.11%) |
1 (9.9%) |
4 (36.36%) |
2 (16.67%) |
1 (7.14%) |
2 (25%) |
14 (17.95%) |
|
12-24 months |
3 (27.27%) |
2 (11.11%) |
2 (18.18%) |
1 (9.09%) |
3 (33.33%) |
1 (14.28%) |
3 (37.5%) |
15(20.51%) |
|
> 24 months |
2 (11.11%) |
2 (11.11%) |
0 |
0 |
1 (8.33%) |
3 (21.42%) |
0 |
8 (10.26%) |
Interpreting the findings, it was evident that the majority of projects, constituting 25.64% of the total, were accomplished within a span of less than 3 months. Conversely, a minority proportion, comprising 10.26% of the total, required a duration exceeding 24 months for completion.
Breaking down the data by specific subdivisions reveals nuanced patterns. Notably, areas such as RS Pura and Marh exhibit a significant prevalence of projects completed within the shortest timeframe, with 36.36% of projects concluded in less than 3 months in each area. Conversely, Jammu South demonstrates a higher proportion of projects taking over 24 months to complete, accounting for 11.11% of the total.
This analysis underscores the variability in project completion timelines across different regions within Jammu district. While some areas manifest efficiency in swift project execution, others experience prolonged durations for project realization. Such insights are pertinent for understanding the dynamics of project management and resource allocation within the context of regional development initiatives.
H. Funding Sources for Entrepreneurial Endeavors
Funding sources for entrepreneurial endeavors shown in Table 8 provided data on women entrepreneurs in different areas of Jammu, focusing on various factors such as financial indicators, use of real sources of finance, availability of loans from financial institutions, amount of loans. There are areas under consideration Jammu North, Jammu South, R.S. Pura, Marh, Akhnoor, Chowki Chaura, and Khour, each with its own sample size.
Table 8 : Source of funding
|
Source of Finance |
Jammu North |
Jammu South |
R.S. Pura |
Marh |
Akhnoor |
Chauki Choura |
Khour |
Total |
|
Fully aware |
5(45.45%) |
6(54.55%) |
7(63.64%) |
8(72.73%) |
6(50%) |
7(63.64%) |
3(37.5%) |
42(57.53%) |
|
Somewhat aware |
3(27.27%) |
2(18.18%) |
2(18.18%) |
2(18.18%) |
2(16.67%) |
2(18.18%) |
2(25%) |
15(20.55%) |
|
No awareness |
3(27.27%) |
3(27.27%) |
2(18.18%) |
1(9.09%) |
4(33.33%) |
2(18.18%) |
3(37.5%) |
18(24.66%) |
|
Source of Finance* |
||||||||
|
Family wealth |
4(36.36%) |
3(27.27%) |
2(18.18%) |
2(9.09%) |
3(25%) |
4(36.36%) |
0 |
18(23.29%) |
|
Personal wealth |
2(18.18%) |
2(18.18%) |
2(18.18%) |
3(27.27%) |
2(16.67%) |
2(18.18%) |
2(25%) |
15(20.55%) |
|
Bank |
2(18.18%) |
3(27.27%) |
4(36.36%) |
2(18.18%) |
3(25%) |
2(18.18%) |
2(25%) |
18(23.29%) |
|
Relatives/friends |
0 |
1(9.09%) |
1(9.09%) |
0 |
1(8.33%) |
0 |
2(25%) |
5(5.48%) |
|
Private finance |
3(27.27%) |
2(18.18%) |
2(18.18%) |
4(36.36%) |
3(25%) |
3(27.27%) |
2(25%) |
19(26.03%) |
|
Availed loan |
||||||||
|
Yes |
6(54.55%) |
7(63.64%) |
4(36.36%) |
6(54.55%) |
8(66.67%) |
7(63.64%) |
3(37.5%) |
35(47.95%) |
|
No |
5(45.45%) |
4(36.36%) |
7(63.64%) |
5(45.45%) |
4(33.33%) |
4(36.36%) |
5(62.5%) |
33(45.21%) |
|
Up to 1 lac |
4(36.36%) |
5(45.45%) |
3(27.27%) |
2(18.18%) |
4(25%) |
2(18.18%) |
1(12.5%) |
18(24.66%) |
|
1-3 lacs |
3(27.27%) |
2(18.18%) |
4(36.36%) |
4(27.27%) |
2(16.67%) |
3(27.27%) |
1(12.5%) |
18(24.66%) |
|
4-6 lacs |
2(18.18%) |
2(18.18%) |
2(18.18%) |
2(18.18%) |
4(25%) |
2(18.18%) |
3(25%) |
15(20.55%) |
|
7-9 lacs |
2(9.09%) |
0 |
2(9.09%) |
2(18.18%) |
0 |
2(18.18%) |
0 |
6(8.22%) |
|
10 lacs & Above |
0 |
2(9.09%) |
0 |
1(9.09%) |
2(16.67%) |
2(9.09%) |
1(12.5%) |
6(8.22%) |
Across the regions, the majority of respondents tended to be fully aware of their funding sources, with percentages ranging from 37.5% to 72.73%. Notably, Marh had a significant majority of 72.73% fully aware respondents. Conversely, the minority of respondents varied across regions, with some indicating no awareness of their funding sources while others mentioned somewhat awareness. The most common funding sources varied regionally. Family wealth emerged as a prevalent source in areas like Jammu North (36.36%) and Chauki Choura (36.36%), while bank financing was more common in regions like RS Pura (36.36%). Private finance also played a significant role across several areas, including Marh (36.36%) and Chauki Choura (27.27%). Regarding loans, a substantial portion of respondents across regions availed loans for their ventures, with percentages ranging from 36.36% to 63.64%. The data also illustrates the distribution of loan amounts, indicating diverse financing needs among entrepreneurs, with significant portions opting for amounts up to 1 lac and between 1-3 lacs. Overall, these findings depict the varied financial landscapes and funding preferences among entrepreneurs across different regions.Data regarding source of finance used by women entrepreneurs, it is clearly shownthat26 percent respondents had takenassistance from Private finance their.Next important source was family wealth (18.0%) and banks (18.0%). It is also clear from the data that 15.0 percent of the entrepreneurs used personal saving as their main source of start-up funding. Only small proportion of women has taken help from relatives/friends(5.0%).
I. Channels through which women entrepreneurs acquire training
Table 9: Training details
|
Training |
Jammu North |
Jammu South |
R.S. Pura |
Marh |
Akhnoor |
Chauki Choura |
Khour |
Total |
|
Training attended |
|
|||||||
|
Yes |
7 (63.63%) |
6 (54.54%) |
7 (63.63%) |
8 (72.72%) |
6 (50%) |
7 (63.63%) |
4 (50%) |
45 (57.69%) |
|
No |
4 (36.36%) |
5 (45.45%) |
4 (36.36%) |
3 (27.27%) |
6 (50%) |
4 (36.36%) |
4 (50%) |
30 (42.31%) |
|
Training organisation |
|
|||||||
|
a) Govt. org. |
8 (72.72%) |
5 (45.45%) |
8 (72.72%) |
8 (72.72%) |
6 (50%) |
8 (72.72%) |
5 (62.5%) |
48 (61.54%) |
|
b) Private org. |
3 (27.27%) |
6 (54.54%) |
3 (27.27%) |
3 (27.27%) |
6 (50%) |
3 (27.27%) |
3 (37.5%) |
27 (26.92%) |
|
Expenses in training |
|
|||||||
|
a) Nil |
3 (27.27%) |
4 (27.27%) |
6 (54.54%) |
3 (27.27%) |
6 (50%) |
3 (27.27%) |
6 (75%) |
31 (39.74%) |
|
b) Up to 5000 |
5 (45.45%) |
4 (45.45%) |
3 (27.27%) |
5 (45.45%) |
2 (16.67%) |
5 (45.45%) |
2 (25%) |
26 (33.33%) |
|
c) Above 5000 |
3 (27.27%) |
3 (27.27%) |
2 (18.18%) |
3 (27.27%) |
4 (33.33%) |
3 (27.27%) |
0 |
18 (23.08%) |
|
Time took in training |
|
|||||||
|
a) Up to 6 months |
6 (54.54%) |
7 (63.36%) |
8 (72.72%) |
6 (54.54%) |
8 (66.66%) |
6 (54.54%) |
5 (62.5%) |
46 (58.97%) |
|
b) Above 6 months |
5 (45.45%) |
4 (36.36%) |
3 (27.27%) |
5 (45.45%) |
4 (33.33%) |
5 (45.45%) |
3 (37.5%) |
29 (41.03%) |
Detailed overview of the progress of training among women entrepreneurs in various sectors of Jammu depicted in Table 9. The tabulated data delineates the participation of women entrepreneurs in training programs across various sectors within the Jammu region, providing insights into the modalities of training acquisition.
Analysis of the training details indicated that a significant proportion of women entrepreneurs, accounting for 57.69% of the total, have attended training sessions. Within individual areas, attendance rates vary, with Marh exhibiting the highest participation at 72.72%, followed closely by Jammu North and RS Pura, each registering 63.63%.
Regarding the organization facilitating the training, government entities emerge as the predominant source, engaging 61.54% of the women entrepreneurs. This trend is consistent across most areas, with the exception of Jammu South, where private organizations are slightly more prevalent, accounting for 54.54% of training arrangements. In terms of financial commitments associated with training, a notable proportion of entrepreneurs, comprising 39.74% of the total, incurred no expenses. Conversely, 33.33% invested up to 5000 rupees, while 23.08% expended sums exceeding 5000 rupees. This distribution suggests a varied financial landscape concerning training participation, with a significant portion of entrepreneurs accessing training at minimal or no cost.
Regarding the duration of training, a majority of participants, representing 58.97% of the total, completed training within six months. However, a substantial proportion, constituting 41.03%, engaged in training programs lasting longer than six months, indicating a diversity in the duration of training engagements among women entrepreneurs.
This comprehensive examination of training dynamics among women entrepreneurs in Jammu underscores the multifaceted nature of training acquisition, encompassing aspects such as participation rates, organizational sources, financial implications, and duration considerations. Such insights are invaluable for policymakers, stakeholders, and support organizations seeking to design targeted interventions aimed at enhancing the efficacy and inclusivity of entrepreneurial training initiatives within the region.
J. Identifying Additional Training Requirements For Women Entrepreneurs
Table 10: Additional training
|
|
Jammu North |
Jammu South |
R.S. Pura |
Marh |
Akhnoor |
Chauki Choura |
Khour |
|
N=11 |
N=11 |
N=11 |
N=11 |
N=12 |
N=11 |
N=8 |
|
|
Mean_Score |
2.225 |
2.0653 |
2.296 |
1.756 |
1.715 |
2.02 |
2.15 |
|
Rank |
2 |
4 |
1 |
6 |
7 |
5 |
3 |
The mean scores indicate the perceived effectiveness of these resources, with RS Pura ranking the highest at 2.296, followed by Jammu North at 2.225, and Khour at 2.15. Marh received the lowest mean score of 1.756, indicating comparatively less effectiveness. The ranking reveals that RS Pura stands out as the most beneficial in terms of additional training resources, securing the top position, while Marh ranks the lowest. This data suggests variations in the perceived efficacy of additional training resources across the different regions surveyed.
Conclusion
The majority of entrepreneurs were engaged in manufacturing and service-related enterprises, with boutique and beauty parlors being common ventures. Sole proprietorship and home-based operations were prevalent, driven by self-motivation and a desire for independence. Many entrepreneurs explored business ideas themselves, often with a short gestation period and minimal external financing. Training, primarily informal, played a crucial role in their preparation for entrepreneurship.
References
[1] Agarwal, S., & Lenka, U. (2015). Study on work-life balance of women entrepreneurs – review and research agenda. Industrial and Commercial Training, 47(7), 356–362. https://doi.org/10.1108/ICT-01-2015-0006 [2] Allen, I. E., Elam, A., Langowitz, N., & Dean, M. (2007). Global Entrepreneurship Monitor: Report on Women and Entrepreneurship. Babson College and London Business School. [3] Beevi, S., & Devi, V. G. (2011). The Role of Self Help Groups in Empowering Rural Women in India. International Journal of Interdisciplinary Social Sciences, 5(9). [4] Brush, C. G., de Bruin, A., & Welter, F. (2006). Gender and entrepreneurship: Advancing debate and moving forward. Entrepreneurship Theory and Practice, 30(5), 585–593. [5] Carter, S., Anderson, S., & Shaw, E. (2003). Women’s business ownership: A review of the academic, popular, and internet literature. Small Business Service Research Report. [6] Carter, S., Mwaura, S., Ram, M., Trehan, K., & Jones, T. (2015). Barriers to ethnic minority and women’s enterprise: Existing evidence, policy tensions and unsettled questions. International Small Business Journal, 33(1), 49–69. https://doi.org/10.1177/0266242614556823 [7] Chatterjee, S., & Das, N. (2020). Gender-responsive policies and their role in supporting women entrepreneurs in India. Asian Journal of Innovation and Policy, 9(2), 45–63. [8] Chaudhary, R., & Biswas, A. (2018). Challenges faced by women entrepreneurs in India. International Journal of Research and Analytical Reviews, 5(3), 235–242. [9] Cho, Y., Park, J., Han, S. J., Sung, M., & Park, C. (2021). Women entrepreneurs in South Korea: Motivations, challenges, and career success. European Journal of Training and Development, 45(2/3), 97–119. https://doi.org/10.1108/EJTD-03-2020-0039 [10] Das, U., Kumar, S., & Singh, A. (2022). Gender, technology and innovation: The role of women in Indian micro, small and medium enterprises. World Review of Entrepreneurship, Management and Sustainable Development, 18, 429. https://doi.org/10.1504/WREMSD.2022.10046819 [11] De Bruin, A., Brush, C. G., & Welter, F. (2006). Introduction to the Special Issue: Towards Building Cumulative Knowledge on Women’s Entrepreneurship. Entrepreneurship Theory and Practice, 30(5), 585-593. https://doi.org/10.1111/j.1540-6520.2006.00137.x [12] Deshpande, A., & Sethi, S. (2009). Women entrepreneurs in India: Problems and prospects. International Journal of Management Studies, 2(3), 22–33. [13] Global Entrepreneurship Monitor (2020-2021). The GEM 2020/21 Women’s Entrepreneurship Report: Thriving Through Crisis. Babson College. Retrieved from https://entrepreneurship.babson.edu [14] Gupta, S., Jain, S., & Mittal, A. (2014). Digital empowerment of women entrepreneurs in India. The Journal of Entrepreneurship, 23(1), 85–102. [15] Halkias, D., Nwajiuba, C., Harkiolakis, N., & Caracatsanis, S. (2011). Challenges facing women entrepreneurs in Nigeria. Management Research Review, 34(2), 221–235. https://doi.org/10.1108/01409171111102821 [16] Jamali, D. (2009). Constraints and opportunities facing women entrepreneurs in developing countries: A relational perspective. Gender in Management: An International Journal, 24(4), 232–251. [17] Minniti, M., & Naudé, W. (2010). What Do We Know About The Patterns and Determinants of Female Entrepreneurship Across Countries? European Journal of Development Research, 22, 277–293. https://doi.org/10.1057/ejdr.2010.17 [18] Roy, S., Tripathy, P., & Tripathy, P. K. (2017). Assessment of Factors Affecting the Performance of Women Entrepreneurs in MSE in Polosara District of Ganjam, Odisha. Journal of Economics, Management and Trade, 17(3), 1–11. https://doi.org/10.9734/BJEMT/2017/32298 [19] Singh, G. (2012). Women entrepreneurship in India: Problems and prospects. ZENITH International Journal of Multidisciplinary Research, 2(1), 212–221. [20] Tambunan, T. (2009). Women entrepreneurship in Asian developing countries: Their development and main constraints. Journal of Development and Agricultural Economics, 1(5), 27–40.
Copyright
Copyright © 2025 Dr. Shivani Sawhney. This is an open access article distributed under the Creative Commons Attribution License, which permits unrestricted use, distribution, and reproduction in any medium, provided the original work is properly cited.

Download Paper
Paper Id : IJRASET66846
Publish Date : 2025-02-05
ISSN : 2321-9653
Publisher Name : IJRASET
DOI Link : Click Here
 Submit Paper Online