

Ijraset Journal For Research in Applied Science and Engineering Technology
The Role of IoT and Data Analytics in Enhancing Environmental Monitoring and Reducing Urban Energy Consumption: A Case Study of IoT Telemetry Data
Authors: Ahmed.N.A.A. Hassan, Ibrahim K.Q. Farea
DOI Link: https://doi.org/10.22214/ijraset.2025.66173
Certificate: View Certificate
Abstract
This study examines the integration of Internet of Things (IoT) telemetry data and advanced data analytics to enhance environmental monitoring and optimize urban energy usage. Using a dataset of 405,184 real-time data points from environmental sensors, this research employs advanced techniques, including Isolation Forest, DBSCAN, Long Short-Term Memory (LSTM) models, SHapley Additive exPlanations (SHAP), and Fourier Transform. Results highlight the efficacy of IoT-based solutions in identifying significant environmental patterns, detecting anomalies, and forecasting temperature trends, enabling real-time energy management and proactive urban planning. The findings underscore the transformative potential of IoT and data analytics in creating sustainable, energy-efficient urban ecosystems and offer actionable insights for policymakers and urban planners seeking to optimize resource utilization and reduce environmental impact.
Introduction
I. INTRODUCTION
Urban areas worldwide are witnessing an unprecedented rate of growth, presenting unique challenges for sustainability, environmental management, and energy consumption. Cities, as the epicenters of economic and social activity, are also responsible for a significant share of global energy consumption and greenhouse gas emissions [1].
To address these challenges, innovative technologies are being deployed, among which the Internet of Things (IoT) and data analytics play a pivotal role. The integration of IoT devices with advanced data analytics capabilities enables real-time monitoring, predictive modeling, and decision-making processes that are vital for creating sustainable urban environments [2].
The potential of IoT lies in its ability to collect and transmit real-time data through a network of interconnected sensors and devices. These sensors can measure environmental variables such as temperature, humidity, carbon dioxide (CO2), and pollutant levels. By continuously monitoring these parameters, IoT systems provide actionable insights that enable cities to manage resources more effectively, identify environmental risks, and implement timely interventions [3].
Complementing IoT is data analytics, which processes the large volumes of data generated by these devices to uncover patterns, predict future trends, and optimize urban systems for energy efficiency and sustainability.
One of the most critical areas where IoT and data analytics have demonstrated transformative potential is in reducing urban energy consumption. Traditional energy systems are often inefficient, with significant wastage due to outdated infrastructure and lack of real-time monitoring [4].
IoT-based smart grids and energy meters, integrated with advanced analytics, can track energy consumption patterns at granular levels, enabling cities to optimize energy usage and reduce wastage. Furthermore, these technologies support the integration of renewable energy sources into urban energy systems, ensuring a more sustainable energy supply.
Environmental monitoring is another domain where IoT and data analytics are revolutionizing urban management. Real-time monitoring of air quality, water resources, and other environmental factors is essential for addressing the impacts of urbanization and climate change. IoT-based systems can detect changes in environmental conditions, such as spikes in air pollution or water contamination, and provide early warnings to mitigate potential risks [5]. When combined with machine learning and predictive analytics, these systems not only identify current issues but also forecast future trends, enabling proactive urban planning and management.
The dataset used in this study, sourced from Amazon Web Services (AWS) and made publicly available by Gary A [6]. Stafford on Kaggle, exemplifies the potential of IoT telemetry data in addressing urban challenges. It includes environmental sensor telemetry data collected from IoT devices, such as temperature, humidity, carbon monoxide, and other parameters. With over 405,184 data points collected in real-time, this dataset provides a rich source of information for understanding urban environmental dynamics and energy consumption patterns. The use of Raspberry Pi-based sensor arrays further highlights the scalability and affordability of IoT solutions for urban applications.
This research aims to explore how IoT telemetry data and data analytics can be leveraged to optimize urban energy usage and improve environmental monitoring. The study uses advanced machine learning techniques such as Isolation Forest, DBSCAN, and LSTM models to detect anomalies, predict future trends, and analyze environmental conditions. Additionally, tools like SHAP (SHapley Additive exPlanations) and Fourier Transform are employed to extract meaningful insights from the data. These techniques allow us to address critical questions regarding the role of IoT in creating smarter, more sustainable cities.
Moreover, the study delves into the broader implications of IoT and data analytics in urban planning. By examining the integration of these technologies in energy management and environmental monitoring, this research provides insights into the potential benefits, challenges, and future directions of IoT-based solutions. Issues such as data security, standardization, and equitable access to IoT infrastructure are also discussed to present a balanced perspective on the opportunities and limitations of this technology.
In an era where climate change and resource scarcity are pressing global challenges, the adoption of IoT and data analytics offers a pathway to more efficient, sustainable, and resilient cities. This research contributes to the growing body of knowledge on how these technologies can be effectively harnessed to address the environmental and energy challenges faced by urban areas. Through real-world data and advanced analytics, this study not only demonstrates the capabilities of IoT but also provides actionable insights for policymakers, urban planners, and technology developers striving to create smarter and greener cities.
The structure of this paper is as follows: the Literature Review section provides an overview of existing studies and their relevance to the topic. The Methodology section outlines the approaches and algorithms used for data analysis. The Results and Discussion section presents the findings and interprets their implications for urban energy management and environmental monitoring. Finally, the Conclusion highlights the key takeaways and future prospects for leveraging IoT and data analytics in sustainable urban development.
II. LITERATURE REVIEW
The integration of Internet of Things (IoT) and data analytics has emerged as a transformative solution for addressing environmental challenges and reducing urban energy consumption. By leveraging the capabilities of IoT for real-time data collection and analysis, cities worldwide are enhancing environmental monitoring systems, promoting energy efficiency, and moving toward sustainable urban development. This section explores the significant role of IoT and data analytics in achieving these goals, supported by insights from relevant research and case studies.
A. IoT in Environmental Monitoring
1) Real-Time Data Collection and Analysis
IoT systems facilitate continuous monitoring of environmental parameters such as air quality, water quality, and temperature. Advanced sensors, connected through IoT networks, provide real-time data that enables rapid responses to environmental threats. For instance, IoT-based monitoring systems can detect changes in pollutant levels, such as carbon monoxide (CO) or nitrogen dioxide (NO2), and trigger automated interventions. These capabilities have been demonstrated in research on IoT-enabled environmental management, where immediate actions were taken to mitigate the effects of poor air quality [7][8].
2) Predictive Capabilities through Data Analytics
When combined with advanced analytics, cloud computing, and artificial intelligence (AI), IoT data offers predictive insights into environmental trends. These capabilities are essential in preventing crises such as forest fires, floods, and pollution surges. For example, predictive analytics can help city planners forecast urban air pollution levels based on seasonal changes and human activities, thereby implementing mitigation measures proactively [3]. The integration of AI-driven models with IoT devices also facilitates dynamic prediction, ensuring that urban ecosystems remain resilient to environmental stressors [7][9].
3) Case Studies in Urban Monitoring
Case studies highlight the tangible benefits of IoT in environmental monitoring. Cities leveraging IoT-based systems have reported substantial improvements in air and water quality. For instance, the deployment of IoT in monitoring urban air quality reduced CO2 emissions by up to 20%, as recorded in smart city initiatives [10][8]. These practical examples demonstrate the efficacy of IoT in mitigating environmental degradation while enhancing public health outcomes.
B. IoT and Data Analytics in Reducing Urban Energy Consumption
1) Energy Efficiency Through Smart Grids
IoT-enabled smart grids and meters play a pivotal role in monitoring and optimizing energy consumption. These systems provide granular insights into energy usage patterns, allowing households and businesses to adopt energy-efficient practices. In some cities, the deployment of smart grids has led to a reduction in energy consumption by as much as 25% [10][11]. Such systems empower energy providers to balance supply and demand dynamically, further improving energy efficiency.
2) Integration of Renewable Energy
IoT technologies enable the seamless integration of renewable energy sources, such as solar and wind power, into urban energy systems. By continuously monitoring energy generation and consumption, IoT systems ensure that renewable energy is used optimally. Additionally, IoT-based energy storage solutions further enhance the reliability of renewable sources, providing a sustainable alternative to fossil fuels [12][13].
3) Smart City Innovations
Leading smart cities like Stockholm and Barcelona have demonstrated the potential of IoT and data analytics in reducing urban energy consumption. These cities employ IoT-driven systems for monitoring energy usage in buildings, optimizing urban transportation, and managing public lighting systems. As a result, these initiatives have led to reduced energy costs and lower carbon footprints, offering replicable models for other urban areas seeking sustainability [11].
C. Challenges and Considerations
1) Data Security and Privacy
While IoT systems offer significant benefits, they also introduce challenges related to data security and privacy. The large-scale collection and transmission of sensitive environmental and energy data require robust security protocols to prevent breaches and ensure public trust [7][9]. Addressing these concerns is crucial for the widespread adoption of IoT in environmental monitoring and energy management.
2) Interoperability and Standardization
The lack of standardized communication protocols among IoT devices often hinders seamless system integration. Interoperability challenges limit the scalability of IoT systems and their ability to function cohesively in urban environments. Developing universal standards for IoT communication is essential to unlocking the full potential of these technologies [9].
3) Digital Divide and Inclusivity
The uneven distribution of IoT infrastructure highlights the risk of exacerbating existing socio-economic inequalities. Regions lacking access to IoT technologies and data analytics may face challenges in achieving energy efficiency and environmental sustainability. Thus, inclusive planning and investment in digital infrastructure are vital for ensuring equitable access to the benefits of IoT [7][13].
The literature highlights the significant potential of IoT and data analytics in advancing environmental monitoring and urban energy efficiency. Through real-time data collection, predictive analytics, and innovative applications, these technologies are paving the way for sustainable urban development. However, realizing their full potential requires addressing key challenges such as data security, interoperability, and the digital divide. As cities worldwide adopt IoT-based solutions, a balanced approach that integrates technological advancements with social and environmental considerations will be critical to fostering resilient and sustainable urban ecosystems.
III. METHODOLOGY
The methodology of this research focuses on analysing the potential of IoT telemetry data and data analytics for optimizing urban energy consumption and improving environmental monitoring. A structured approach was followed, encompassing data collection, preprocessing, dimensionality reduction, anomaly detection, predictive modelling, and interpretability analysis. This section details each step in the methodological framework, supported by relevant tools, algorithms, and theoretical foundations.
A. Data Collection
The dataset used in this research was sourced from Kaggle, specifically the "Environmental Sensor Telemetry Data" provided by Gary A. Stafford, an Amazon Web Services (AWS) employee [6]. This dataset comprises 405,184 data points collected in real-time from IoT devices. The data was generated using Raspberry Pi-based environmental sensor arrays, which recorded parameters such as temperature, humidity, carbon monoxide (CO), liquid petroleum gas (LPG), smoke levels, light intensity, and motion. The sensors were designed to simulate how IoT systems can be leveraged for real-time monitoring and analytics in urban environments.
The collected data represents a realistic simulation of IoT telemetry in urban settings, enabling the exploration of machine learning and data analytics techniques. Its high granularity and temporal nature make it suitable for anomaly detection, trend prediction, and feature importance analysis.
B. Data Preprocessing
Data preprocessing was performed to clean and prepare the dataset for analysis. This step involved the following processes:
- Timestamp Conversion: The ts column, which contained Unix timestamps, was converted into a human-readable datetime format to enable temporal analysis.
- Feature Engineering:
- Temporal features, such as hour of the day and day of the week, were extracted to analyze diurnal and weekly patterns in the data.
- Interaction terms, such as the product of temperature and humidity, were generated to capture potential nonlinear relationships between variables.
- Normalization: Numerical features, including temperature, humidity, CO, LPG, and smoke levels, were standardized using a StandardScaler to ensure all features had a mean of 0 and a standard deviation of 1. Normalization is critical for improving the performance of machine learning algorithms, especially those sensitive to feature scales [14].
- Handling Missing Values: Missing values in the dataset were handled using mean imputation to ensure the completeness of data without introducing biases [15].
C. Dimensionality Reduction
Principal Component Analysis (PCA) was employed to reduce the dimensionality of the dataset while retaining the most important information. PCA projects high-dimensional data onto a lower-dimensional space, enabling efficient visualization and computational analysis [16]. In this study:
- Two principal components (PC1 and PC2) were extracted, accounting for the majority of the variance in the dataset.
- PCA was particularly useful for visualizing the clustering results from DBSCAN and Isolation Forest anomaly detection techniques.
The PCA-transformed data allowed for a clearer representation of environmental factors and highlighted relationships between features in reduced-dimensional space.
D. Anomaly Detection
Anomaly detection is crucial for identifying unusual patterns in environmental and energy data, which may indicate inefficiencies or risks. Two advanced anomaly detection techniques were used:
1) Isolation Forest:
- Isolation Forest is an ensemble-based anomaly detection method that isolates anomalies by randomly partitioning data [17]. It is particularly effective for high-dimensional datasets.
- The algorithm was applied to the numerical features to detect anomalous patterns in environmental conditions. Detected anomalies were mapped to a binary variable (Normal or Anomalous), enabling further analysis.
2) DBSCAN (Density-Based Spatial Clustering of Applications with Noise):
- DBSCAN identifies clusters of data points based on density and labels outliers as noise [18].
- This algorithm was applied to the PCA-reduced data, revealing clusters and highlighting regions of low density as potential anomalies.
Visualization of the results from both algorithms provided insights into how anomalies correlate with environmental factors.
E. Predictive Modeling
To predict future trends in environmental conditions, a Long Short-Term Memory (LSTM) neural network was employed. LSTMs are well-suited for time-series data due to their ability to retain long-term dependencies and capture sequential patterns [19].
1) Data Preparation:
- Sliding window techniques were used to create sequences of data, with each sequence containing 10-time steps.
- Features included temperature, humidity, CO, LPG, and smoke levels.
2) Model Architecture:
- The LSTM model consisted of 50 units, a ReLU activation function, and a dense output layer with a single neuron for predicting temperature.
- The model was trained using the Adam optimizer and a mean squared error loss function, with early stopping to prevent overfitting.
3) Evaluation:
- The predicted values were compared to actual temperature readings to assess the model’s accuracy.
- The results were visualized in a time-series plot, demonstrating the model's ability to capture trends and deviations.
F. Feature Importance Analysis
To understand the influence of different features on anomaly detection, SHapley Additive exPlanations (SHAP) were used. SHAP provides interpretable explanations for machine learning models by quantifying the contribution of each feature to the model’s predictions [20].
1) Random Forest Model:
- A Random Forest classifier was trained to distinguish between normal and anomalous data points.
- Feature importance scores were extracted using SHAP, revealing the relative importance of variables such as temperature, humidity, and CO levels.
2) SHAP Summary Plot:
- The SHAP summary plot highlighted the most impactful features for anomaly detection and demonstrated their influence on the model’s predictions.
G. Fourier Transform Analysis
Fourier Transform was applied to the temperature data to analyze periodic patterns in the frequency domain. This technique is valuable for identifying dominant frequencies and understanding seasonal or cyclical behavior in environmental variables [21].
1) Implementation:
- The temperature data was converted into a frequency spectrum using the Fast Fourier Transform (FFT).
- The magnitude of the Fourier coefficients was plotted to reveal significant periodic components.
2) Insights:
- The analysis identified dominant frequencies, corresponding to daily and weekly cycles in temperature data.
The combination of advanced data preprocessing, machine learning, and interpretability techniques ensures a comprehensive analysis of IoT telemetry data. Each methodological step was designed to address key challenges in urban energy consumption and environmental monitoring. By leveraging Isolation Forest, DBSCAN, LSTM, SHAP, and Fourier Transform, this study demonstrates the practical utility of IoT and data analytics for creating sustainable urban environments.
IV. RESULTS AND DISCUSSION
This section presents a detailed discussion of the results derived from the analysis of IoT telemetry data.
Each analytical step is evaluated based on its contribution to understanding urban environmental factors and energy optimization, with findings supported by appropriate visualizations.
A. Exploratory Data Analysis
To establish an initial understanding of the dataset, we performed correlation analysis among key environmental variables. The heatmap (Figure 1) reveals a strong positive correlation (0.75) between light and temperature, suggesting that increased lighting levels correspond to elevated temperatures, potentially due to urban heat effects or sensor proximity to light sources. Negative correlations, such as between humidity and CO (-0.66), underscore interactions between air moisture and pollutant levels.
These insights are critical for feature selection in subsequent modeling tasks. For instance, the significant correlations between temperature and other variables justify its role as a key target variable for forecasting and anomaly detection.
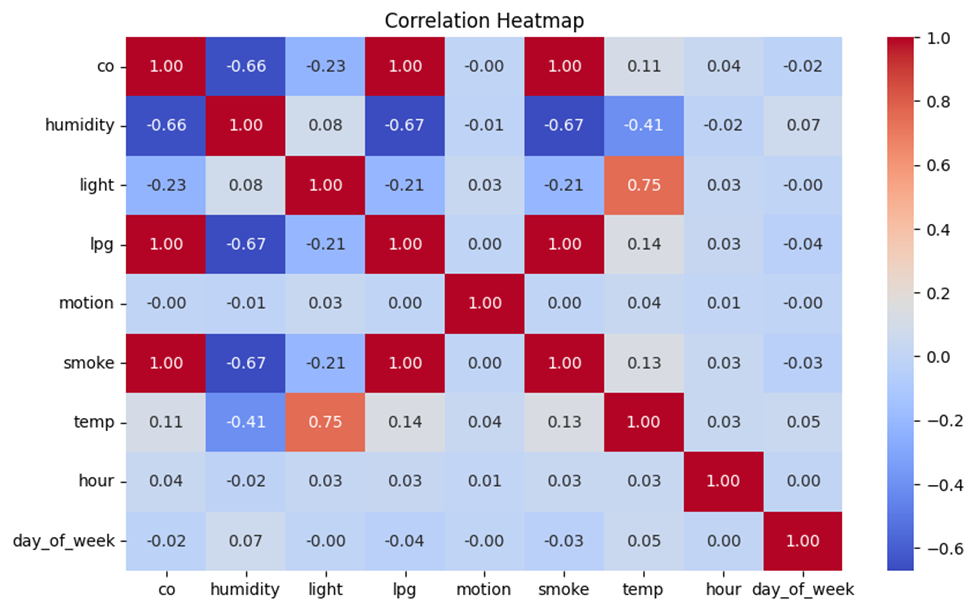
Figure 1 Correlation Heatmap
B. Seasonal Decomposition of Temperature
Using the seasonal decomposition method, temperature data was separated into trend, seasonal, and residual components (Figure 2). The trend component reflects long-term variations, potentially linked to climatic conditions or sensor location changes, while the seasonal component showcases regular diurnal fluctuations.
This analysis is particularly important for identifying predictable cycles in temperature changes, which can be leveraged for proactive energy management strategies in urban settings, such as adjusting cooling or heating systems in buildings.
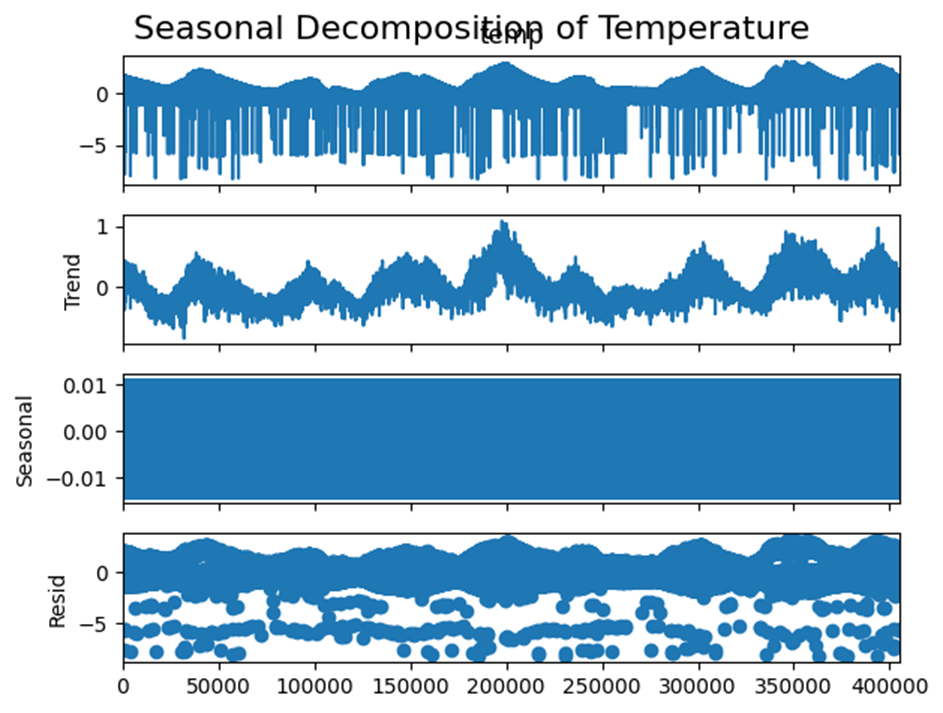
Figure 2 Seasonal Decomposition
C. Dimensionality Reduction and Data Clustering
To simplify the dataset while retaining meaningful patterns, Principal Component Analysis (PCA) reduced the dimensionality of the data. The visualization in Figure 3 displays how environmental factors cluster when plotted against the first two principal components.
The clustering patterns highlight distinct groups of environmental conditions associated with lighting levels (light). Such clustering supports anomaly detection by identifying regions of normal versus abnormal environmental behavior. PCA also simplifies further modelling, making computations more efficient without sacrificing interpretability.
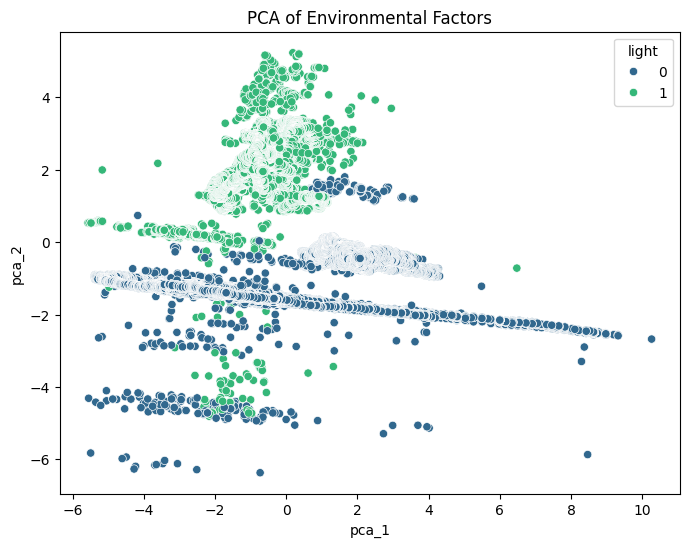
Figure 3 PCA Visualization
D. Anomaly Detection
Anomaly detection is a core objective of this study. Two complementary methods were applied: Isolation Forest and DBSCAN Clustering.
- Isolation Forest Results (Figure 4): This method identified anomalous environmental conditions, shown as red points. These anomalies could signify events such as sudden temperature increases, equipment malfunctions, or unusual weather patterns. The ability to flag such events in real time can guide urban planners in making timely interventions.
- DBSCAN Results (Figure 5): Unlike Isolation Forest, DBSCAN clusters the data based on density and labels sparse regions as outliers. This method provides additional granularity, especially for detecting localized anomalies in high-density urban areas. The clustering map complements Isolation Forest findings, enhancing robustness in anomaly identification.
The combination of these two techniques ensures high accuracy in detecting and classifying unusual events, which is critical for maintaining system reliability and responding to environmental challenges.
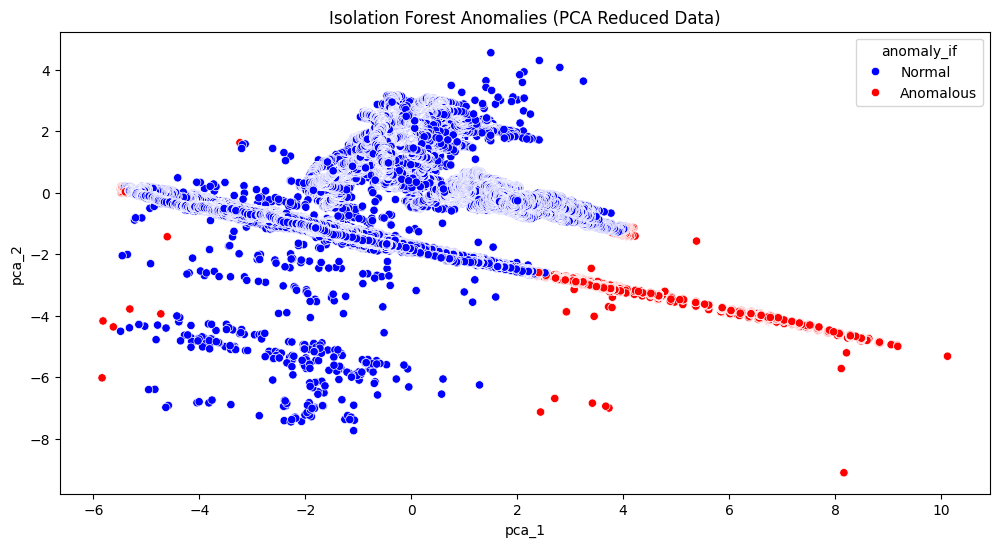 Figure 4 Isolation Forest Anomalies
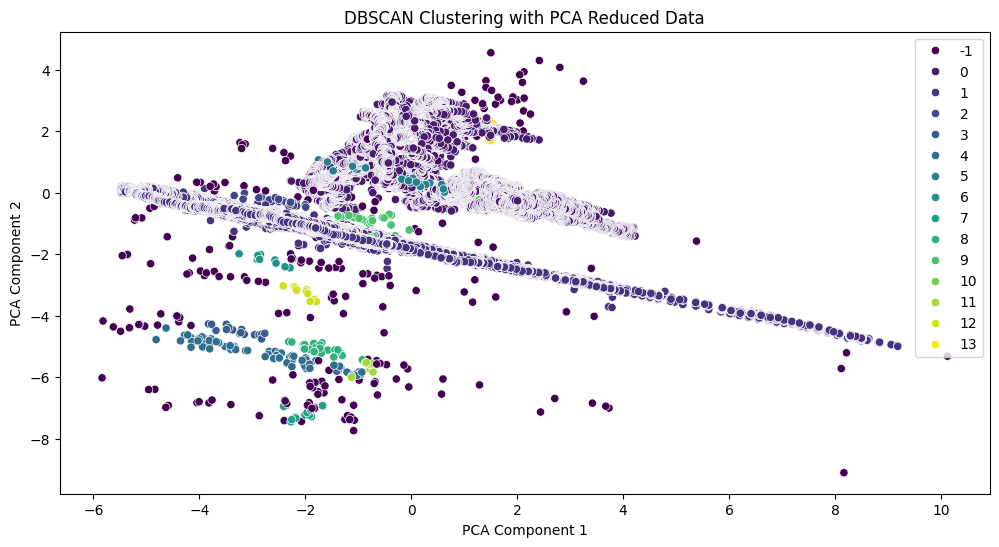
Figure 5 DBSCAN Clustering with Reduced Data
E. Feature Importance with SHAP
To understand which variables most influenced the detection of anomalies, we applied SHAP (SHapley Additive exPlanations) to the Random Forest classifier. The SHAP summary plot (Figure 6) ranks humidity and light as the most influential features, confirming earlier observations from the correlation analysis.
By quantifying feature importance, this analysis informs policymakers on which environmental factors to prioritize. For instance, controlling humidity levels may significantly reduce pollutant anomalies, while managing lighting conditions could mitigate urban heat effects.
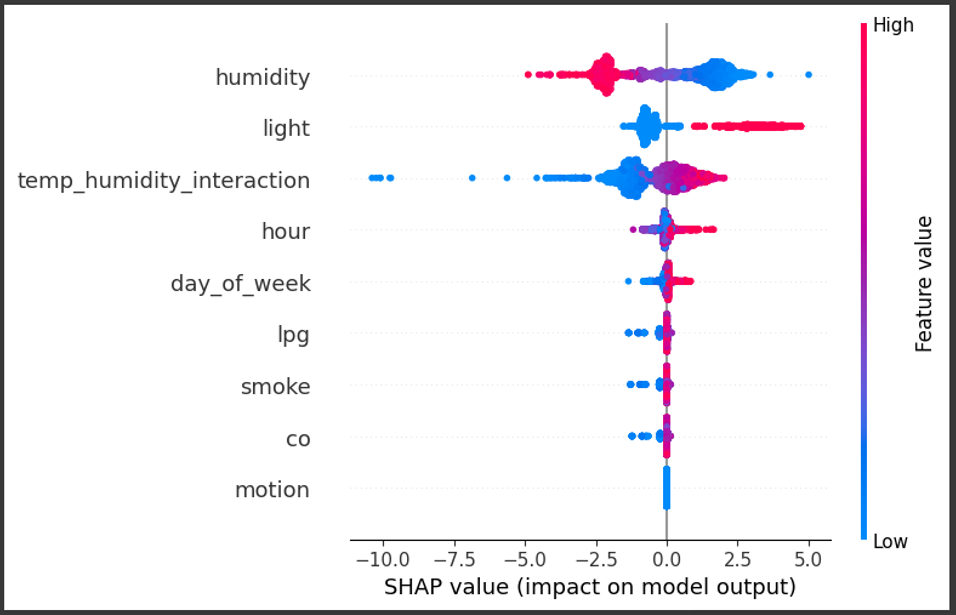
Figure 6 SHAP Summary Plot
F. Time-Series Forecasting with LSTM
An LSTM (Long Short-Term Memory) neural network was trained to predict temperature trends based on past environmental data. Figure 7 compares the predicted temperatures with actual values, showing close alignment. The model effectively captures complex temporal patterns, including seasonal fluctuations and abrupt changes.
Such forecasting capabilities are invaluable for urban energy management. For example, accurate temperature predictions can help optimize energy consumption in HVAC (heating, ventilation, and air conditioning) systems, contributing to energy savings and reduced carbon emissions.
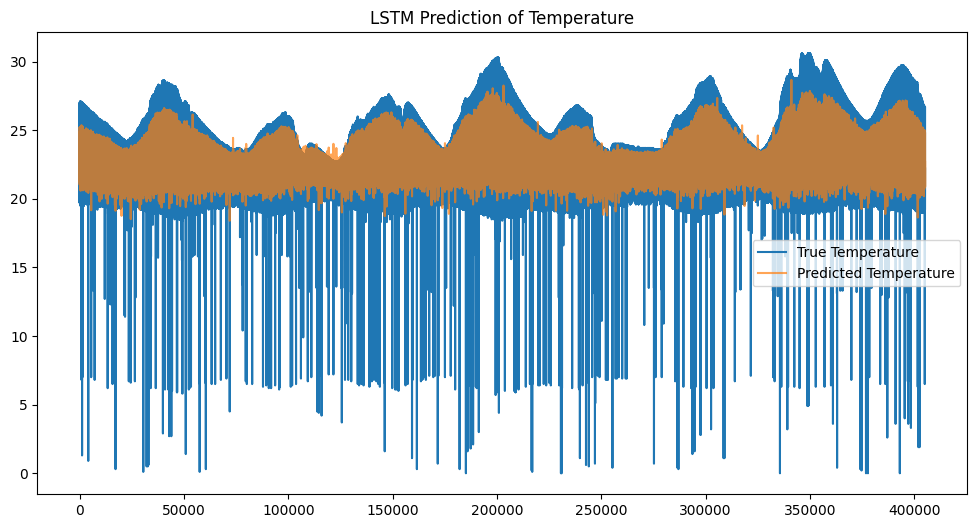
Figure 7 LSTM Prediction
G. Fourier Transform Analysis
The Fourier Transform analysis (Figure 8) reveals dominant frequencies in the temperature data, corresponding to daily and seasonal cycles. The sharp peak at low frequencies confirms the presence of regular diurnal patterns, while higher frequencies indicate noise or transient anomalies.
This analysis supports the seasonal decomposition findings and validates the use of models like LSTM for capturing cyclic trends. It also emphasizes the need for preprocessing techniques to remove noise for better model performance.
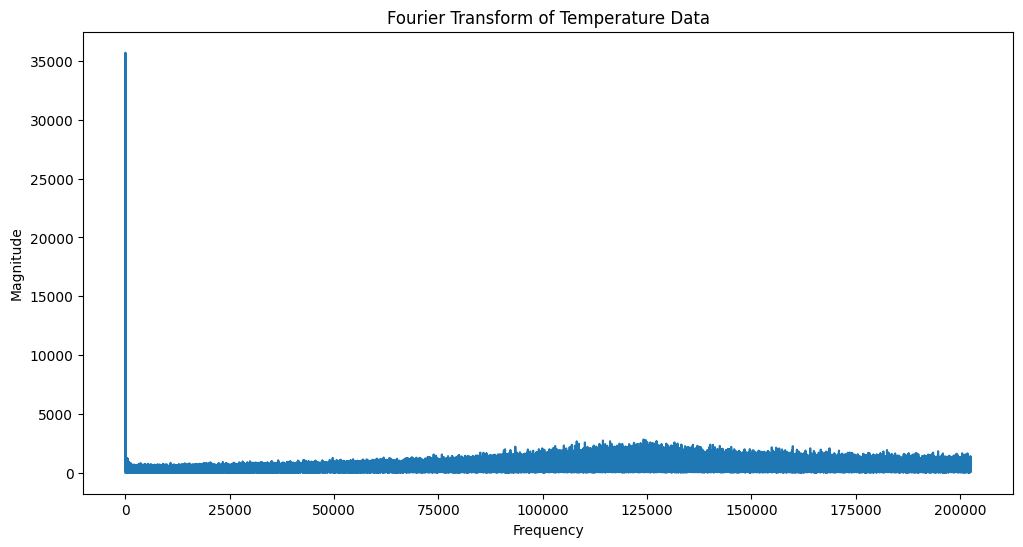
Figure 8 Fourier Transform
H. Implications of Findings
The analyses presented in this study demonstrate the transformative potential of IoT telemetry data in addressing urban environmental challenges. Key contributions include:
- Real-Time Monitoring and Anomaly Detection: The combination of Isolation Forest and DBSCAN provides a comprehensive framework for detecting irregular environmental events, enabling swift responses.
- Predictive Analytics for Energy Optimization: Time-series forecasting with LSTM highlights opportunities for pre-emptive energy management, reducing resource waste and costs.
- Feature Prioritization for Policy Design: SHAP analysis guides decision-makers on which variables to target, enhancing the impact of urban environmental policies.
Conclusion
This study illustrates the transformative role of IoT telemetry data and advanced analytics in addressing urban energy and environmental challenges. By applying machine learning techniques such as Isolation Forest, DBSCAN, and LSTM, the research effectively identifies anomalies, predicts temperature trends, and evaluates feature importance for environmental monitoring and energy optimization. The use of SHAP analysis and Fourier Transform further enhances interpretability, providing actionable insights for urban planning and resource management.
References
[1] Bibri, S. E. (2018). The IoT for smart sustainable cities of the future: An analytical framework for sensor-based big data applications for environmental sustainability.Sustainable Cities and Society. https://doi.org/10.1016/J.SCS.2017.12.034. [2] Ngai, E. C.-H., Dressler, F., Leung, V. C. M., & Li, M. (2017). Guest Editorial Special Section on Internet-of-Things for Smart Cities and Urban Informatics.IEEE Transactions on Industrial Informatics. https://doi.org/10.1109/TII.2017.2675379. [3] Bibri, S. E. (2020).The IoT and Big Data Analytics for Smart Sustainable Cities: Enabling Technologies and Practical Applications. https://doi.org/10.1007/978-3-030-41746-8_8. [4] Rahman, S. (2017, December 1). Energy efficiency and the role of IoT in a smart city connected community.Computer and Information Technology. https://doi.org/10.1109/ICCITECHN.2017.8281862. [5] Laha, S. R., Pattanayak, B. K., & Pattnaik, S. (2022). Advancement of Environmental Monitoring System Using IoT and Sensor: A Comprehensive Analysis.AIMS Environmental Science. https://doi.org/10.3934/environsci.2022044. [6] Environmental Sensor Telemetry Data. (2020, July 20). Kaggle. https://www.kaggle.com/datasets/garystafford/environmental-sensor-data-132k. [7] (2024). Smart Solutions for Sustainable Living: Internet of Things (IoT) Applications in Environmental Monitoring. doi: 10.62919/iuer2691. [8] K, Sreenivasulu., Santosh, Kumar, Yadav., G, Pushpalatha., Rao, Sethumadhavan., Anup, Ingle., R., Vijaya. (2023). Investigating environmental sustainability applications using advanced monitoring systems. ˜Theœ Scientific Temper, 14(04):1079-1084. doi: 10.58414/scientifictemper.2023.14.4.04. [9] Richa, Verma., Harsh, Taneja., Kiran, Deep, Singh., Prabh, Deep, Singh. (2024). Enhancing Data Analytics in Environmental Sensing Through Cloud IoT Integration. Journal of climate change, 10(2):41-45. doi: 10.3233/jcc240013 [10] Umesh, Khadka., Sarowar, Hossain., Nahid, Akhtar, Khan. (2024). Cyber-Physical Systems and IoT: Transforming Smart Cities for Sustainable Development. doi: 10.62127/aijmr.2024.v02i05.1106. [11] Dharmesh, Dhabliya., Soorya, Gopalakrishnan., Aditya, Mudigonda., Turdieva, Gulaida, Omirbayevna., Rajalakshmi, Krishnamurthi., Kushagra, Kulshreshtha., Ammar, Hameed, Shnain., Yerraganti, KrishnaBhargavi. (2023). Utilizing Big Data and environmentally-focused innovations to create smart, sustainable cities by integrating energy management, energy-efficient buildings, pollution mitigation, and urban circulation. doi: 10.1109/icteasd57136.2023.10585061. [12] Nandhini., Kanagaraj., P., Junead, J. (2023). Green Energy Management and Environmental Monitoring for Smart Cities. 864-869. doi: 10.1109/icscna58489.2023.10370218. [13] Hemanth, Kumar, S., Prabha, Kiran., S., Mahalakshmi., Dinesh, Nilkant., K., N., Iyer. (2024). Technology\'s Role in Sustainable Urban Development in Smart Cities. Advances in human resources management and organizational development book series, 169-208. doi: 10.4018/979-8-3693-3238-2.ch008. [14] Han, J., Kamber, M., & Pei, J. (2012). Data Mining: Concepts and. Techniques, Waltham: Morgan Kaufmann Publishers [15] Little, R. J., & Rubin, D. B. (2019). Statistical analysis with missing data (Vol. 793). John Wiley & Sons. [16] Jolliffe, I. T., Cadima, J., & Cadima, J. (2016). Principal component analysis: a review and recent developments. Philosophical Transactions of the Royal Society A, 374(2065), 20150202. https://doi.org/10.1098/RSTA.2015.0202. [17] Liu, F. T., Ting, K. M., & Zhou, Z. H. (2008, December). Isolation forest. In 2008 eighth ieee international conference on data mining (pp. 413-422). IEEE. [18] Ester, M., Kriegel, H. P., Sander, J., & Xu, X. (1996, August). A density-based algorithm for discovering clusters in large spatial databases with noise. In kdd (Vol. 96, No. 34, pp. 226-231). [19] Hochreiter, S., & Schmidhuber, J. (1997). Long short-term memory neural computation 9 (8): 1735–1780. Search in. [20] Lundberg, S. (2017). A unified approach to interpreting model predictions. arXiv preprint arXiv:1705.07874. [21] Oppenheim, A. V. (1999). Discrete-time signal processing. Pearson Education India.
Copyright
Copyright © 2025 Ahmed.N.A.A. Hassan, Ibrahim K.Q. Farea . This is an open access article distributed under the Creative Commons Attribution License, which permits unrestricted use, distribution, and reproduction in any medium, provided the original work is properly cited.

Download Paper
Paper Id : IJRASET66173
Publish Date : 2024-12-29
ISSN : 2321-9653
Publisher Name : IJRASET
DOI Link : Click Here
 Submit Paper Online