Ijraset Journal For Research in Applied Science and Engineering Technology
- Home / Ijraset
- On This Page
- Abstract
- Introduction
- Conclusion
- Copyright
Unravelling Stock Market Patterns: Analysis and Predictive Modelling Using Time Series and Deep Learning
Authors: Snigdha Iyengar
DOI Link: https://doi.org/10.22214/ijraset.2024.61757
Certificate: View Certificate
Abstract
[1] S. Sun, S. Li, L. Li, S. Shi, J. Wang, J. Hu, C. Hu, “Slope stability analysis and protection measures in bridge and tunnel engineering: a practical case study from Southwestern China,” Springer, vol. 87(39),pp. 1-17, August 2018.11:54, 2/2/2024] Abhijeet Ade: K. H. Yanga, J. N. Thuo, V. D. A. Huynh, T. S. Nguyen, F. H. M. [2] Portelinha, “Numerical evaluation of reinforced slopes with various backfill reinforcement-drainage systems subject to rainfall infiltration,” Elsevier, vol. 20(6), pp. 457-471, 2017 [3] S. Naidu, K. S. Sajinkumar ,T. Oommen, V. J. Anuja, R. A. Samuel, C. Muraleedharan, “Early warning system for shallow landslides using rainfall threshold and slope stability analysis,” Elsevier, vol. 10, pp.1- 12, 2017. [4] H. Moayedi, B. B. K. Huat, T. A. M. Ali, A. Asadi, F. Moayedi, M. Mokhberi, “Preventing landslides in times of rainfall: case study and FEM analyses,” Disaster Prevention and Management: An International Journal, vol. 20 (2) , pp.115 – 124, 2017. [5] S. Pramusandi, I. A. Rifa, K. B. Suryolelonob, “Determination of unsaturated soil properties and slope deformation analysis due to the effect of varies rainfall,” Procedia Engineering, vol. 125, pp. 376 –382,2015 [6] M. Heibaum, “Geosynthetics for waterways and flood protection structures - Controlling the interaction of water and soil,” Geotextiles and Geomembranes, vol. 42(4), pp.374-393, 2014. [7] E. Garcia, T. Uchimura, “Study of failure mechanism in embankments Induced by rainfall infiltration by monitoring Pore water pressures and water contents,” Elsevier, vol. 74(152), pp. 125-135, 2007 [8] R. P. Orense, P. S. Shimoma, K. Maeda, I. Towhata, “Instrumented Model Slope Failure due to Water Seepage,” Journal of Natural Disaster Science, vol. 26(1), pp. 15-26, 2004. [9] S. H. Poh, B. B. Broms,lope Stabilization Using Old Rubber Tires and Geotextiles,” Journal of Performance of Constructed Facilities, vol. [10] .Brand, E. W., J. Premchitt and H. B. Phillipson, 1984. Relationship between rainfall and landslides in Hong Kong. Proceedings, 4th International Symposium on Landslides, Toronto, 377-384. [11] Chiba Prefecture Civil and River Division, 1972. Report of Disaster in Chiba due to Autumn Rain Front of September 6-7, 1971 and Typhoon No. 25 (in Japanese). [12] Farooq, K., R. Orense and I. Towhata, 2003. Response of unsaturated andy soils under constant shear stress drained condition, Soils and Foundations, 44 (2), 1-13. [13] Fukuoka, M., 1980. Landslides associated with rainfall, Geotechnical Engineering, 11, 1- Fukuzono, T., 1990. Recent studies on time prediction of slope failure Landslide News, 4, 9-12.
Introduction
I. INTRODUCTION
Time series forecasting is an important problem that has been widely studied, and several linear and nonlinear models have been proposed to improve the prediction accuracy. The autoregressive integrated moving average (ARIMA) model is one of the most popular and important models.[3] Considering not only univariate time series data but multivariate data as well in stock market volatility, A basic vector model is the VARMA model.
Although VARMA models are flexible in their representation of several types of time series models, such as vector autoregressive (VAR) and vector moving average (VMA) models, their major limitation is that linear correlation is assumed in the structure and nonlinear characteristics cannot be captured. However, real-world problems are always complex, and hence, building a VARMA model for a multivariate time series requires some attention[4].
Apart from the statistical time series models for univariate and multivariate series, the combination of statistics and learning models have polished several machine learning algorithms, such as a critical neural networks, gradient boosted regression trees, support vector machines and, random forecast. These algorithms can reveal complex patterns characterized by non-linearity as well as some relations that are difficult to detect with linear algorithms.. A large number of studies is currently active on the subject of machine learning methods used in finance, some studies used tree-based models to predict portfolio returns .others used deep learning in the production of future values of financial assets.[2]
The dynamic, complex, evolutionary and chaotic nature of the market clearly demonstrates the limitations of classical statistical methods for forecasting time series of stock prices, and requires more powerful methods to complete the task. In particular, when dealing with market trends, we need methods that can work with a large amount of "noisy" and non-linear data. Given the disadvantages imposed by statistical methods, machine learning methods such as artificial neural networks (ANNs) in combination with heuristic algorithms will be used as an alternative.[7].
Various machine learning techniques have been proposed over the decades for predicting stock market prices. An Artificial Neural Network (ANN) is introduced, incorporating Long Short-Term Memory (LSTM) to enhance trend forecasting in stock market data. LSTM contributes to maintaining both short-term and long-term memory in conjunction with the temporal aspects of the data. The objective is to elevate the effectiveness of trend forecasting in stock market data, facilitating more informed trading decisions.[1][2].
II. ARIMA MODEL
An ARIMA model is a vibrant univariate forecasting method to project the future values of a time series. the Quantitative forecasting models make use of the data available to make predictions into future.
The model basically sums up the interesting patterns in the data and presents a statistical association between the past and current values of the variable. Likewise, we can say, that quantitative forecasting models are used to extrapolate the past and present behavior into future. Some examples of the Quantitative models include the regression analysis models, smoothing models and the time series models.[4]
Autoregressive Integrated Moving Average, is a commonly employed time series forecasting model within the realms of statistics and econometrics. This model is crafted to discern various aspects of time series data, such as trends and seasonality.
- Autoregressive (AR) Component: This part entails modeling the connection between a current observation and past observations, known as lags.
The "p" parameter signifies the number of lag observations incorporated into the model.
2. Integrated (I) Component: The integrated component involves differencing the time series data to achieve stationarity. Stationary data, characterized by a consistent mean and variance, facilitates easier modelling.
The "d" parameter denotes the order of differencing necessary for attaining stationarity.
3. Moving Average (MA) Component: The moving average component models the association between a current observation and a residual error from a moving average model applied to lagged observations.The "q" parameter represents the order of the moving average.
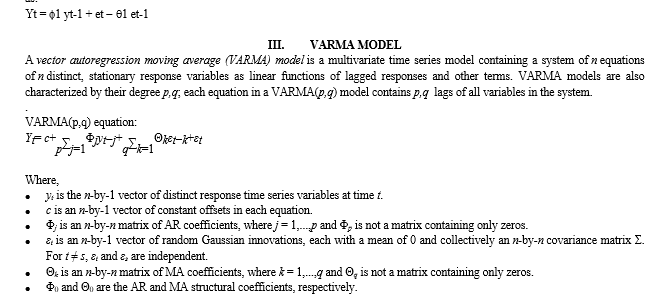
By combining these components, ARIMA is represented as ARIMA(p, d, q). The objective is to identify the optimal values for these parameters, creating an effective model for forecasting future values within the time series. ARIMA equation can be written as:
A. Deep learning networks (neural network)
LSTM and RNN:
Long Short-Term Memory (LSTM) is a type of Recurrent Neural Network (RNN) known for capturing past data to make future predictions. In an Artificial Neural Network (ANN) with one hidden layer, the input layer nodes connect to the hidden layer through synapses with weights as decision makers for signals. Learning involves adjusting these weights, and after completion, the ANN will have optimal weights. The hidden layer applies a sigmoid or tanh activation function on the weighted sum from the input layer. The output layer, obtained after applying the SoftMax function, minimizes error between training and test data.
For predicting future values based on past sequences, RNNs use earlier stages to learn and forecast trends. However, RNNs struggle with long-term memory. LSTM, with its "memory line" and gates, addresses this limitation, allowing the retention of information from earlier sequences for more accurate forecasting. [9]
The ability of memorizing sequence of data makes the LSTM a special kind of RNNs. Every LSTM node most be consisting of a set of cells responsible of storing passed data streams, the upper line in each cell links the models as transport line handing over data from the past to the present ones, the independency of cells helps the model dispose filter of add values of a cell to another. In the end the sigmoidal neural network layer composing the gates drive the cell to an optimal value by disposing or letting data pass through. Each sigmoid layer has a binary value (0 or 1) with 0 “let nothing pass through”; and 1 “let everything pass through.” The goal here is to control the state of each cell, the gates are controlled as follow: - Forget Gate outputs a number between 0 and 1, where 1 illustration “completely keep this”; whereas, 0 indicates “completely ignore this.” - Memory Gate chooses which new data will be stored in the cell. First, a sigmoid layer “input door layer” chooses which values will be changed. Next, a tanh layer makes a vector of new candidate values that could be added to the state. - Output Gate decides what will be the output of each cell. The output value will be based on the cell state along with the filtered and freshest added data. [9].
IV. METHODOLOGY
A. Data Collection
The data that is focused here is of Indian stock Infosys ltd.
the dataset is divided into 2 parts, one for univariate analysis and other one for multivariate analysis.
Infosys ltd stock closing price is taken under consideration from 1/05/2023 to 17/11/2023.the data is concentrated on hourly basis for 5 months having total of 250+ rows.
For multivariate analysis purpose, the same stock Infosys Ltd is taken with increased time period of 1/01/2008 to 30/11/2008 for daily basis consisting of 4000 rows.
B. Feature Selection
For Multivariate Analysis purpose for time series,The features selected for prediction and fitting are open values, close values, high values, low values for Infosys Stock and the stocks affecting the Indian stocks that are Sensex, Nifty50 are selected.
C. Procedure
For univariate time series data, Visualizing the time series data to identify trends, seasonality, and other patterns. Converting the data into stationarity and applying statistical tests before fitting.
Applying the Autoregressive Integrated Moving Average (ARIMA) model to the univariate time series (closing prices) with suitable parameters (p,q).
Assessing the performance of the ARIMA model using appropriate evaluation metrics (e.g., Mean Absolute Error, Mean Squared Error).
For multivariate time series data, Visualizing the time series data to identify trends, seasonality, and other patterns. Converting the data into stationarity and applying statistical tests before fitting.Fitting a Vector Autoregressive Moving Average (VARMA) model to capture the interdependencies among variables with suitable parameters(p,q).
D. Comparison with LSTM
Implementing the Long Short-Term Memory (LSTM) model for both univariate and multivariate time series prediction.
Utilizing the historical closing prices, opening prices, low prices, high prices, Sensex close values, and Nifty closing values.
V. ANALYSIS
A. Univariate Time Series (ARIMA)
A time series needs to be lacking trend and seasonality, in order to be stationary. Such type of time series are characterized by having a constant variance and constant mean over a given period of time. The ``trend and seasonality'' component may affect a time series at different instants.
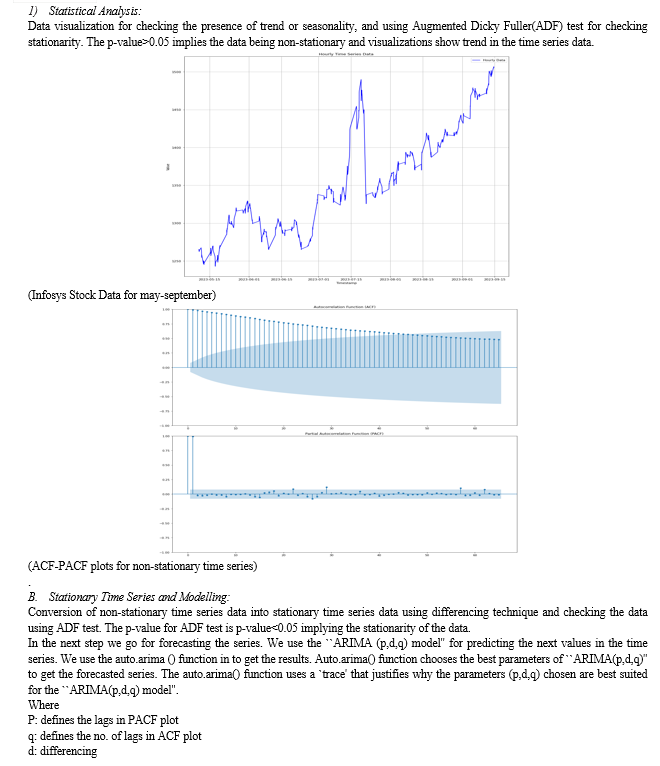
Visualization of univariate time series data that is Infosys LTD closing price stock for the time period of May-September 2023(hourly).



VI. RESULTS
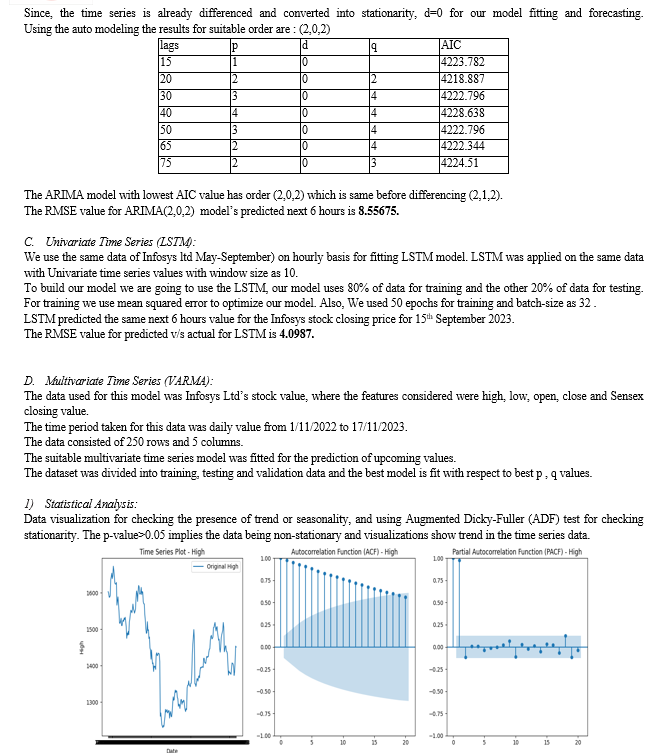
For univariate time series analysis, the ARIMA model, configured as ARIMA(2,0,2), showcased its ability to discern trends and seasonality, yielding a respectable RMSE of 8.55675. However, the LSTM model outperformed ARIMA with a notably lower RMSE of 4.0987, underscoring its proficiency in capturing intricate patterns in stock prices.
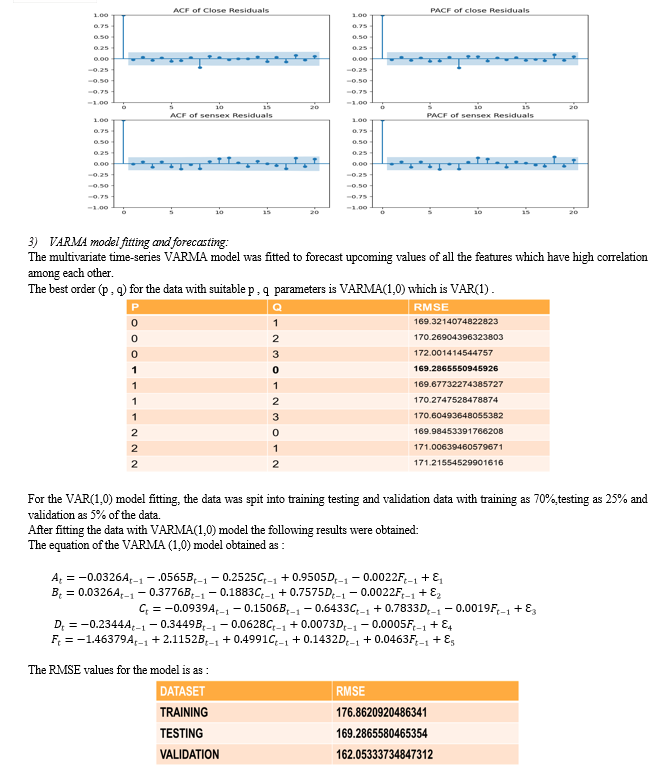
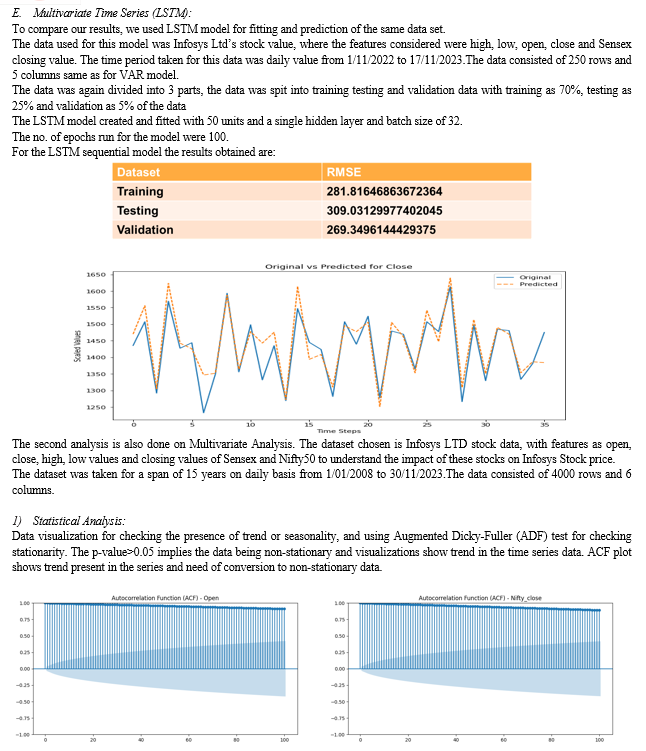
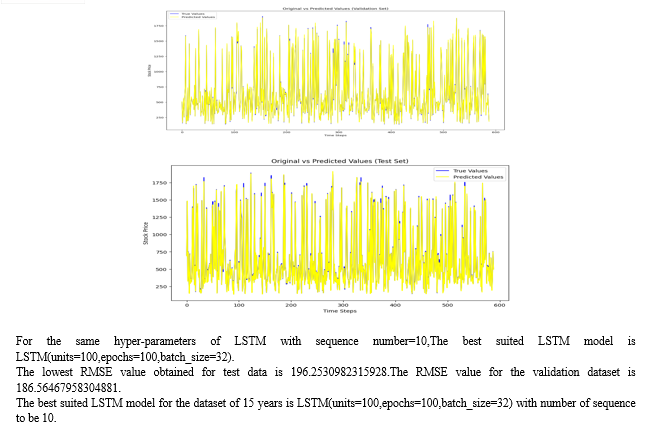
In the multivariate realm, VARMA models, particularly VARMA(1,0), demonstrated their effectiveness in capturing dependencies among features, resulting in an RMSE of 162 for the first dataset. In comparison, LSTM, with hyperparameter tuning, exhibited a competitive RMSE of 269. For the second dataset, VARMA achieved an RMSE of 167, while LSTM, with meticulous tuning, recorded an RMSE of 182.
Conclusion
In Conclusion, this research undertook a comprehensive exploration of stock market forecasting using univariate and multivariate time series models, with a specific focus on ARIMA, VARMA, and LSTM methodologies. The investigation utilized datasets extracted from the Indian stock market, primarily centered around Infosys Ltd. The comparative analysis highlighted the strengths and weaknesses of each model. While VARMA models provided valuable insights into the interplay among various features, LSTM\'s advanced deep learning architecture demonstrated a superior ability to handle non-linear relationships and intricate patterns. The choice between these models would depend on the specific requirements of the forecasting task and the nature of the underlying data. This research sheds light on the dynamic interplay between traditional statistical models and advanced machine learning techniques in the context of stock market forecasting. Investors and analysts can leverage these findings to make informed decisions, navigating the complexities of the financial landscape. As the field continues to evolve, the synergy between statistical and machine learning models will likely play a crucial role in shaping the future of stock market predictions, offering improved insights for optimizing investment strategies.
Copyright
Copyright © 2024 Snigdha Iyengar. This is an open access article distributed under the Creative Commons Attribution License, which permits unrestricted use, distribution, and reproduction in any medium, provided the original work is properly cited.

Download Paper
Paper Id : IJRASET61757
Publish Date : 2024-05-07
ISSN : 2321-9653
Publisher Name : IJRASET
DOI Link : Click Here
 Submit Paper Online

