Ijraset Journal For Research in Applied Science and Engineering Technology
- Home / Ijraset
- On This Page
- Abstract
- Introduction
- Conclusion
- References
- Copyright
Urban Green Areas per Resident: Review Study
Authors: Ismat M. Elhassan
DOI Link: https://doi.org/10.22214/ijraset.2024.63573
Certificate: View Certificate
Abstract
One of the essential elements of landscape planning is the design of urban green areas which is important for community welfare. Data about green area in large cities can be collected from aerial survey or satellite imageries. Analysis can be applied using GIS to determine the relation between urban green area (UGA) per resident in the city when statistics of number of inhabitants in the city are known. The computed UGA per resident can then be compared with respect to standard or recommended values given by: World Health Organization (WHO) or by the United Nations (UN) or any other organization. Studying the distances that people need to walk to the nearest green area should also satisfy a certain limit. This paper is an attempt to outline some published research about finding out the UGA per capita in various world cities. Results of such studies can be used as directing issues for city planners to determine how much green area in a city is required and which directions they have to be.
Introduction
I. INTRODUCTION
Urban green area (UGA) is supposed to be an important factor to raise human life quality and to create sustainable cities. This has led to the race to create the greenest city. UGA per resident is a quantitative indicator in evaluating urban green infrastructure (Badiu, et al, 2016). One of the major factors considered to classify cities as far as being a good city for high life quality is the UGA per capita and the distance the resident needs to reach the nearest an UGS. The importance of studying UGA per resident in cities arises from the many benefits for sustainable community development (Khalil, 2014).
In this paper, some important benefits and importance of green area per capita in major cities would be outlined. A summary of studies carried out in finding UGA per capita in some world cities would also be given..
A. Benefits Of Green Areas In Cities
The following are some of these benefits, as stated by many authors, for example: Swanwick, et al, 2003; Jason A. Bennie, 2016; Kakoty, S., 2021.
- Provision of clean and mental health that would reduce stress level and depression, allowing life in a healthy environment.
- Reduction of urban heat and hence nice weather to be enjoyed and encourage practicing physical activities.
- Provision of sufficient space for neighbor-hood residents to interact with each other and meet new people.
- Encouraging kids and youngsters to practice individual and social activities in fresh air.
- Protection of natural ecosystems since trees and shrubs assist in removing smoke and other air pollutants.
B. Standard Requirements Of Green Area Per Capita
Due to the importance of required green area per capita to achieve at least some of the mentioned advantages minimum required green area per capita in populated citied were suggested by various organizations. Table 1 shows some of such standards:
Table 1: Suggested UGA per capita
|
Organization |
UGA (m2) per capita |
Reference |
|
WHO |
9 |
Khalil, 2014 |
|
European Union (EU) |
26 |
Khalil, 2014 |
|
German Standard |
7 |
Demuth and Karske, 2011 and Khalil, 2014) |
|
KSA Ministry of Municipal and Rural Affairs (MOMRA) |
3.9 |
Addas, 2020 |
C. Application of Geomatics in Studying UGA
Preparation of information of green space is important to achieve better management. This can be done through satellite imageries information and using GIS analysis operations. The ability of satellite images, GIS and land mapping in UGA planning was studied by some authors such as Akbari, 2023; Pouya and Majid, 2022; Sun, et al, 2022 and others.
Akbari, 2023 used Quick Bird Satellite Data (QBSD) to produce green space information for parts of Qochan city. His study proved the possibility of producing maps and determining the best place for the physical development of the city. It has been concluded that the use of this technology can overcome many problems and achieve a logical development with the slogan of sustainable development. Considering that preparing UGA map using QBSD and GIS technology in urban scales is less expensive than ground mapping, and it is also possible to update the complications of digital maps quickly, it is suggested to use these images to enrich and update other complications on 1:2000 urban maps. It is also suggested to use GIS technology and form a Geographic Data Base of Green Space for better planning. Akbari, 2023 concluded that satellite data have the potential to perform time series analysis and determine the trend of changes in UGA, and by using existing satellite data, it is possible to evaluate the process of evaluating changes in UGA during the past years.
The aim of the study carried out by Pouya and Majid in 2022 was to use RS and GIS to evaluate UGA per capita in Battalgazi, Malatya. They recommended the use of this technology in landscape design and in making sure of equal UGA distribution.
Sun, et al, 2022 used RS and GIS to determine the landscape pattern index, landscape heterogeneity, and quantitative analysis of the landscape pattern of parks and green spaces in Wuhan City. Using remote sensing technology, they investigated many environmental problems, crisis management in the event of unexpected events, the way the city of Wuhan has expanded over the years, the direction of the physical expansion of the city, the destruction of forests and gardens, from above with a wide view and implement correct planning, also, remote sensing images combined with geographic information system can create communication routes at the city and country level and choose the best routes.
The attempt of studying changes in UGA in the city of Khorramabad, Iran in different periods of time, using aerial photos and QBSD was carried out successfully by Beiranvand, et, al, 2013
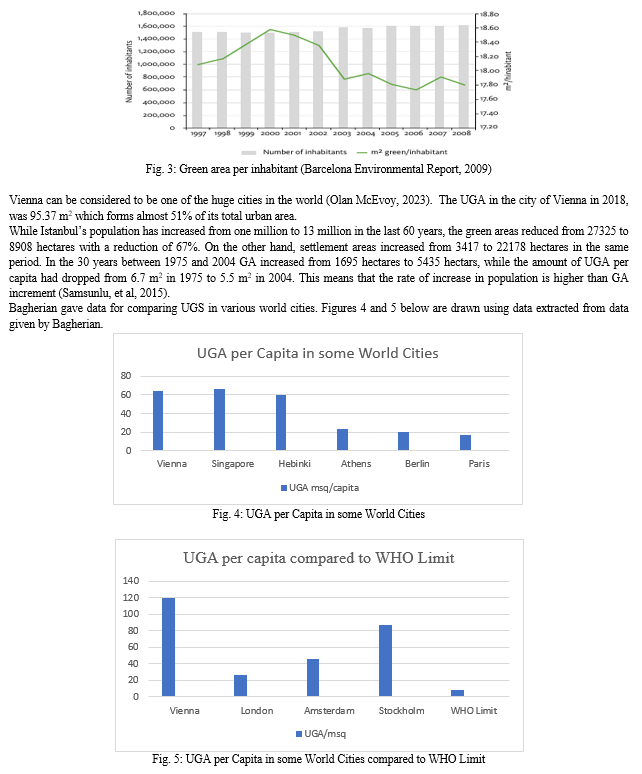
A typical study of using Landsat TM/ETM/8 for spatiotemporal patterns and dynamics of UGAs for 70 major cities in China during the period 2000 to 2018 was carried out by Kuang and Dou, 2020. The results showed that the total area of UGS in these cities grew from 2780.66 km2 in 2000 to 6764.75 km2 in 2018. In consequence, the UGS area per capita rose from 15.01 m2 in 2000 to 18.09 m2 in 2018. They determined and ranked the top ten cities with the highest UGA increment during the study period in China. Table 2 shows the result of this study. It can be noted that city with the highest increase in area of UGS was Beijing where the increment of UGS was 3.25 times that of the other cities.
Table 2: UGA (km2) in Top Cities in China, from Kuang and Dou, 2020
|
City |
UGA (km2) in 2000 |
Increment of UGA (km2) in 2000 to 2018 |
|
Beijing |
304.67 |
516.89 |
|
Nanjing |
88.95 |
159.20 |
|
Hanjin |
88.64 |
148.22 |
|
Shenzhen |
156.83 |
145.04 |
|
Changchun |
64.07 |
126.11 |
|
Guangzhou |
63.12 |
125.66 |
|
Jinan |
38.18 |
124.04 |
|
Shanghai |
155.21 |
119.51 |
|
Hefei |
31.79 |
117.28 |
|
Suzhou |
75.85 |
113.50 |
In the article by Buket, et al, 2022, the city of Nicosia, Cyprus UGA distribution was compared with the European Green standard. They used Landsat 8 satellite images. The results showed that UGA have a nonhomogeneous distribution throughout the city, and the amount of UGA per capita is approximately 200 m².
Integration of satellite images and GIS techniques was found to provide a time and cost-effective methodology for studying UGA, Senanayake, 2013. He applied NDVI method on THEOS Satellite imagery to extract UGA for Colombo city, Sri Lanka.
II. RESULTS OF STUDIES on UGS in SOME WORLD CITIES
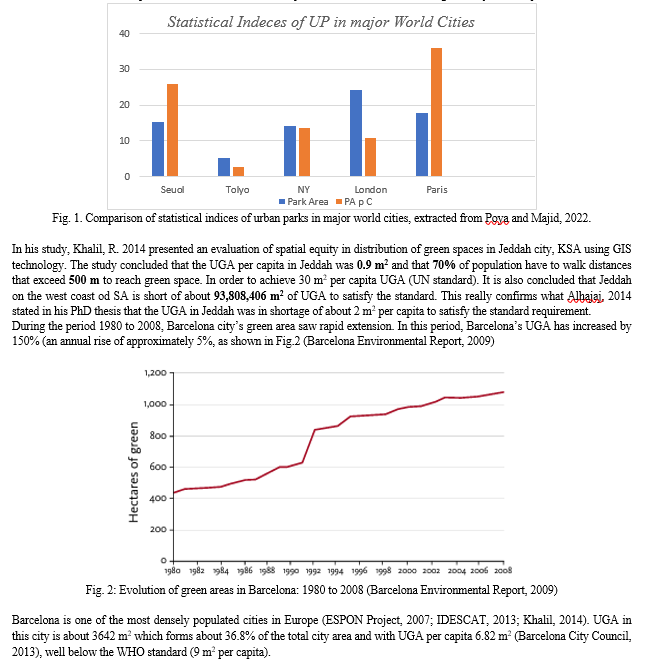
Green parks compose a part of UGA. In their study Pouya and Majid, 2022 determined total green parks area in Seoul as 158km2. They comment that this cumulative figure is superior to such area in other world cities, Fig. 1. They have also noticed that the major part of green park areas in Seoul fall far from city urban center which makes it difficult to reach.
Statistical indices of urban parks (UP) in Seoul and other major world cities are shown in Fig. 1, Pouya and Majid, 2022.


III. RIYADH GETTING GREEN
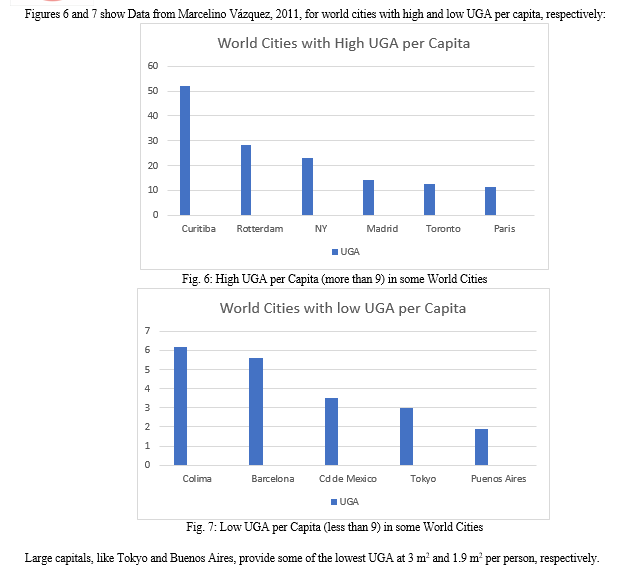
One of the latest mega projects in Kingdom of Saudi Arabia (KSA) is “Going Green”, Olivia, 2023. It is suggested that Riyadh, capital of KSA would accommodate more than 7.5 million trees in another ambitious mega-project in the Kingdom. It has been recommended that Riyadh will enclose 180 000 square meters of green parks before 2030. The aim is to fulfil the 2030 Saudi vision and make Riyadh one of the top 100 cities suitable for most comfortable life in the world. This will definitely for a concrete base for Riyadh to home EXPO 2030
In his thesis, Alhajaj, 2014 has examined ways of increasing POS in Jeddah in both a pragmatic and culturally appropriate manner. He developed three different urban design scenarios to increase walking and other different physical activities in Jeddah.
It is expected that by 2050 almost 6.3 billion people, world habitats, will live in urban areas. Enough green area, with park walking distance not to be larger than 300m should be available for healthy life.
Conclusion
The main reason behind decrease of UGA per capita is the high increase of population growth in many world cities. This leads to the poor environmental quality of life in world cities and should be encountered by increasing green areas through urban planning to fulfil suitable distances to green spaces. Unplanned constructions and settlements in world cities may contribute to great decrease in UGA per capita. Suitable distribution of green spaces should be taken into consideration during the process of urban planning. From the published UGA per capita in various world cities and from standards of suitable UGA per capita given by different specialized organizations it will be recommended that 10 m2 per capita should be the minimum when planning new cities or replanning of existing cities to fulfil comfortable life. Aerial photos and satellite imageries can be a good data provision for urban planning and distribution of green spaces in cities.
References
[1] Akbari, D., 2023. “Application of GIS and Remote Sensing in Urban Green Space Planning, Case Study: Qochan City”. 1st International and 2nd National Conference on Modeling and New Technologies in Water Management. DOI: 10.22111/JHE.2023.46788.1099. [2] Almayouf, A., 2013. “Preserving the Green in Hot-arid Desert Environments: The Case of Riyadh, Saudi Arabia”. J. King Saud Univ., Vol. 25, Arch. & Planning (1), pp. 39-49, Riyadh (2013/1434H.). [3] Alhajaj, N., 2014. “New Forms of Public Open Space in City of Jeddah”. PhD Thesis, University of Western Australia. [4] Badiu, D. L, Cristian Ioja, Maria Patroescu and Jürgen Breuste, 2016. “Is urban green space per capita a valuable target to achieve cities’ sustainability goals? Romania as a case study”. Ecological Indicators 70(4):53-66 DOI:10.1016/j.ecolind.2016.05.044. [5] Bagherian, B. “HOW MUCH GREEN SPACE DOES YOUR CITY HAVE? HOW DOES YOUR CITY COMPARE TO VIENNA?”. https://www.baharash.com/liveable-cities-how-much-green-space-does-your-city-have/ [6] Barcelona Environmental Report 2009, A City Committed to the Environment. Adjntment de Barcelona. [7] Beiranvand, A., Amir Eslam Bonyad and Javad Sousani, 2013. “Evaluation of Changes in Per Capita Green Space through Remote Sensing Data”. International journal of Advanced Biological and Biomedical Research ISSN: 2322 - 4827, Volume 1, Issue 4, 2013: 321-330. [8] Buket EY?LETEN, Çi?dem ESENDA?LI and Serdar SEL?M, 2022. “Assessment of Urban Green Space Distribution within the Scope of European Green Deal Using NDVI Indices; Case of Nicosia/Cyprus”. J. of Architectural Sciences and Applications, Volume: 7 Issue: 2, 615 - 623, 30.12.2022 https://doi.org/10.30785/mbud.1152364. [9] Demuth, B. and Garske, T., 2011. “How to Maintain a Healthy, High Quality Urban Life by Adapting to Climate Change and Mitigating Its Impacts in the Planning Stage.” The Young Cities research project management, Technische Universität Berlin. [10] Kakoty, S. 2021. “Top 7 Benefits of Parks and Recreation”. https://www.getomnify.com/blog/top-7-benefits-of-parks-and-recreation [11] Khalil, R. 2014. “Quantitative evaluation of distribution and accessibility of urban green spaces (Case study: City of Jeddah).” INTERNATIONAL JOURNAL OF GEOMATICS AND GEOSCIENCES Volume 4, No 3, 2014 [12] Kuang, W. and Y. Dou, 2020. “Investigating the Patterns and Dynamics of Urban Green Space in China’s 70 Major Cities Using Satellite Remote Sensing”. Remote Sens. 2020, 12 (12), 1929; https://doi.org/10.3390/rs12121929. [13] Marcelino Vázquez, 2011. “How much green space does your city have?” Sustainable Cities International blog. https://plusnetwork.wordpress.com/2011/07/13/how-many-metres-of-green-space-does-your-city-have/ [14] Muhammad Ibrahim & Niaz Ahmad (2023). “Quantitative evaluation and challenges confronting dedicated green spaces in cities: a case study of Peshawar, Pakistan.” Geology, Ecology, and Landscapes. DOI: 10.1080/24749508.2023.2265123 [15] Olivia, B. 2023. “Going Green: The Kingdom’s latest mega-project is not what you expect”. https://www.listmag.com/see-do/3946-going-green-kingdoms-latest-mega-project-not-what-you-might-expect [16] Olan McEvoy, Feb 28, 2023. “Green space per inhabitant in the city of Vienna in Austria in 2018,” Statista. https://www.statista.com/accounts/pa. [17] Pouya, S. and A Majid, 2022. “Evaluation of Urban Green Space per Capita with new RS and GIS techniques and the Importance of UGS during the COVID-19 Pandemic”. Environmental Monitoring and Assessment, 2022 Aug 3;194(9):633. doi: 10.1007/s10661-022-10298-z. [18] Samsunlu, A., Bilsen Beler-Baykal, Y?ld?z Aksoy and Ayse D. Allar Emek, 2015. “Population agglomerations and its implication in developing countries: A survey of green areas in the Turkish Megacity Istanbul”. International Journal of Electronics Mechanical and Mechatronics Engineering 4(1):713-724 [19] Senanayake, IP; Welivitiya, WDDP; Nadeeka, PM, 2013. “Assessment of green space requirement and site analysis in Colombo, Sri Lanka: a RS and GIS approach”. URI: http://dl.lib.mrt.ac.lk/handle/123/10298. [20] Sun, Y., Yang, Y., Luo, M., Zhang, X., Cheng, Q., and Wang, Y.: RESEARCH ON THE LANDSCAPE PATTERN OF URBAN PARKS AND GREEN SPACES – TAKING THE MAIN URBAN AREA OF WUHAN CITY AS AN EXAMPLE, Int. Arch. Of Photogrammetry, Remote Sens. Spatial Inf. Sci., XLIII-B4-2022, 559–565, https://doi.org/10.5194/isprs-archives-XLIII-B4-2022-559-2022, 2022 [21] Swanwick, C., N. Dunnett and H. Woolley, 2003. “Nature, Role and Value of Green Space in Towns and Cities: An Overview”. Perspectives on Urban Greenspace in Europe (2003), Vol. 29, No. 2, pp. 94-106
Copyright
Copyright © 2024 Ismat M. Elhassan. This is an open access article distributed under the Creative Commons Attribution License, which permits unrestricted use, distribution, and reproduction in any medium, provided the original work is properly cited.

Download Paper
Paper Id : IJRASET63573
Publish Date : 2024-07-07
ISSN : 2321-9653
Publisher Name : IJRASET
DOI Link : Click Here
 Submit Paper Online

