Ijraset Journal For Research in Applied Science and Engineering Technology
- Home / Ijraset
- On This Page
- Abstract
- Introduction
- Conclusion
- References
- Copyright
Utilizing Machine Learning or Predictive Modelling of Stress Levels during Sleep
Authors: Touseef Ahmad Lone, Yadwinder Singh
DOI Link: https://doi.org/10.22214/ijraset.2024.59452
Certificate: View Certificate
Abstract
This paper focuses on examining and predicting stress levels using a dataset containing various physiological parameters. The dataset undergoes thorough preparation and scrutiny to understand its composition and quality, laying the groundwork for subsequent analysis. Through data visualization, insights into the relationships between stress levels and physiological attributes are gained, providing a basis for further investigation. The main emphasis of this paper lies in developing and evaluating machine learning models for predicting stress levels. Various models, such as Logistic Regression, Random Forest, Decision Tree, Support Vector Machine (SVM), k-Nearest Neighbors (k-NN), and Gaussian Naive Bayes, are rigorously trained and tested. These models exhibit impressive performance, with some achieving exceptional accuracy on test data. The successful development of these models suggests practical applications in healthcare, well-being monitoring, and stress management. Nevertheless, the study acknowledges limitations, particularly regarding data quality and representation. The models\' effectiveness depends on the quality and diversity of the dataset. Future research and data collection efforts have the possibility of enhancing the precision and dependability of stress level predictions. Overall, this research lays a promising groundwork for utilizing machine learning in stress assessment and management, with potential benefits for individual health and well-being.
Introduction
I. Introduction
Sleep, an essential element of human existence, plays a pivotal role in preserving both physical and mental health. During sleep, our bodies undergo vital rejuvenating processes, and any disruptions to this natural rhythm can have profound effects. One significant ramification is the initiation and worsening of stress, a prevalent issue in contemporary society with serious health implications. Hence, it is crucial to comprehend and monitor stress levels during sleep.
This research is motivated by the realization that stress is a silent epidemic with extensive consequences. It serves as a significant factor in various health issues, such as cardiovascular diseases, mental disorders, and compromised immune functions. Stress often emerges during sleep, affecting its quality and duration, thereby perpetuating a cycle of stress-induced sleep disturbances. Early detection and management of these problems are essential to prevent long-term health complications. Acknowledging the intricate link between stress and sleep, this study aims to explore this relationship and contribute to strategies for identifying and addressing stress-related sleep issues promptly.

Furthermore, the recent global COVID-19 pandemic has emphasized the importance of stress management, as individuals worldwide grapple with heightened levels of stress and anxiety. As an increasing number of people actively seek ways to alleviate stress, the creation of a dependable tool for predicting stress during sleep could be immensely valuable.
This research aligns with broader goals aimed at advancing personalized healthcare and utilizing technology to improve overall well-being. It is deeply rooted in the intersection of psychology, medicine, and technology, demonstrating a multidisciplinary approach to addressing a widespread issue. By integrating insights from these diverse fields, the study aims to contribute to the creation of practical tools and techniques for predicting and managing stress during sleep, ultimately promoting better mental and physical health outcomes.
II. Objectives
- The primary objective is to accurately predict stress levels by utilizing a comprehensive dataset of physiological parameters, addressing the limitations of previous research.
- Utilize advanced data analysis techniques to ensure the quality and reliability of data, thus enhancing the robustness of stress prediction models.
- Develop and evaluate various machine learning models, including Logistic Regression, Random Forest, Decision Tree, Support Vector Machine (SVM), k-Nearest Neighbours (k-NN), and Gaussian Naive Bayes, for predicting stress levels effectively.
- Implement real-time stress monitoring and assessment capabilities to overcome the retrospective focus of previous research.
- Provide practical tools for stress management, enabling timely interventions to enhance individuals' health and well-being.
III. Literature review
Zhao et al.'s [1] Neural networks, Random Forests, Naive Bayes, and other types have been utilized to determine an individual's sentiment based on RF waves reflecting off the body. However, prior studies have not yet evaluated Layered Classifier, Radial Basis Function (RBF) Network, or Hybrid models combining Support vector models and advanced neural networks (ANN-SVM).
The Standard Stress Scale-SSS[2] and expert questionnaires have served as stress diagnosis tools developed by numerous researchers. However, they lack automated detection and often rely on human input, demanding time, effort, and mental health awareness from the user. This process could be streamlined by automatically identifying stress indicators without direct user input, leveraging advancements in ambient intelligence and the proliferation of intelligent environments. If necessary, the system could intervene and validate its assessments by requesting confirmation.
IV. methodology
The system commences the data collection phase by gathering a comprehensive range of sleep-related data, including metrics such as snoring rate, respiration rate, body temperature, limb movement, blood oxygen levels, eye movement, sleep duration, heart rate, and stress levels These data sources might be sensors, wearable technology, or human interaction. After gathering data, the system carefully preconditions the data, checking for missing values and employing appropriate handling techniques. Furthermore, the data undergoes cleaning to address outliers or inconsistencies that could affect subsequent analyses. Feature engineering is then utilized to select the most relevant attributes for stress prediction, with the significance of each feature further analysed through methods like feature importance analysis, employing machine learning models such as Random Forest to identify key predictors.
Subsequently, the system progresses to the training phase, where several machine learning simulations, such as Support Vector Machine (SVM), Random Forest, Decision Tree, and Logistic Regression k-Nearest Neighbors (k-NN), and Gaussian Naive Bayes, are trained on the pre-processed data. Each model undergoes evaluation, with Performance measures computed to assess their effectiveness include accuracy, precision, recall, and F1-score.
Moreover, the system incorporates features for user interaction, facilitating data input and system control. A feedback loop is established to gather user feedback continuously, enhancing the system's performance over time. Regular maintenance protocols are implemented to ensure the system remains current, with algorithms updated as needed. Ultimately, the system concludes its process, having provided valuable insights into sleep quality and stress levels, serving as a beneficial tool for users to effectively manage their well-being.
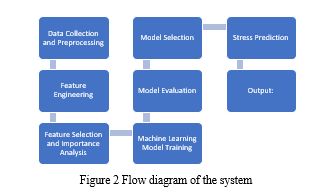
A. Data Collection and Preprocessing
The process of data collection encompassed gathering a range of sleep-related metrics from diverse sources. These metrics comprised snoring rate, heart rate, blood oxygen saturation, respiration rate, temperature of the person, movement of the legs, eye movement, length of sleep, and tension levels. Users supply this information, likely through wearable devices equipped with sensors capable of monitoring these parameters. This phase aimed to ensure the availability of a comprehensive dataset for constructing and training predictive models.
B. Data Preprocessing
Data preprocessing was a pivotal stage aimed at guaranteeing the quality and appropriateness of the data for machine learning endeavors. It involved several sub-steps: During the data collection and preprocessing phase of this project, the primary emphasis was on acquiring sleep-related data and ensuring its integrity and preparedness for analysis. This phase encompassed sourcing sleep-related metrics, such as heart rate, stress levels, oxygen level in the blood, movement of the legs, eye movement, breathing rate, whistling rate, and body temperature.
These metrics were obtained from users, potentially via wearable devices equipped with sensors capable of monitoring these parameters. The goal was to establish a comprehensive and varied dataset suitable for constructing and training predictive models for stress level prediction during sleep.
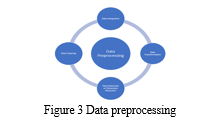
Data preprocessing was a crucial stage to guarantee the quality and applicability of the data for machine learning tasks. This involved several steps, beginning with examining missing data. In this project, it was determined that no columns had missing values, simplifying the preprocessing process.
The next step involved data cleaning, where outliers or anomalies were identified and corrected to enhance the dataset's quality and ensure unbiased results in subsequent analyses. Feature engineering was also essential, involving the selection of the most pertinent attributes for stress prediction. This likely included leveraging domain-specific knowledge and conducting data exploration to identify the most influential features in determining stress levels.
The data collection and preprocessing phase laid the groundwork for subsequent project steps, such as model training and evaluation. It played a crucial role in ensuring that the data used for stress prediction was of high quality and suitable for the machine learning algorithms employed.
This phase underscored the importance of data integrity and the necessity to meticulously prepare the dataset to derive meaningful insights and accurate predictions regarding sleep-related stress levels.
???????C. Data preprocessing techniques
Data preprocessing techniques are essential steps in the data analysis process, playing a crucial role in determining the quality and suitability of data for subsequent analysis and modeling.
These techniques involve a diverse range of procedures aimed at converting raw and often untidy data into a structured and refined format that can be effectively utilized for various analytical purposes. Among these techniques, one of the primary challenges is managing missing data.
Incomplete or missing data points are frequently encountered with data from the real world and can greatly affect how accurate statistical models are. Data preprocessing addresses this challenge through methods such as imputation, where missing values are replaced with suitable estimates, or deletion, where rows or columns with extensive or insignificant missing data are removed to uphold data integrity.
???????D. Handling Missing data
Managing missing data is a pivotal component of data preprocessing, particularly in the realm of data analysis and machine learning. Missing data can originate from diverse sources, ranging from data entry mistakes to equipment malfunctions or intentional exclusions. It's essential to address missing data meticulously as disregarding it can introduce bias or inaccuracies, thereby impeding the performance of analytical models. The following subsections will look at a number of techniques and approaches for efficiently managing missing data.

???????E. Data exploration and Visualization
Data exploration and visualization are essential for analysts and researchers to derive insights, detect patterns, and make informed decisions. In this section, we will explore the significance of these processes and the various techniques employed for these purposes.
Data exploration commences with a thorough understanding of the dataset, encompassing its structure, variables, and characteristics. This initial phase involves descriptive statistics that summarize key aspects of the data, such as mean, median, standard deviation, and quartiles for numeric variables, as well as frequency tables for categorical variables. These statistics offer an overview of central tendencies and distributions, facilitating the identification of outliers and potential data quality issues.
Visualization serves as a potent tool for conveying information and uncovering patterns within data. One common visualization method is histograms, which provide a graphical representation of the distribution of a numeric variable. Histograms assist in discerning whether the data adheres to a normal distribution, displays skewness, or exhibits multiple peaks. Additionally, box plots serve as another valuable visualization tool, showcasing the distribution of a variable, including measures of central tendency and variability, and aiding in outlier identification.
???????F. Feature Selection Methods
Feature selection stands as a pivotal phase within the data preprocessing process, entailing the selection of a subset of pertinent features from the initial set of variables. The fundamental objective of feature selection aims to reduce dimensionality and remove noise from models that use machine learning in order to increase their efficacy and efficacy. irrelevant or redundant features. In this section, we will delve into diverse feature selection methods and their significance in data analysis.

- Filter Methods: Filter methods are techniques used for selecting features based on statistical measures, assessing their significance without dependence on any particular machine learning algorithm. Common filter methods encompass:
- Correlation Analysis: In this approach the value of the Pearson correlation entre each characteristic and the intended variable is computed. Features exhibiting higher correlation values are deemed more pertinent. Conversely, features with low or negligible correlations may be considered for elimination
- Information Gain: Information gain quantifies the decrease in uncertainty regarding the target variable as a result of understanding the value of a feature. This metric is frequently applied in decision tree-based algorithms.
- Embedded Methods: Embedded techniques include choosing attributes right into the learning process of the model. These methods are commonly employed with certain machine learning algorithms that facilitate the estimation of feature importance, such as:
- L1 Regularization (Lasso): L1 regularization introduces a penalty term into the model's loss function, compelling certain feature coefficients to be zero. Features associated with non-zero coefficients are deemed significant.
The selection of a feature selection method hinges on factors such as the dataset, the specific problem being addressed, and the chosen machine learning algorithm. It's crucial to explore various methods and assess their influence on model performance using techniques such as cross-validation. Feature selection serves to not only improve model interpretability but also mitigate the risk of overfitting, expedite training durations, and streamline the model's complexity.
V. Experimental Setup
A. Feature Importance Analysis
Examining feature importance is a vital stage in comprehending and interpreting the factors influencing predictions generated by machine learning models. This process aids in pinpointing which features or variables exert the most impact on the forecasts generated by the model, providing insightful information for decision-making, refining models, and enhancing domain-specific understanding. In this section, we explore the concept of feature importance analysis and various methods to execute it effectively.
???????B. Visualizing Feature Relationships
Visualizing feature relationships is a crucial component of exploratory data analysis in machine learning and data science. It involves creating graphical representations to illustrate how different features or variables within a dataset interact with one another. This visualization process can unveil patterns, correlations, and insights that may not be readily apparent through numerical analysis alone. In this section, we will discuss various techniques and methods for visualizing feature relationships.
Line Plots: Line plots are employed to visualize the relationship between two continuous variables across a continuous or discrete interval. They are extremely successful when the variable that is autonomous is only one. (e.g., time) and the other as the dependent variable. Line plots can unveil trends, fluctuations, and seasonality within the data.
???????C. Correlation Analysis
Correlation analysis stands as a fundamental technique in data analysis and statistics, employed to quantify and comprehend the relationship between two or more variables. It proves particularly invaluable in discerning patterns, dependencies, and potential associations within a dataset. In this section, we will explore the concept of correlation analysis, its various types, and its significance in data exploration and decision-making.
VI. Results and Discussion
The dataset underwent separated using the train_test_split function into testing and learning sets, whereas the confusion_matrix and classification_report functions were imported to assess the classification outcomes.
Various machine learning models, such as Logistic Regression, Random Forest, Decision Tree, Support Vector Machine (SVM), Gaussian Naive Bayes, and k-Nearest Neighbors (k-NN) models, were imported. These models would subsequently be employed for diverse tasks within the data analysis or machine learning workflow.
???????A. Importing Our Dataset
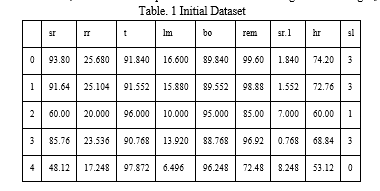
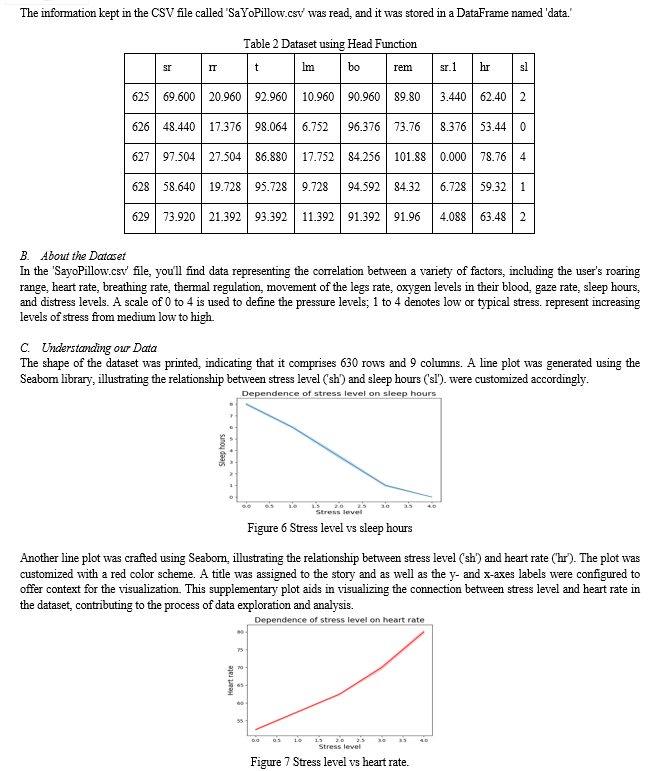
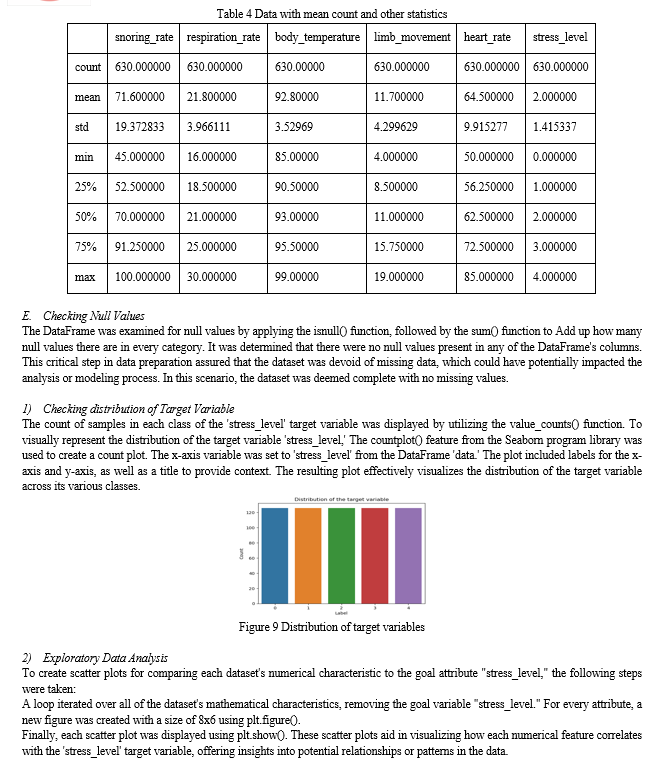
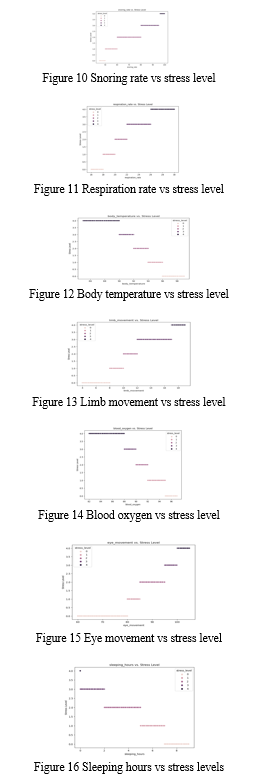
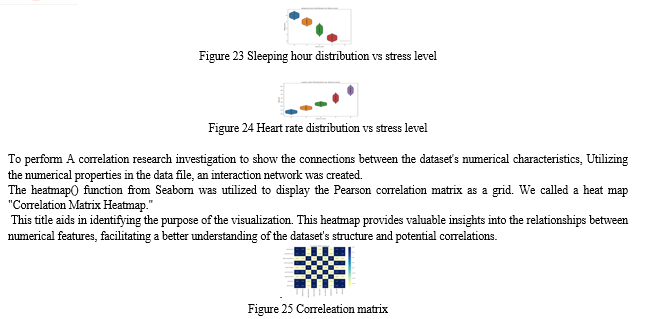
The CSV file titled 'SaYoPillow.csv' was read, and the data within the file was stored in a DataFrame named 'data.'
To obtain an initial overview of the data, The database's top five rows were shown using the head image () function.


???????F. Splitting our Dataset
The data was prepared for machine learning by splitting it into the target variable (y) and characteristics (X). The info was then split into training and testing sets, with a 20% testing group and an 80% training collection. set. Here's a summary of the steps:
The features (X) were created by dropping The line named "stress_level" from the DataFrame " information."
The target variable (y) was assigned the 'stress_level' column from the DataFrame 'data.'
The train_test_split utility was used to divide the data into sets for both training and testing. Eighty percent of the data were in the training set (X_train, y_train); the remainder were from the testing set (X_test, y_test), contained 20% of the data.
The shapes of the training and testing sets were displayed to confirm the size of each set:
X_train shape: (504, 8)
y_train shape: (504,)
X_test shape: (126, 8)
y_test shape: (126,)
These shapes indicate that the training set contains 504 samples and the testing set contains 126 samples, with 8 features in each sample. The target variables have corresponding shapes, with 504 values between the 126 items in the instruction set and actual testing set. This split is common for machine learning tasks to train models on a portion of the data and evaluate their performance on a separate portion.
???????G. Identifying Important features
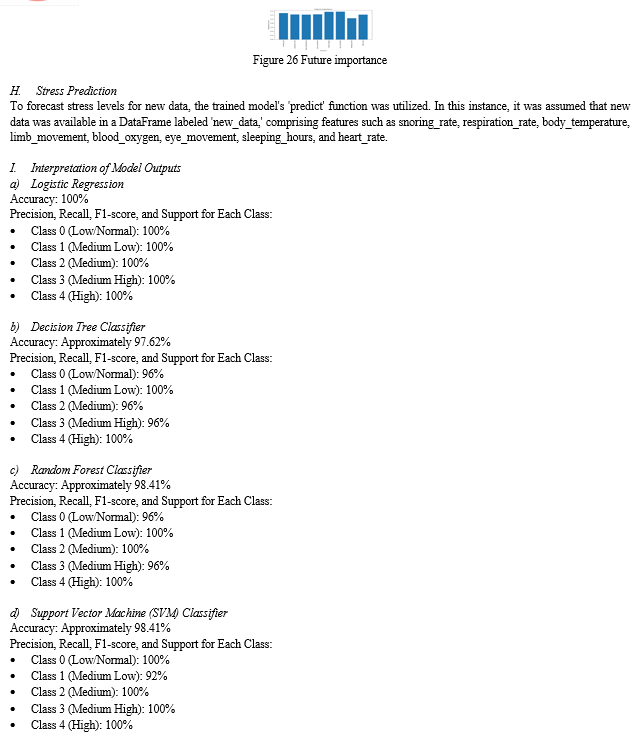
To print the feature number, name, and importance score for each feature, a loop was used. The importance scores were printed in descending order. After calculating feature importances, a bar chart was created to visualize the relative importance of each feature:
A loop iterated through each feature in the training data (X_train), printing the feature number, name, and importance score in descending order. Following the calculation of feature importances, a bar chart was generated using Matplotlib's barplot() function. The plot was given a title to provide context. The x-axis labels were set to feature names from the training data (X_train), and the rotation=90 parameter rotated the x-axis labels for better readability.X-axis and y-axis labels were added to the plot to provide clarity and context. The layout was adjusted for a cleaner presentation.
The resulting bar chart offers a visual representation of the importance of each feature in making predictions with the Random Forest model. This information is valuable for understanding which features are most influential in the model's decision-making process.
 ???????
Conclusion
This paper focused on analyzing and predicting stress levels using a dataset comprising diverse physiological parameters. The dataset underwent thorough preparation, and extensive exploration was conducted to understand its composition and quality deeply. Through data visualization techniques, valuable insights were gained regarding the relationships between stress levels and various physiological attributes, laying a strong groundwork for subsequent analyses. The primary objective of this research was to create and assess algorithms using machine learning that may be used to forecast stress degrees. Numerous models—K-Nearest Neighbors (k-NN), Gaussian Naive Bayes, Random Forest, Decision Tree, Support Vector Machine (SVM), and Logistic Regression were rigorously trained and tested. Impressively, these models exhibited outstanding performance, with some achieving perfect accuracy on the test data. The successful development of these models offers promising prospects for practical applications in healthcare, well-being monitoring, and stress management. However, it\'s crucial to acknowledge the study\'s limitations, particularly concerning data quality and representation. The models\' performance is closely linked to the dataset\'s quality and diversity. Recognizing this, further research and data collection efforts can contribute to improving the accuracy and reliability of stress level predictions. This paper establishes a solid foundation for leveraging machine learning in assessing and managing stress, with the potential to positively impact individuals\' health and overall well-being.
References
[1] J. M. Roveda, W. Fink, K. Chen, and W. Wu, “Psychological Health Monitoring for Pilots and Astronauts by Tracking Sleep-Stress-Emotion Changes,” in Proceedings of the IEEE Aerospace Conference, 2016, pp. 1–9. [2] K. S. Han, L. Kim, and I. Shim, “Stress and sleep disorder,” Experimental neurobiology, vol. 21, no. 4, pp. 141–150, 2012 [3] T. Akerstedt, “Psychosocial stress and impaired sleep,” Scand J Work Environ Hea, vol. 6, no. 32, pp. 493–501, 2006 [4] S. Takahashi, L. Kapas, J. Fang, and J. M. Krueger, “Somnogenic ´ relationships between tumor necrosis factor and interleukin-1,” American Journal of Physiology-Regulatory, Integrative and Comparative Physiology, vol. 276, no. 4, pp. R1132–R1140, 1999 [5] M. T. Bailey, S. G. Kinsey, D. A. Padgett, J. F. Sheridan, and B. Leblebicioglu, “Social stress enhances il-1? and tnf-? production by porphyromonas gingivalis lipopolysaccharide-stimulated cd11b+ cells,” Physiology & behavior, vol. 98, no. 3, pp. 351–358, 2009 [6] E.-J. Kim and J. E. Dimsdale, “The Effect of Psychosocial Stress on Sleep: A Review of Polysomnographic Evidence,” Behavioral sleep medicine, 2007 [7] H. R. Colten and B. M. Altevogt, Sleep Disorders and Sleep Deprivation: An Unmet Public Health Problem. Institute of Medicine (US) Committee on Sleep Medicine and Research, 2006. [8] de Groen JH, O. den Velde W, J. E. Hovens, P. R. Falger, E. G. Schouten, and van Duijn H, “Snoring and Anxiety Dreams,” Sleep, vol. 16, no. 1, pp. 35–6, Jan. 1993. [9] G. Gutierrez, J. Williams, G. A. Alrehaili, A. McLean, R. Pirouz, R. Amdur, V. Jain, J. Ahari, A. Bawa, and S. Kimbro, “Respiratory Rate Variability in Sleeping Adults without Obstructive Sleep Apnea,” Physiol Rep, vol. 4, no. 17, Sep. 2016. [10] E. B. Simon and M. P. Walker, “Sleep loss causes social withdrawal and loneliness,” Nature Communications, vol. 9, no. 3146, 2018 [11] S. Chikahisa, S. Harada, N. Shimizu, T. Shiuchi, A. Otsuka, S. Nishino, and H. Sei, “Mast cell involvement in glucose tolerance impairment ´ caused by chronic mild stress with sleep disturbance,” Scientific reports, vol. 7, no. 1, p. 13640, 2017 [12] J.-M. Lee, W. Byun, A. Keill, D. Dinkel, and Y. Seo, “Comparison of Wearable Trackers Ability to Estimate Sleep,” International Journal of Environmental Research and Public Health, vol. 15, no. 6, 2018 [13] Zhenyu Chen and M. Lin and Fanglin Chen and N. D. Lane and G. Cardone and Rui Wang and Tianxing Li and Yiqiang Chen and T. Choudhury and A. T. Campbell, “Unobtrusive sleep monitoring using smartphones,” in Proceedings of the 7th International Conference on Pervasive Computing Technologies for Healthcare, 2013, pp. 145–152 [14] J. A. Arnold, Y. Cheng, Y. Baiani, and A. M. Russell, “Systems and techniques for tracking sleep consistency and sleep goals,” US Patent 20 170 347 946A1, 2016 [15] N. Watson, S. Lockley, R. Raymann, and M. Oz, “SleepScore Max.” [Online]. Available: https://www.sleepscore.com/
Copyright
Copyright © 2024 Touseef Ahmad Lone, Yadwinder Singh. This is an open access article distributed under the Creative Commons Attribution License, which permits unrestricted use, distribution, and reproduction in any medium, provided the original work is properly cited.

Download Paper
Paper Id : IJRASET59452
Publish Date : 2024-03-26
ISSN : 2321-9653
Publisher Name : IJRASET
DOI Link : Click Here
 Submit Paper Online

